
Bitcoin consolidates around $88–89K amid sustained sell-side pressure in derivatives markets. Two charts show synchronized deterioration in both cumulative pressure and current momentum - the situation warrants heightened attention.
TL;DR
This brief analyzes seller pressure through the lens of two taker flow metrics. Cumulative flow and smoothed momentum are synchronously in negative territory - the market is in a cautious mode.
Broader context: While taker flow captures short-term pressure, structural levels like Realized Price Bands define where demand historically strengthens.
→ Bitcoin Realized Price Bands Explained: Cycle Analysis, Signals and Historical Examples
Bitcoin Net Taker Flow 24H - Flow Z (7d)
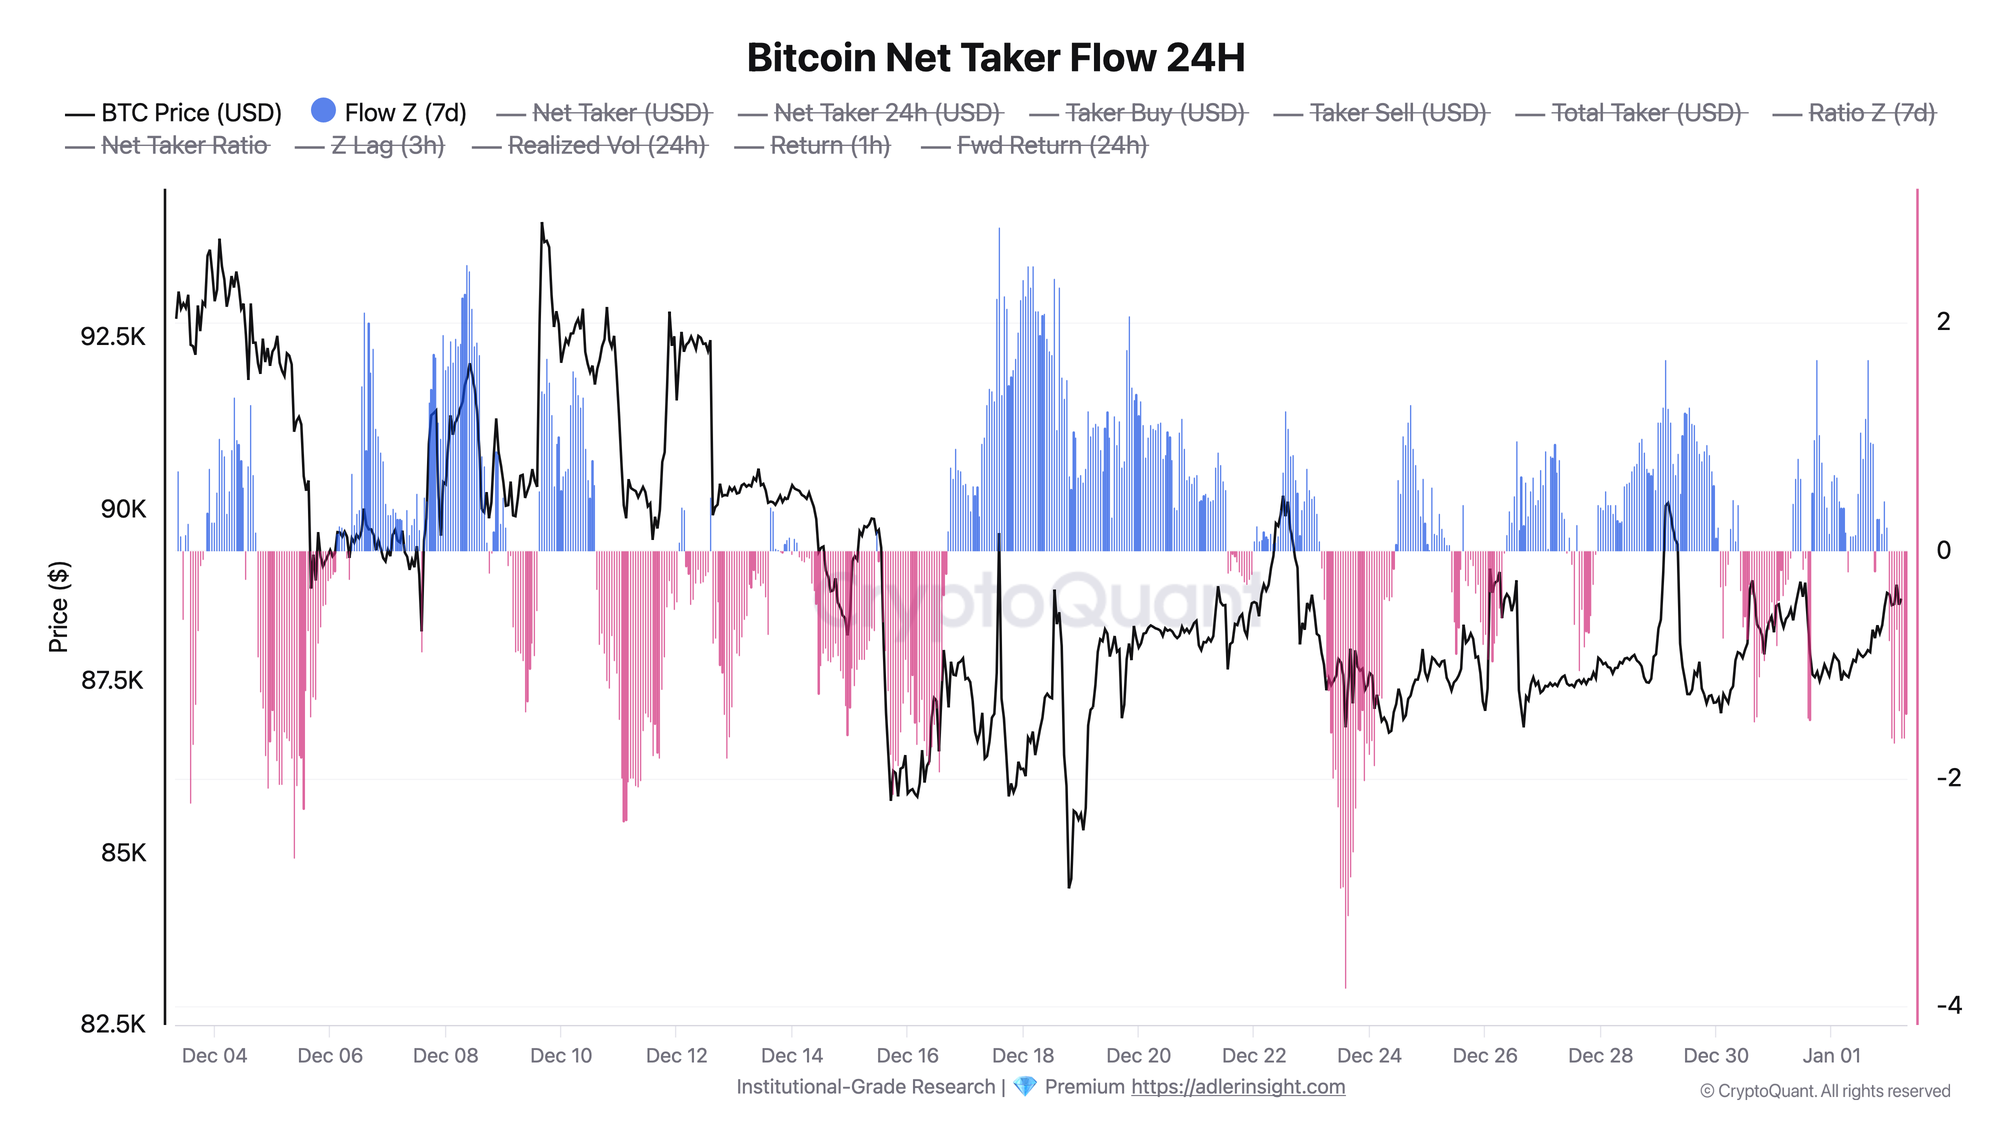
The metric shows the sum of Net Taker Volume over 24 hours, normalized via z-score relative to the last 7 days. Positive values (blue bars) indicate aggressive buyer dominance, negative values (pink) - seller dominance.
The chart shows that after a local peak in buy-pressure around New Year, the indicator reversed and moved into negative territory. Current values are in the -1 to -2 range on the z-score scale - this represents moderate but not extreme seller pressure. Previously, similar readings were accompanied by increased price vulnerability to downside, though they are not a trigger by themselves.
Key takeaway: cumulative sell-pressure is present but has not yet reached extreme levels below -2σ. The deterioration trigger would be Flow Z sustaining below -2 alongside price weakness (support breakdown or range expansion to the downside). A positive signal would be a reversal to neutral zone without losing current price levels.
Bitcoin Net Taker Flow 24H - Ratio Z (7d) SMA(30)

The metric reflects momentum of market participant aggression: hourly long/short taker volume ratio, normalized and smoothed to filter noise. Unlike cumulative flow, this indicator reacts faster to sentiment shifts.
Smoothed Ratio Z shows a steady decline from positive values observed in late December. The indicator has crossed into negative territory and stands at -0.3, corresponding to a moderate bearish pressure regime. This is not an extreme reading, but notably the transition into negative zone occurred in sync with deteriorating cumulative Flow Z.
Momentum confirms bearish bias. The -0.3 reading on SMA(30) indicates a sustained bearish tilt in current aggression dynamics. Further pressure below -0.4 would signal potential acceleration of the decline.
Comparing the two charts reveals signal synchronicity: cumulative Flow Z in the -1 to -2 zone, momentum Ratio Z SMA(30) at -0.3. Both indicators point in the same direction - sell-side dominates. Metrics are aligned and pointing in the same direction, reducing the chance of a single noisy signal. Flow Z remains the primary indicator - its move below -2 with current negative momentum would become the trigger for decline.
For a complete understanding of the index methodology, including a 10-year backtest, forward return tables by z-regime, and a framework for combining with OI/Funding indices - see Taker Buy/Sell Aggression Index: SQL of the Week #006.

FAQ
Why doesn't price fall with negative Net Taker Flow?
Taker flow shows market order aggression but does not account for limit orders. Negative flow with stable price means large participants are posting bid liquidity and absorbing seller pressure. This situation can persist as long as buyers have capital reserves to defend levels.
What z-score level should be considered critical?
Historically, Flow Z values below -2σ often preceded corrections, while above +2σ - local tops. Current readings of -1.5σ for Flow Z and -0.3 for Ratio Z SMA(30) are in the elevated attention zone. The critical trigger would be a combination of Flow Z < -2 and further Ratio Z SMA(30) decline below -0.4.
CONCLUSIONS
The Bitcoin market is in a neutral-bearish pressure regime with confirmed signal synchronicity. Cumulative Net Taker Flow shows moderate aggressive seller dominance in the -1 to -2σ zone, while smoothed momentum Ratio Z SMA(30) at -0.3 confirms that pressure is trend-driven rather than random. Price is holding due to limit order absorption of pressure - this is a temporary buffer whose effectiveness diminishes with synchronized deterioration of both metrics. Primary deterioration trigger: Flow Z sustaining below -2 while negative momentum persists or deepens. Primary risk - exhaustion of bid liquidity amid continued sell-pressure, which could lead to an impulsive decline toward the $85–87K zone.