
Bitcoin holds around $91K with divergence between rapid improvement in speculative metrics and deteriorating fundamental flows, while the stress index stands at 67.8 in the elevated zone.
TL;DR
The market remains in a bear pressure phase: fast metrics have improved, but the fundamental structure continues to deteriorate. Market stress is elevated, making any recovery fragile.
#BTC #OnChain #Derivatives #MarketStructure
Bitcoin Bull-Bear Structure Index
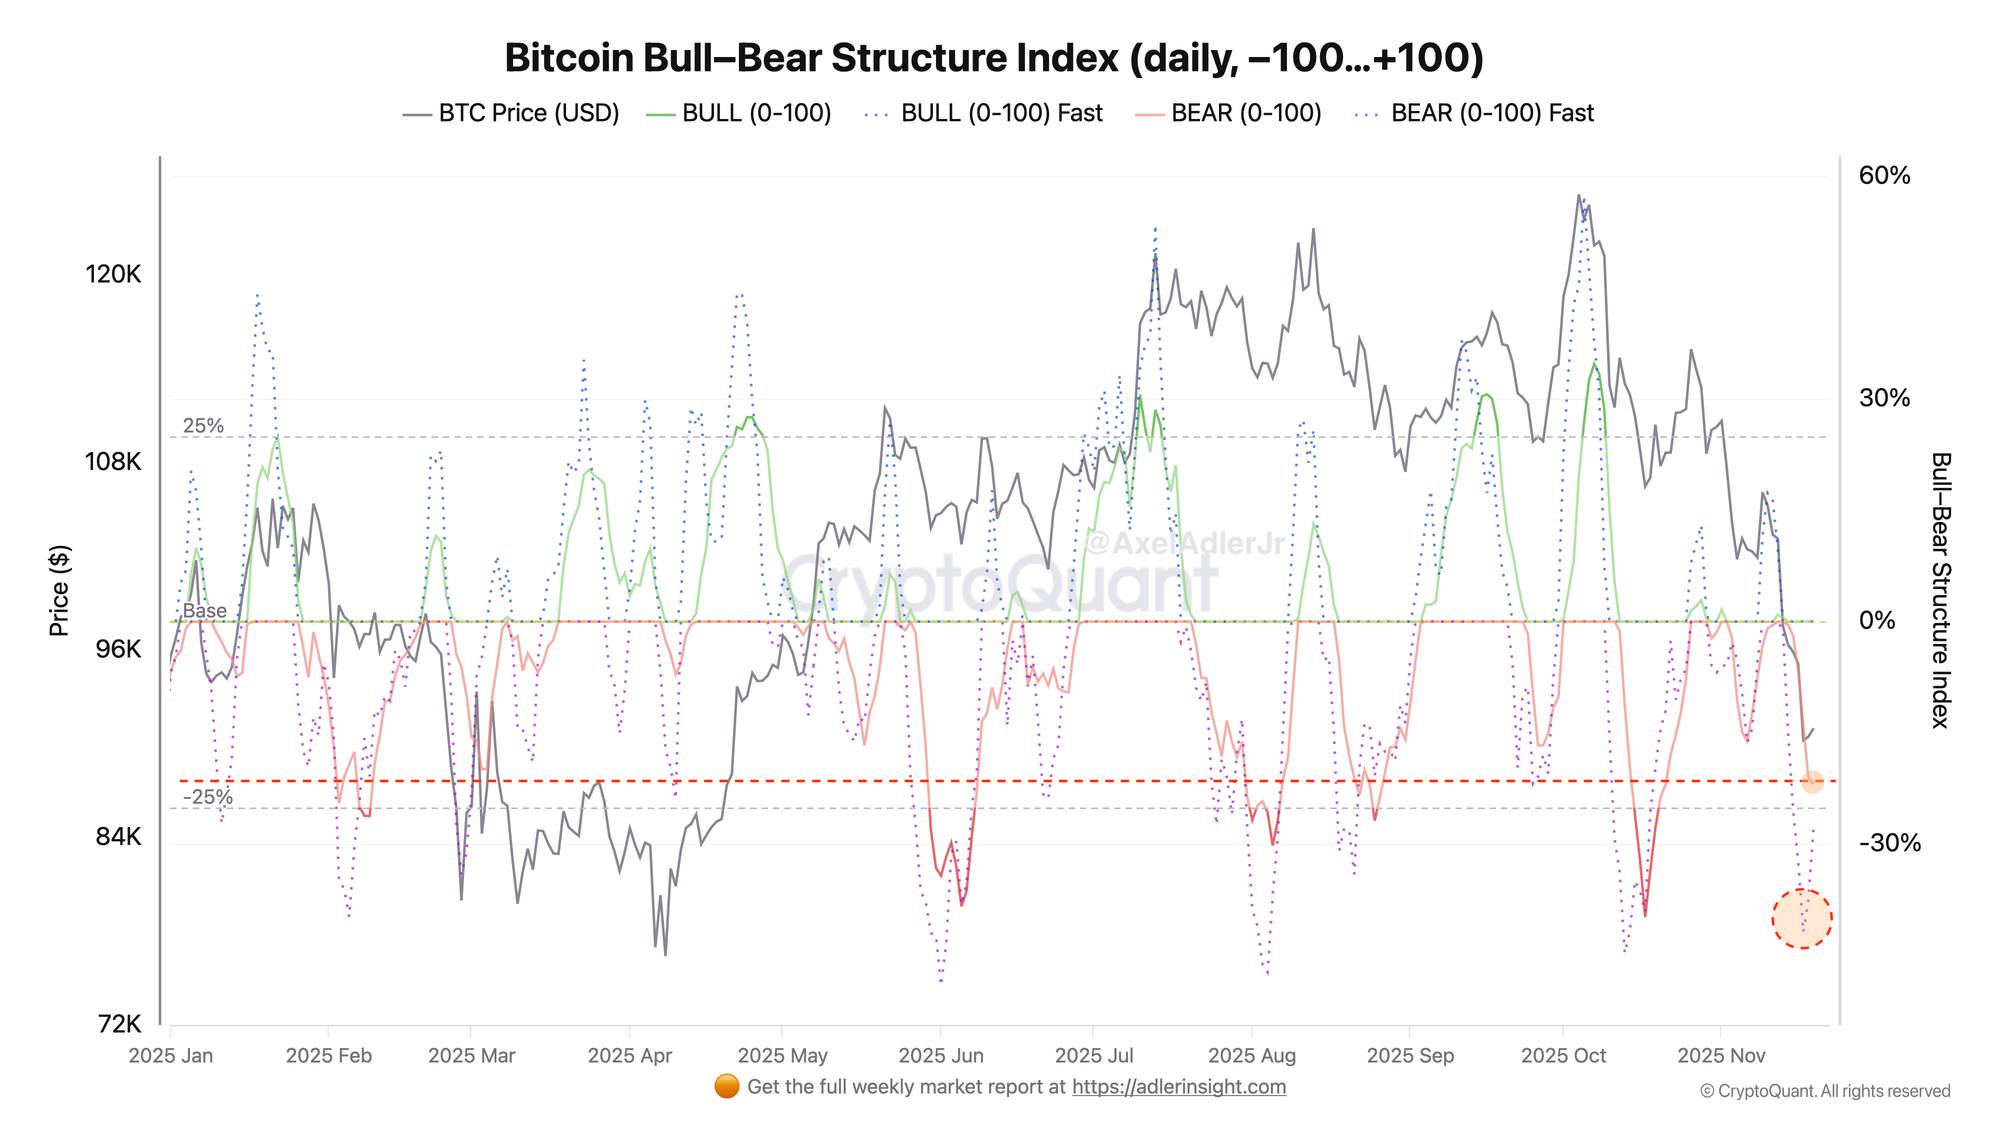
The structure remains persistently bearish with divergence between fast and slow indicators. The Fast version recovered from -41.89 to -27.82 over two days, signaling easing short-term pressure (taker flow, derivatives). However, the Slow indicator degraded from -14.04 to -21.90, reflecting structural deterioration in ETF flows and on-chain metrics. Both indicators are deep in bearish territory (dashed line at -25 marks the critical zone).
Bitcoin Local Stress Index
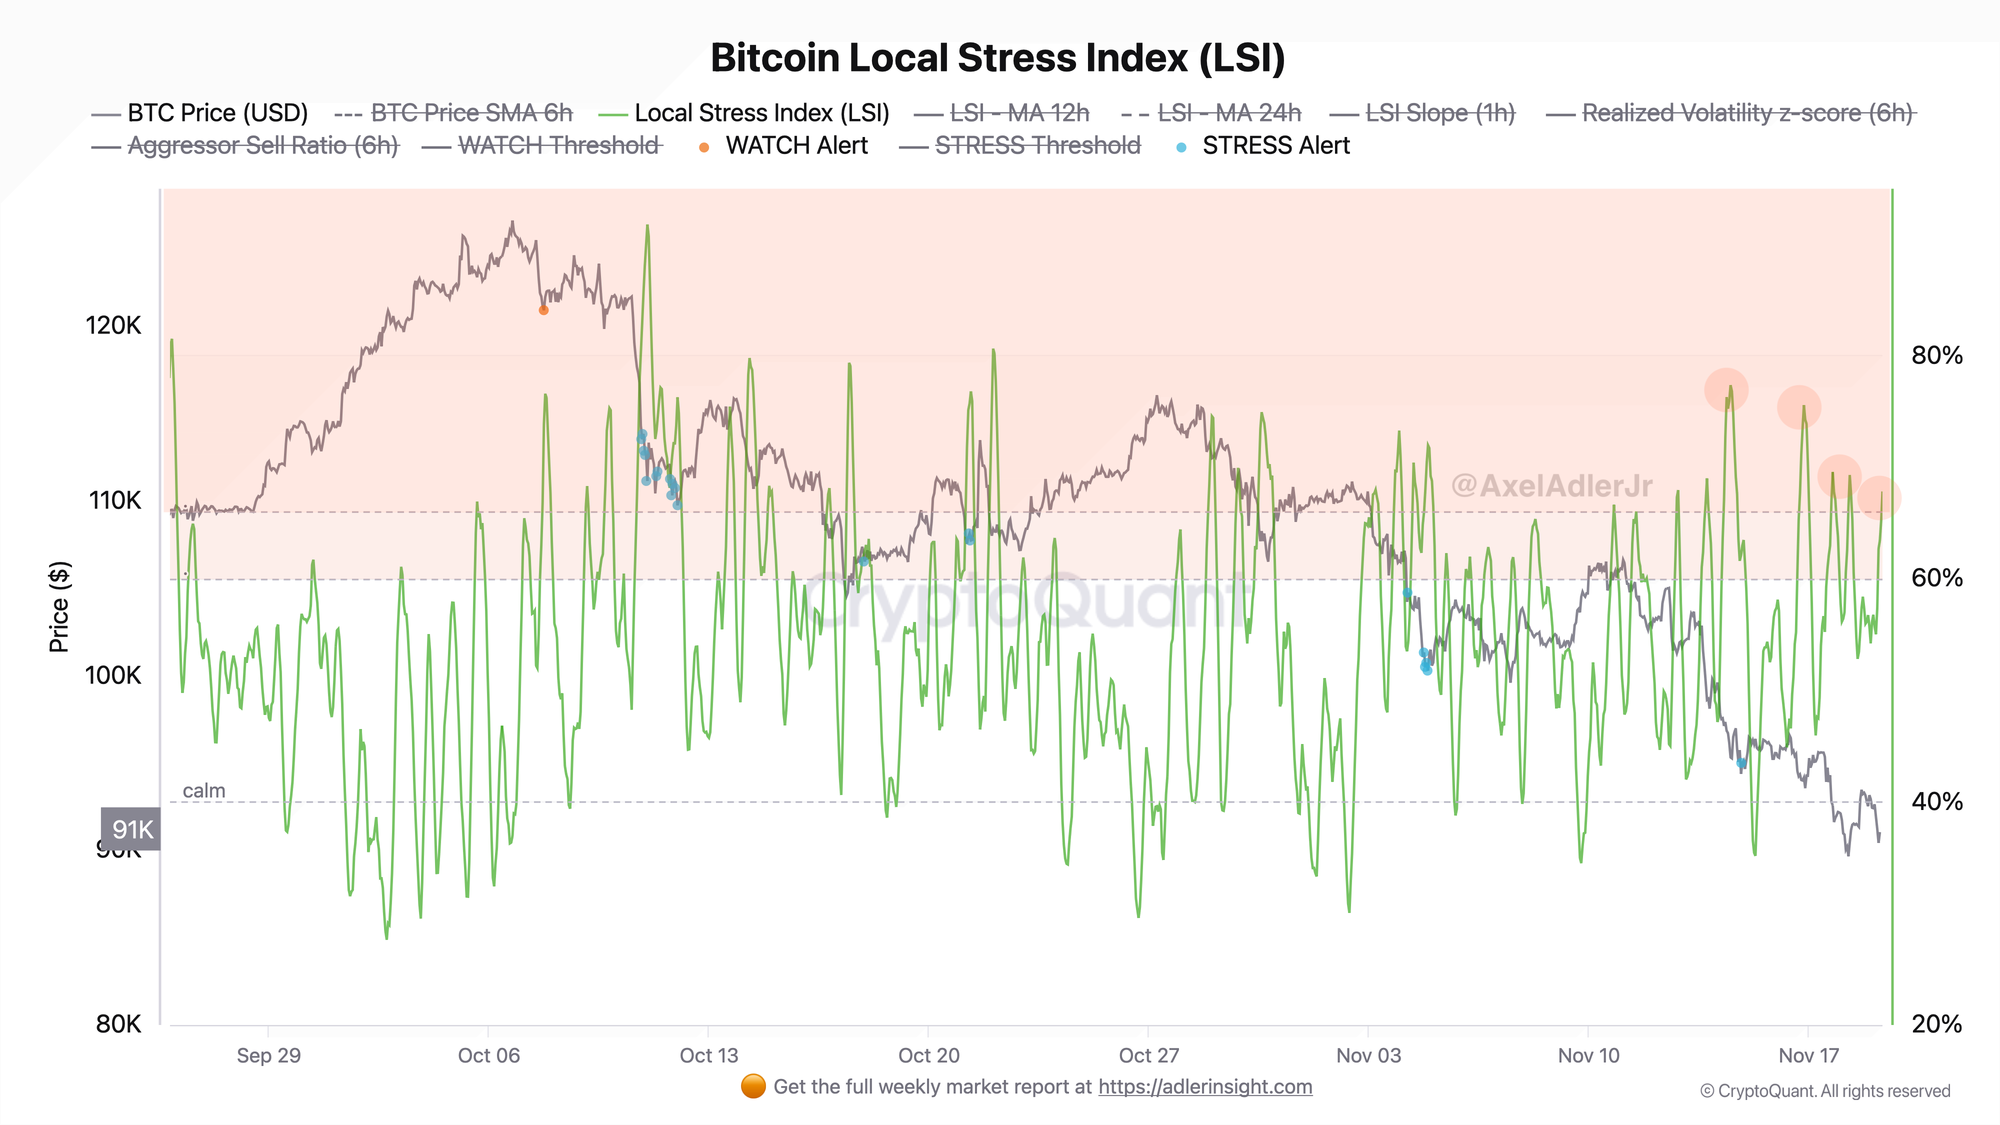
Local market stress remains elevated following the acute correction phase of November 17-18. The Local Stress Index stands at 67.8, corresponding to the "elevated" zone - above the WATCH threshold of 64. Peak tension was recorded on the evening of November 17 at the moment of the $92K breakdown, when realized volatility spiked sharply (z-score up to 4.55) and aggressive sells intensified. Over the past 24 hours, the index has partially consolidated; however, short-term dynamics (slope +2.62) indicate renewed stress growth over the last several hours.

FAQ
What does the current Bull-Bear Structure picture indicate?
The market is in a bear pressure phase, with fundamental flows deteriorating (Slow -22). A reversal to bullish structure requires both indicators to return to positive territory, which is not the case currently.
How should Local Stress Index signals be interpreted in today's context?
LSI in the elevated zone means increased probability of sharp movements. If stress continues to rise, Tail Risk Watch activation is possible, followed by degradation to a STRESS EVENT.
CONCLUSIONS
The current market structure points to continued bear pressure: short-term metrics show partial recovery after the sharp correction, but fundamental flows and stress indicators signal that the recovery remains fragile. The market is balancing in a zone of elevated tension.