
Bitcoin price is trading at the $95K level, Adaptive Momentum registers the third extreme signal in three years.
TL;DR
Bitcoin is trading near $95K, and Adaptive Momentum registers the third extreme bearish signal since 2023. However, due to a shift in market structure, such extremes are no longer interpreted as automatic reversal signals. Meanwhile, the Positioning Index recovered over the weekend from deep capitulation to a neutral level, indicating partial relief of short-term bearish pressure.
#Bitcoin #OnChain #Capitulation
Bitcoin Adaptive Momentum Index
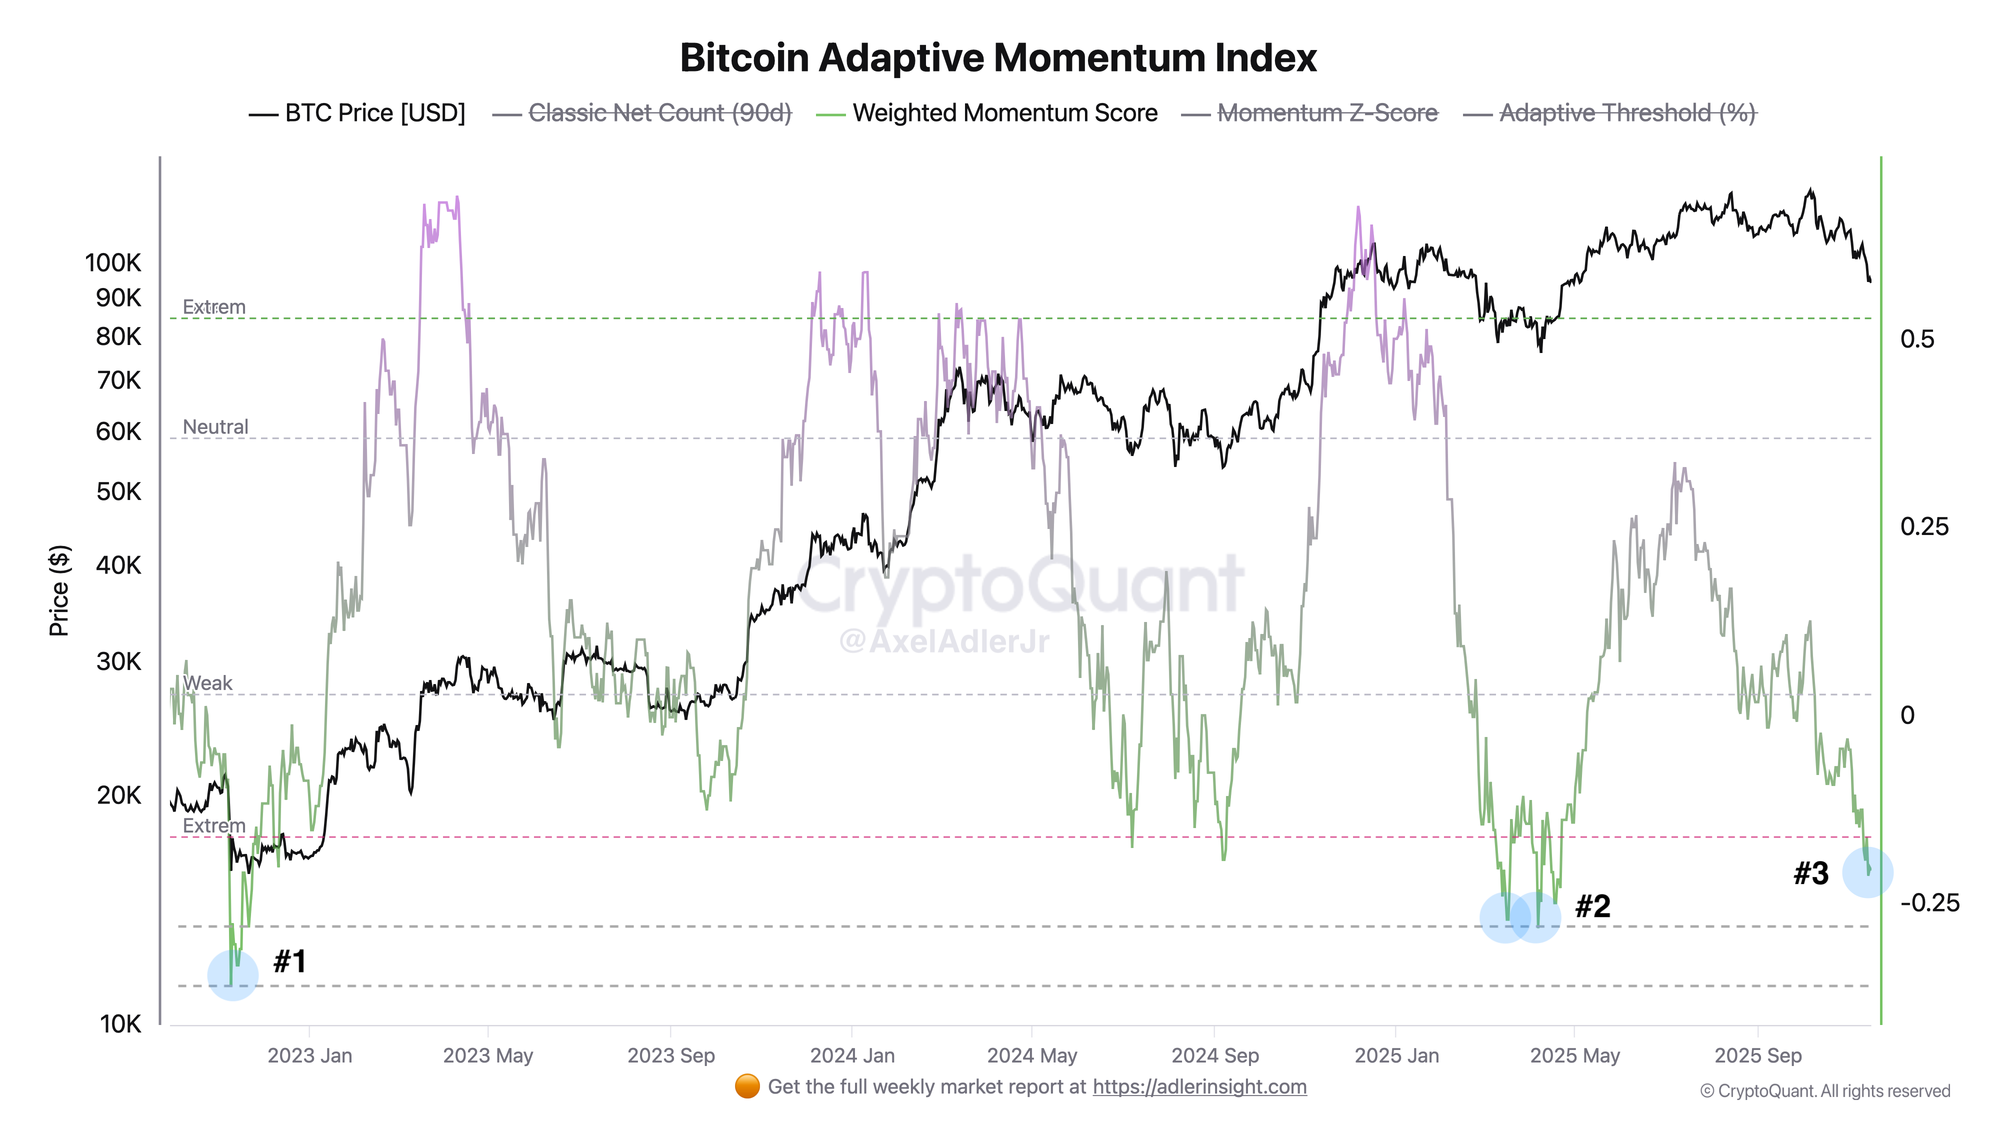
Weighted Momentum Score has dropped into the "Extreme" zone (below -0.20) - the third extreme signal since 2023. The index registers strong bearish pressure. The Weighted Momentum Score metric has broken through the lower threshold and is in the extreme values zone. In bull markets, such extremes marked zones of local/global bottom formation before reversals. The $95K price is trading 12% below Friday's $97.6K and 24% off the October peak of $125K, but market structure has changed, as we wrote in the previous brief, so current signals are perceived differently.
Bitcoin Positioning Index
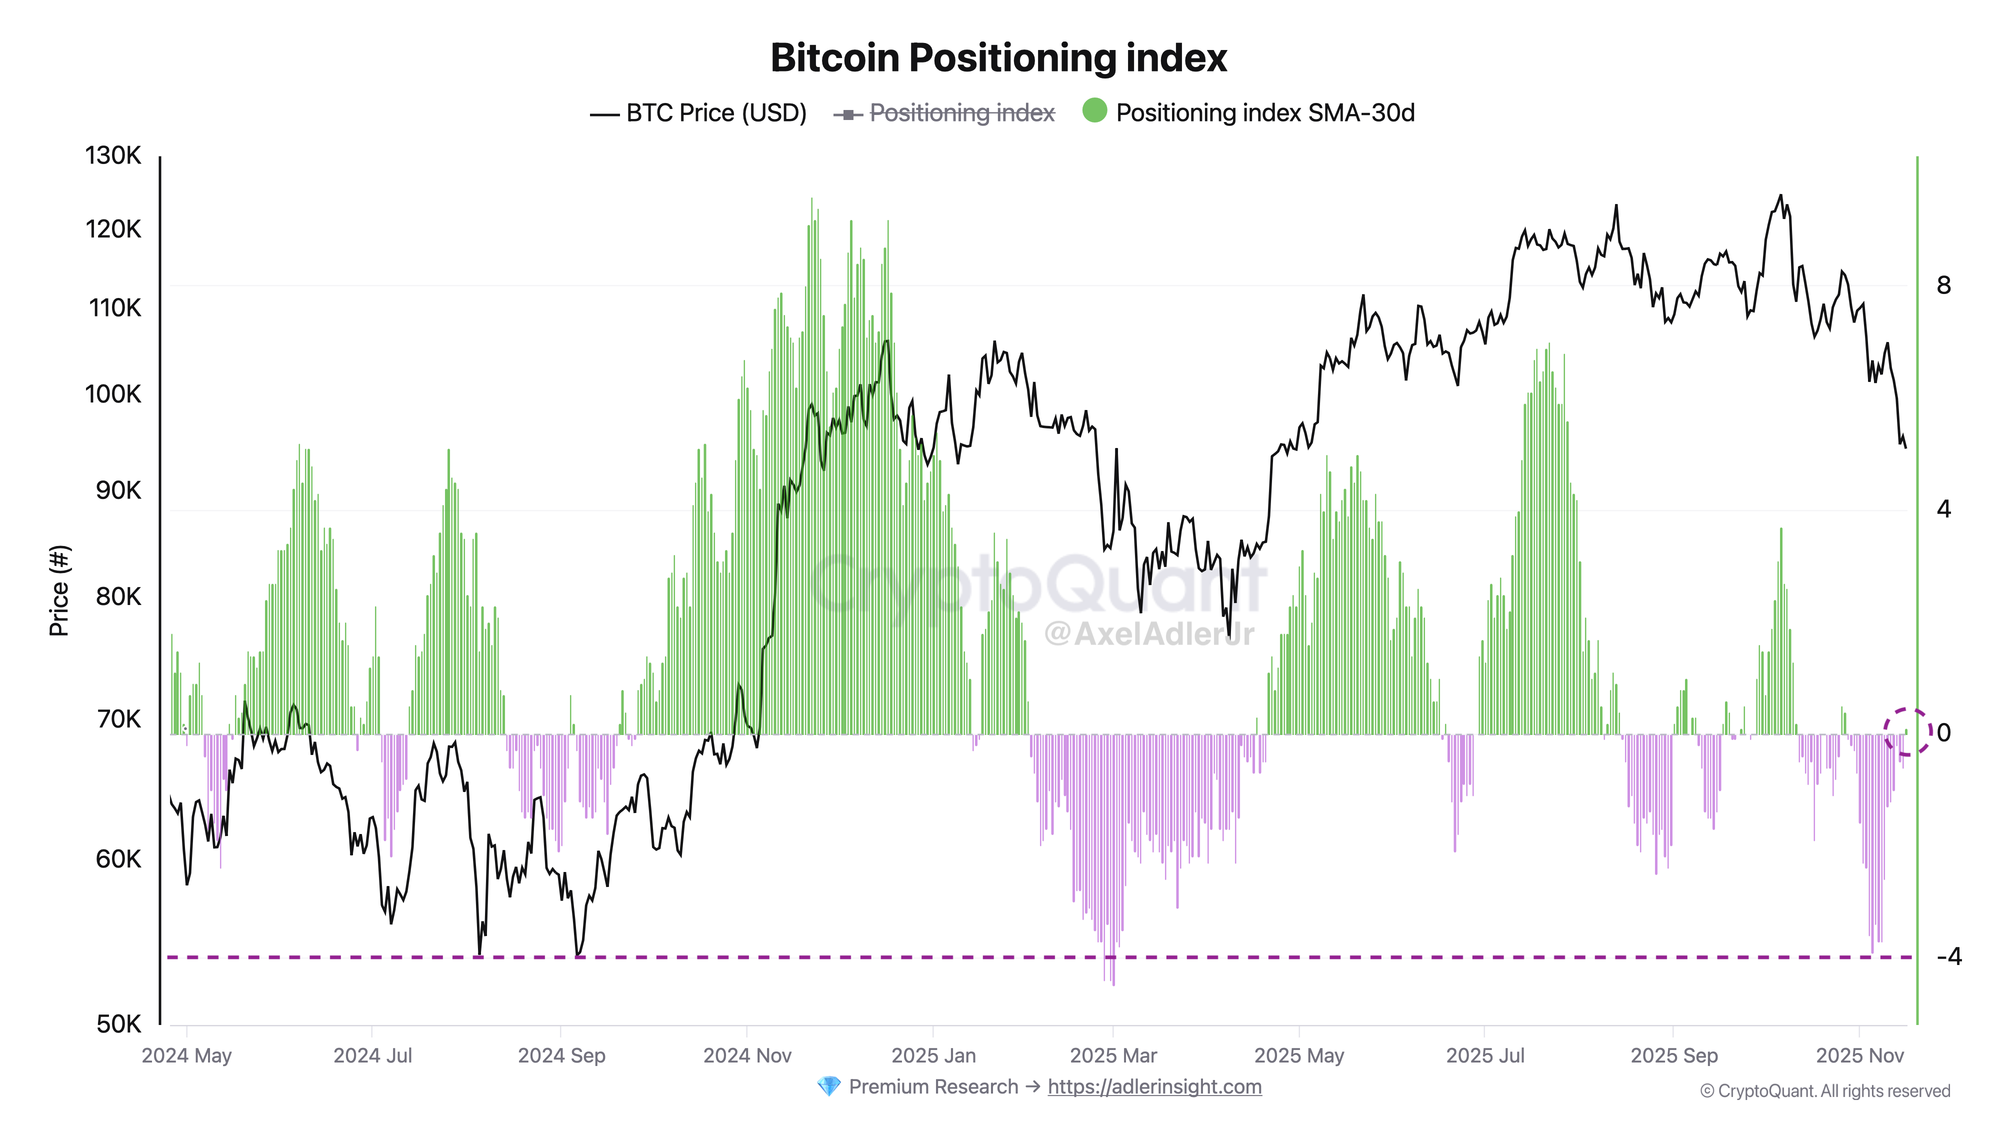
Positioning Index measures the aggregate direction and strength of futures market positions - how aggressively participants are opening longs or shorts. After Friday's pressure of -4 (extreme capitulation), the metric crossed the zero level and became neutral, meaning bearish pressure has eased as of this hour.

FAQ
What does the current picture on the Adaptive Momentum Index chart mean?
The third extreme signal in three years; such levels (below -0.25) in a bull market have formed bottoms before reversals. But market structure has changed, as we wrote in the previous brief, so current signals are perceived differently.
How to interpret the Positioning Index chart signals in the context of the day?
Weighted Momentum Score has risen to zero - this is a local easing of aggressive bearish pressure.
CONCLUSIONS
Over the weekend, the Positioning Index recovered from the extreme zone to a neutral level; bears have slightly eased their pressure, but the Bitcoin Adaptive Momentum remains in the extreme bearish zone, reflecting the long-term market sentiment.