
Bitcoin Bull-Bear and Futures Flow indices show bearish regime, price is 11% below fair value.
TL;DR
Bitcoin is trading around $88K, which is 11% below the 30-day fair value of $99.2K. Both indices remain in bearish regime, but short-term dynamics indicate an attempted reversal.
#Bitcoin #OnChain #Derivatives
Bitcoin Bull-Bear Structure Index
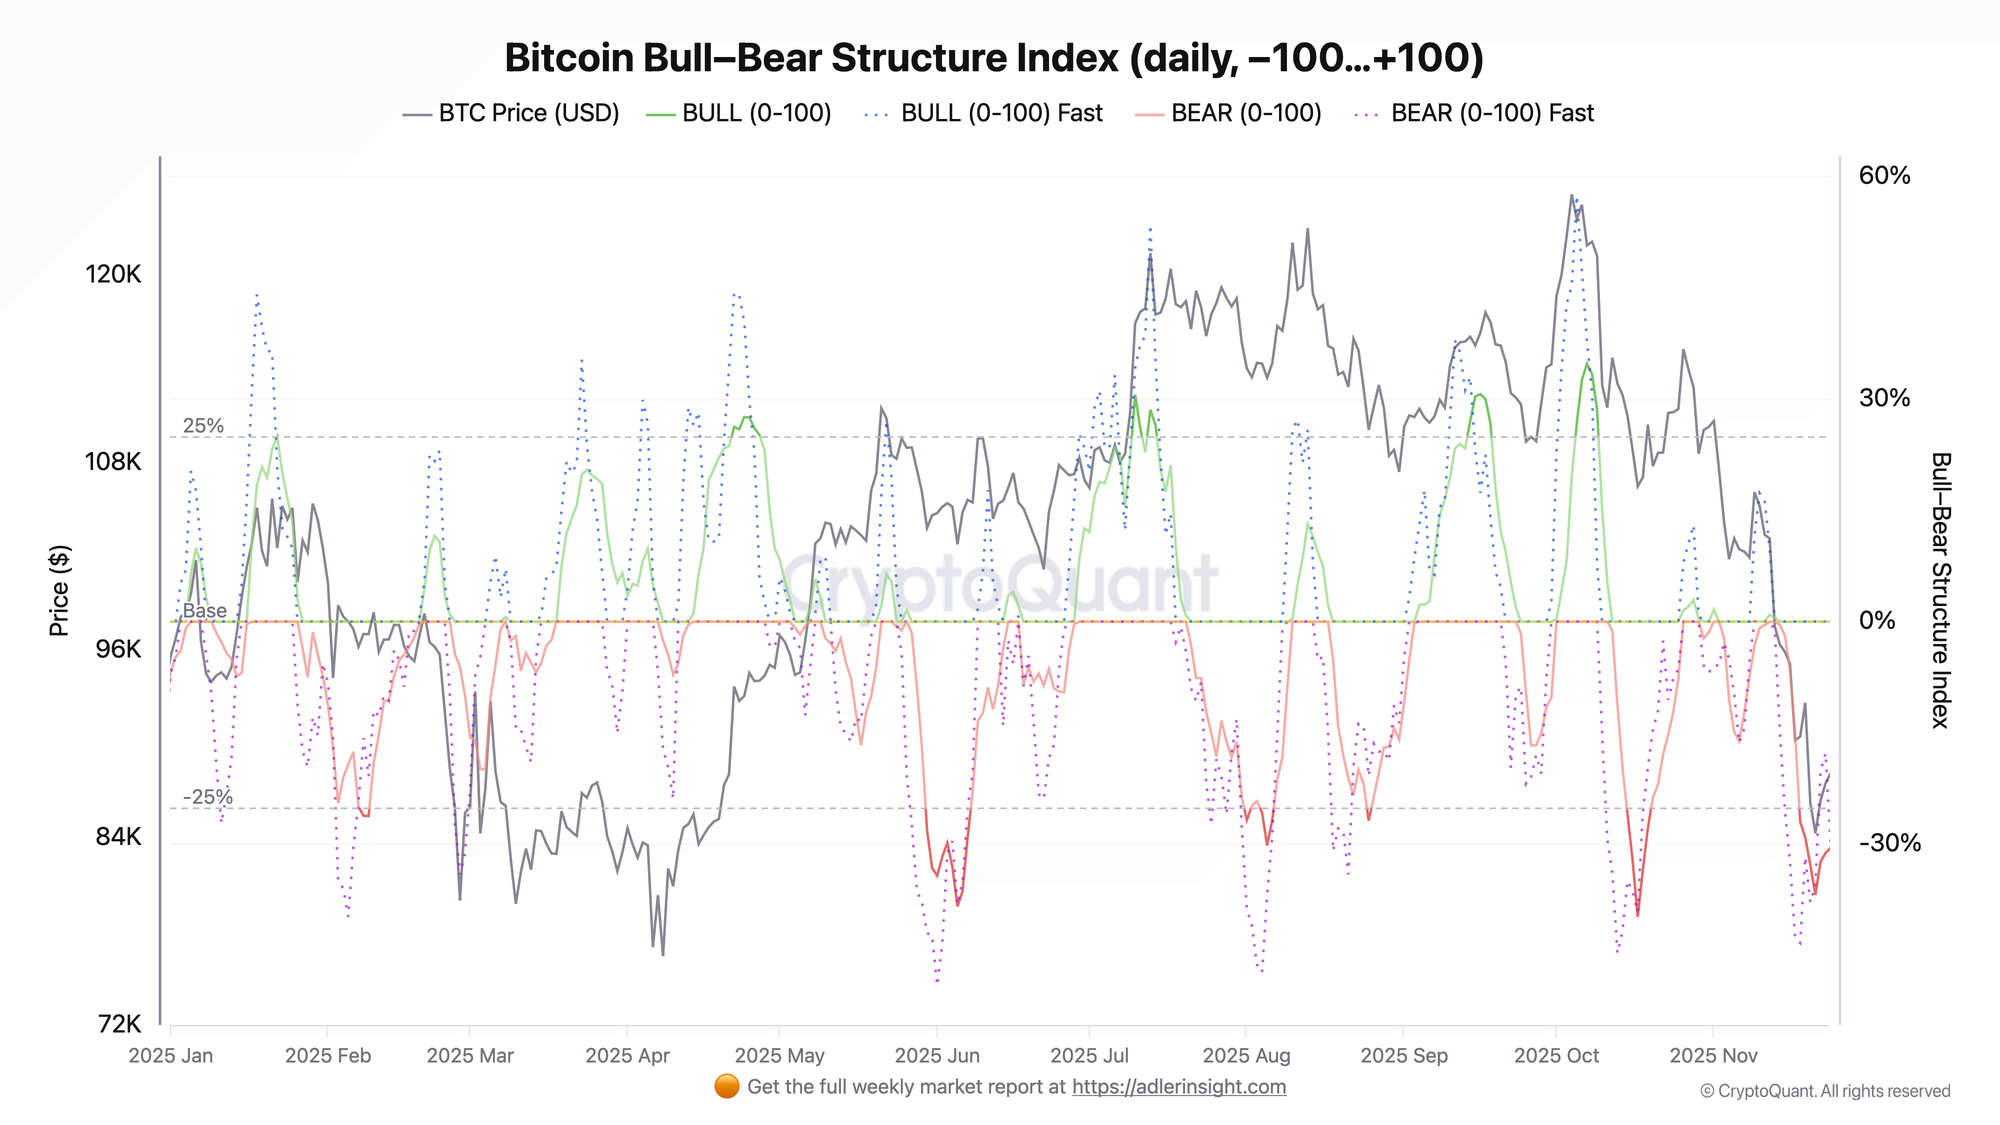
The index shows sustained shift to the bearish side since November 11. The red line (BEAR) has moved deep into negative territory (-36%) and is currently reversing. Price is consolidating around $87K with an attempt to recover after the drop to $80K. Fast versions of the indices demonstrate increased volatility with a clear reduction in bear pressure, the metric has risen from -43 to -20.
Bitcoin Futures Flow Index
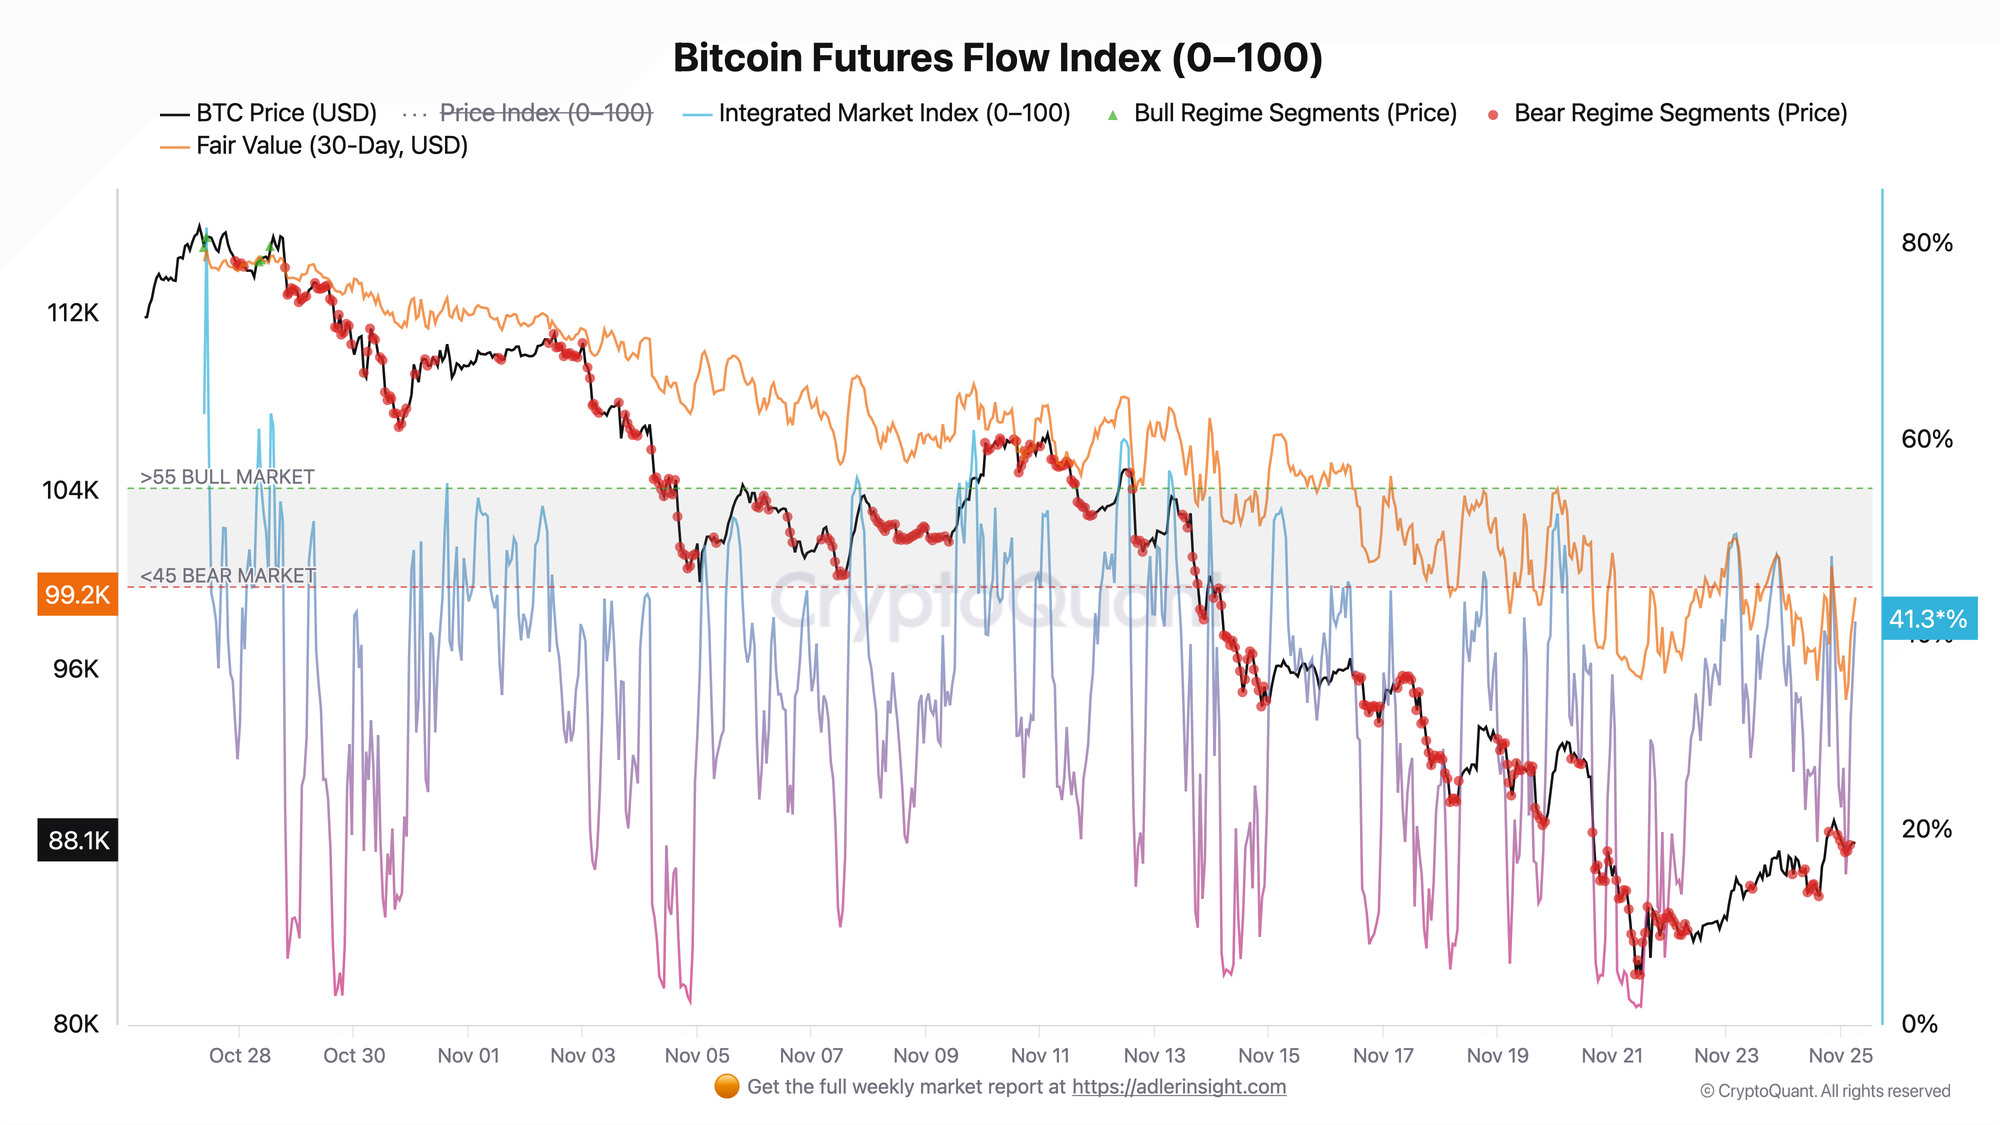
In the futures market, the index remains in bearish regime, the metric has risen to higher values, but without upward breakthroughs above 55. A breakthrough above 55 would signal an attempted transition of the market to bullish regime. Current fair value (orange line) is at the $99K level, indicating an undervaluation of the current price by $11K.
Both indices show the market attempting to exit the bearish regime that Bitcoin has been in for over a month.

FAQ
What does the current Bull-Bear Structure picture mean?
BEAR index in the -30% zone indicates sustained bearish pressure that began in late October and is currently declining.
How to interpret Futures Flow Index signals?
Index at 41% is bearish territory (below 45). The main signal is the gap between price ($88K) and fair value ($99K) of $11K or 11.2%. As long as the index doesn't break 45, the market remains in bear regime.
CONCLUSIONS
Bitcoin is in sustained bearish regime with key support levels at $82K-$84K and recovery target zone of $96K-$99K. While Futures Flow Index is below 45 and Bull-Bear Structure is in negative territory, upward momentum is unlikely. But the market is attempting to recover after strong bear pressure and both indices show these signs.