
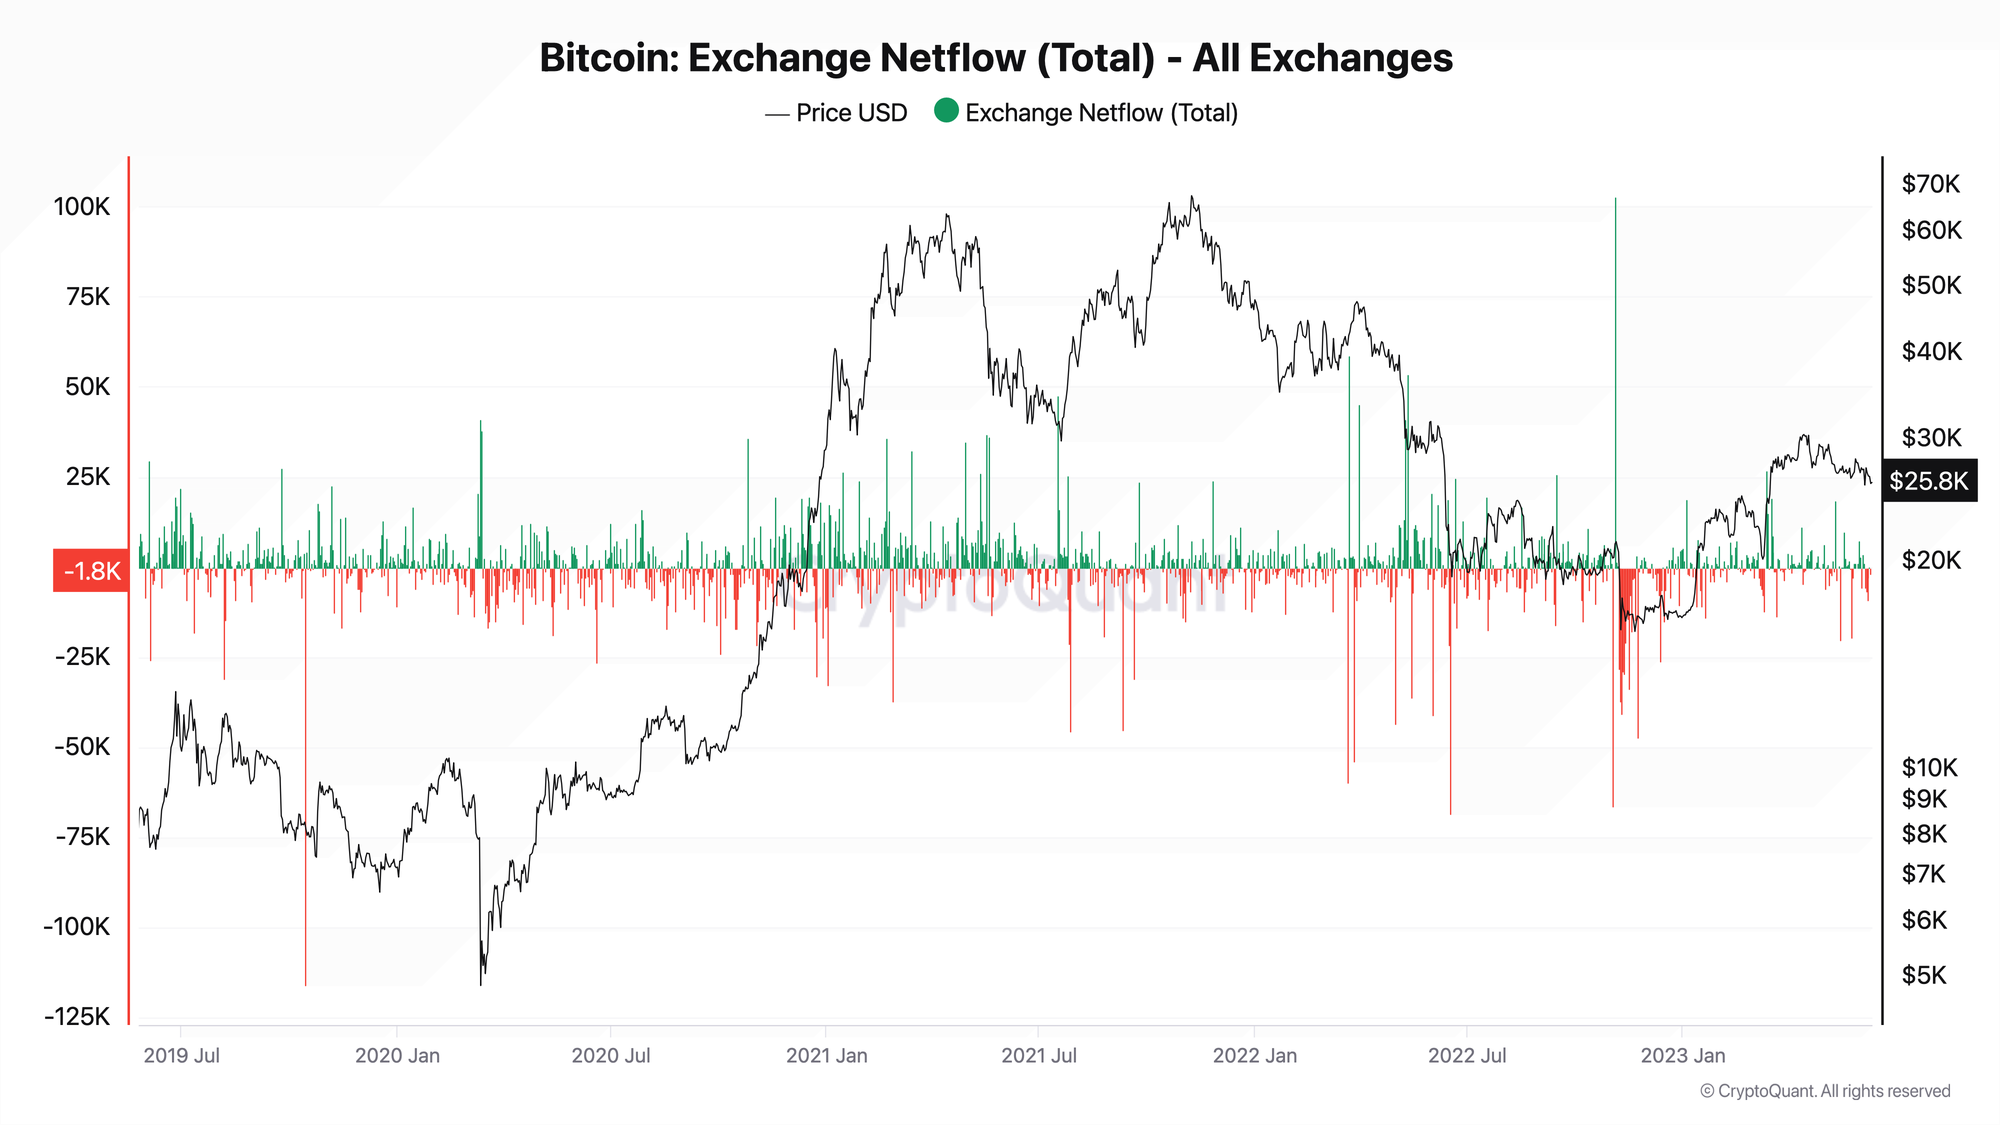
Exchange Netflow is the net difference between Bitcoin flowing into exchanges (inflows) and Bitcoin flowing out (outflows) over a given period. Formula: Exchange Netflow = Inflow − Outflow. A positive value signals selling pressure; a negative value signals accumulation.
Last updated: March 29, 2026
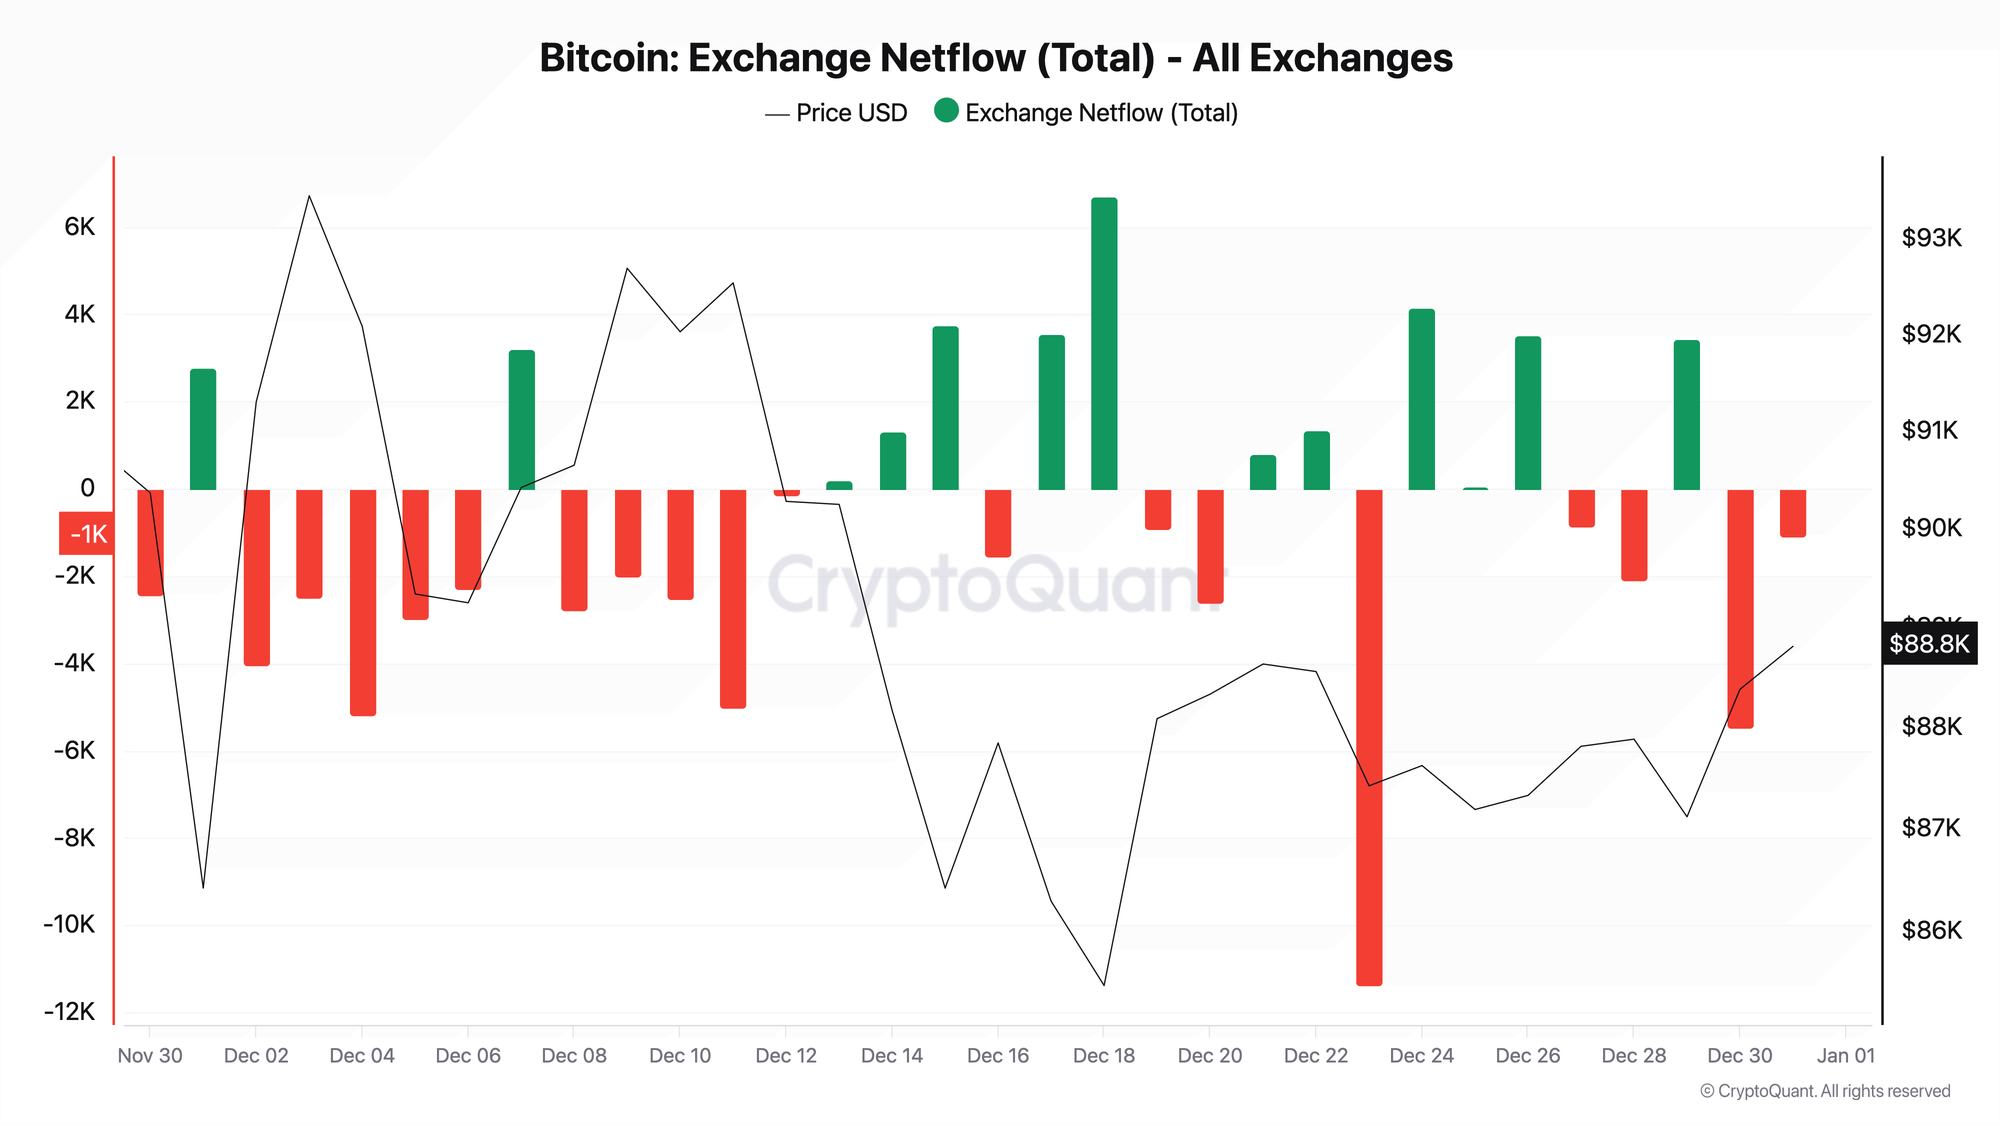
Current Exchange Netflow
| 24h Netflow | +1,319 BTC |
| 7-Day Cumulative | -10,570 BTC |
| 30-Day Cumulative | -82,772 BTC |
| Signal | 🟢 Strong outflow — coins leaving exchanges, accumulation signal |
Updated March 29, 2026 · Want daily netflow signals? Join Adler AM
What is Exchange Netflow?
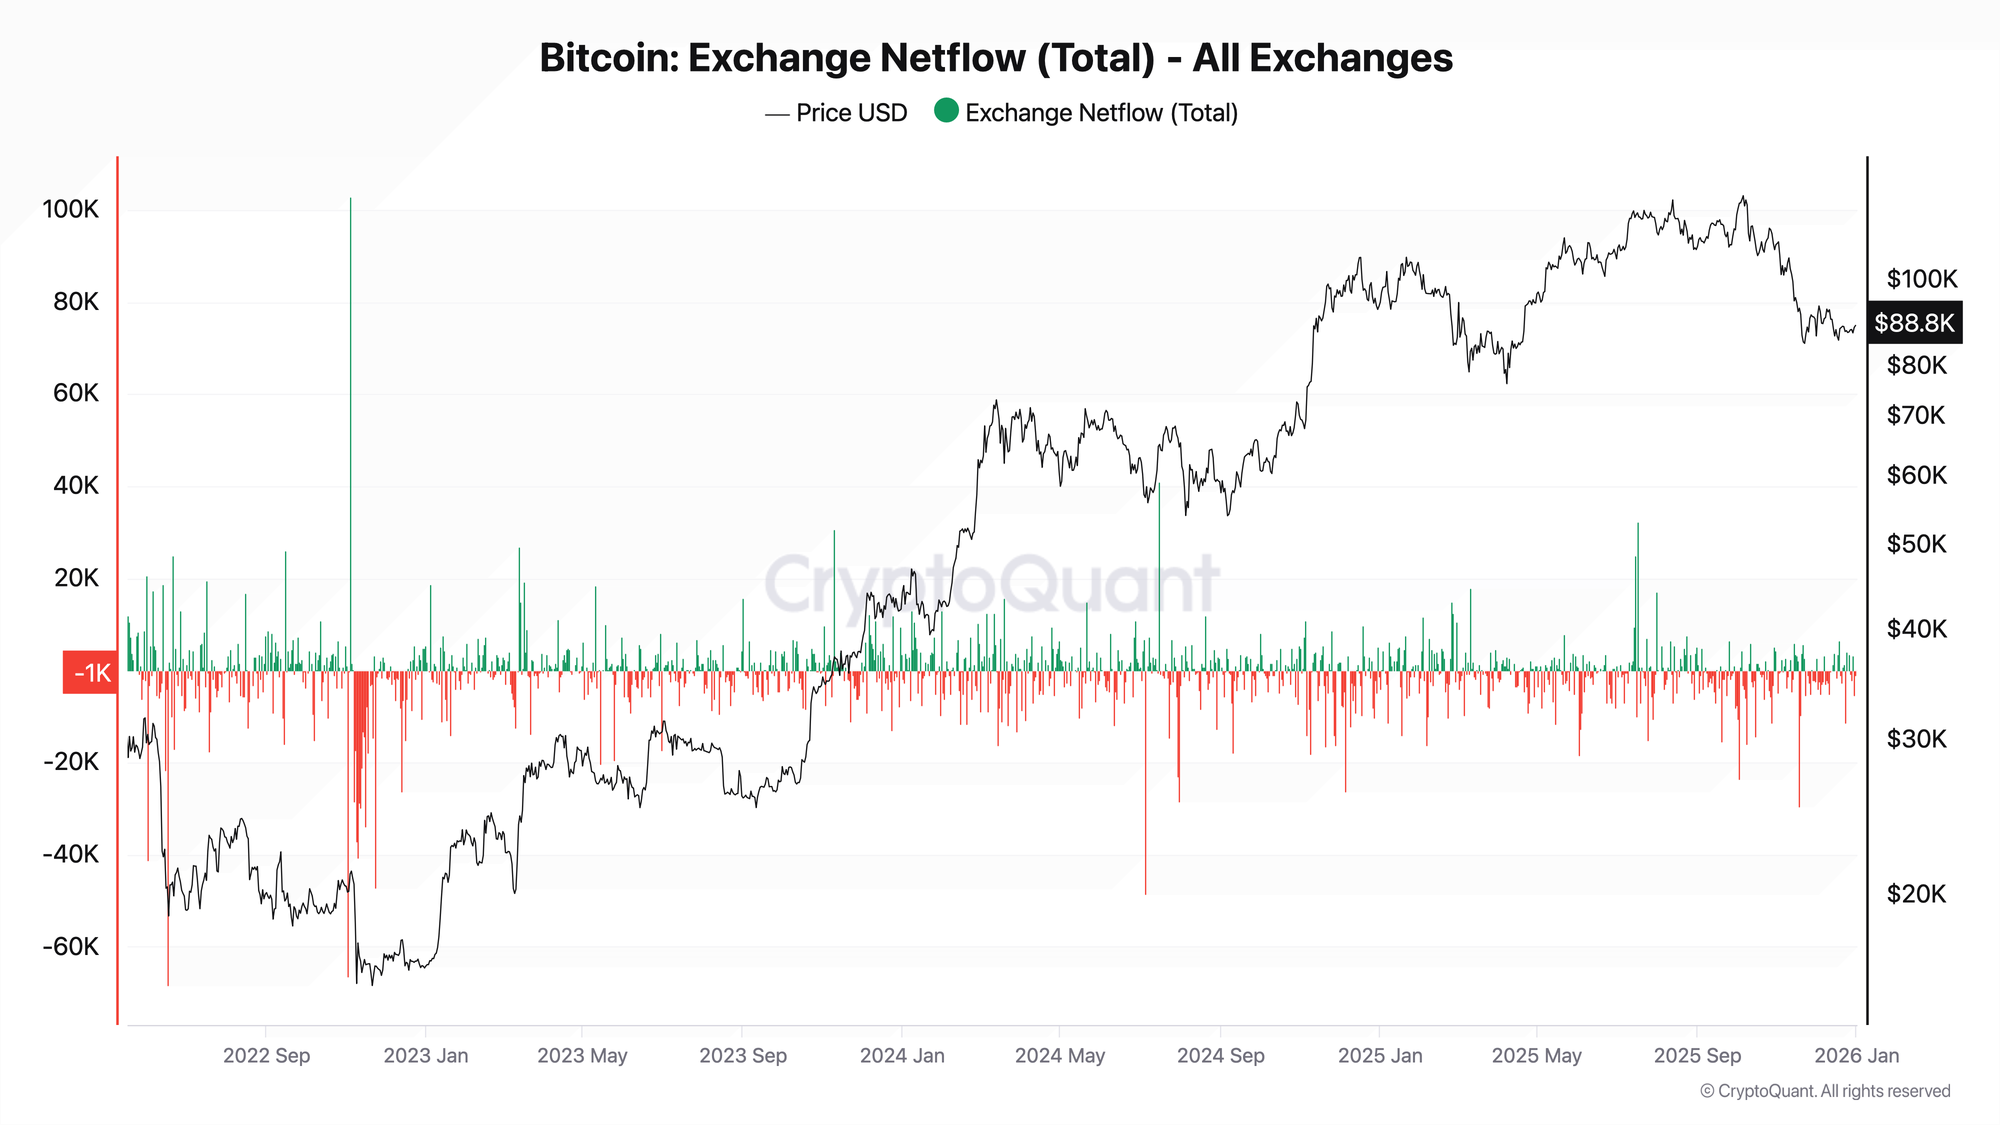
Exchange Netflow shows the difference between the amount of Bitcoin flowing into exchanges and the amount of Bitcoin flowing out of exchanges over a given period.
Formula:
Exchange Netflow = Exchange Inflow - Exchange Outflow
Where:
- Exchange Inflow - volume of BTC deposited to exchange addresses
- Exchange Outflow - volume of BTC withdrawn from exchange addresses
Data Sources:
- CryptoQuant — most comprehensive exchange data
- Glassnode — alternative provider
- Coinglass — free basic charts
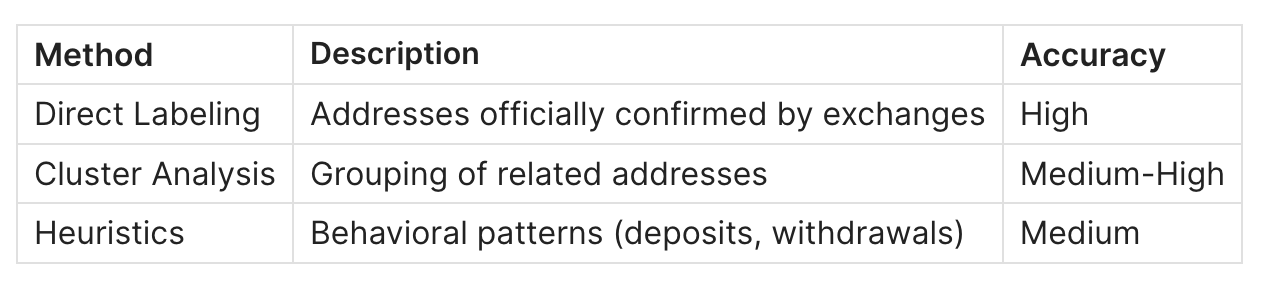
How Exchange Netflow Is Calculated
Step 1: Identifying Exchange Addresses
Analytics platforms maintain databases of addresses belonging to centralized exchanges. Identification methods:
Step 2: Tracking Flows
For each transaction on the Bitcoin network:
- Determine whether the sender or recipient address belongs to an exchange.
- Classify as Inflow (to exchange) or Outflow (from exchange).
- Sum the volume in BTC.
Step 3: Calculating Net Flow
All flows are aggregated over a period (hour, day, week):
Process Visualization:
[User A] ──── 5 BTC ────→ [Binance]      = +5 Inflow
[User B] ──── 3 BTC ────→ [Coinbase]     = +3 Inflow
[Coinbase] ──── 10 BTC ────→ [Cold Wallet] = -10 Outflow
                                            ───────────
                                Netflow = 8 - 10 = -2 BTC
                                (Net Outflow)
How to Interpret Exchange Netflow Values
Positive Netflow (Inflow > Outflow) — Inflows to Exchanges
What it means:
- More BTC is flowing into exchanges than out
- Holders are preparing to sell
- Potential selling pressure is increasing
Market Context:
- Short-term: possible downward pressure on price
- At cycle tops: sign of distribution
- Extreme values: potential sell signal
Negative Netflow (Outflow > Inflow) — Outflows from Exchanges
What it means:
- More BTC is being withdrawn from exchanges than deposited
- Holders are moving coins to cold storage
- Available supply for sale is decreasing
Market Context:
- Short-term: reduced selling pressure
- At cycle bottoms: sign of accumulation
- Sustained outflows: medium-term bullish signal
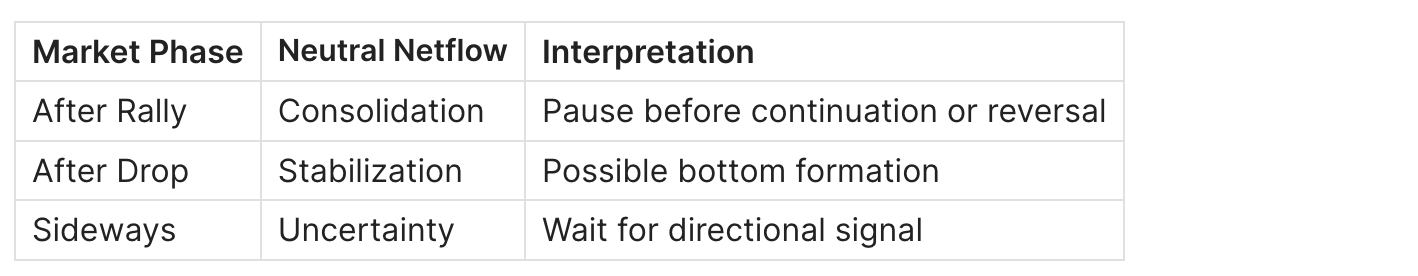
Neutral Netflow (Near Zero)
What it means:
- Balance between inflows and outflows
- Market is in equilibrium
- No clear directional pressure
Market Context:
Exchange Netflow Trading Signals
Historical Example 1: 2020 Accumulation
Situation: March-October 2020, BTC from $5,000 to $13,000
Exchange Netflow Behavior:
- Sustained outflows after the March crash
- Exchange reserves decreased by ~225,000 BTC over 8 months
- Institutions (Grayscale, MicroStrategy) were accumulating positions
Conclusion: Prolonged outflows from exchanges preceded the 2021 bull rally.
Historical Example 2: Distribution at the 2021 Top
Situation: March-April 2021, BTC $58,000-64,000
Exchange Netflow Behavior:
- Sharp increase in exchange inflows
- Several days with Netflow +30,000-35,000 BTC
- Long-term holders began taking profits
Conclusion: Extreme inflows to exchanges coincided with the local top before the correction to $30,000.
Historical Example 3: FTX Capitulation 2022
Situation: November 2022, FTX collapse
Exchange Netflow Behavior:
- Massive outflows from exchanges due to fear
- Record withdrawal volumes
- Paradox: outflows were forced (distrust of exchanges), not accumulation
Conclusion: Context matters — not all outflows are bullish. You need to consider the reasons.
Practical Application
Buy Signal:
- Sustained outflows from exchanges (>7 days)
- Declining exchange reserves
- Confirmation: STH SOPR near 1.0, positive funding after negative
Caution/Sell Signal:
- Sharp inflows to exchanges (>15,000 BTC/day)
- Especially from large wallets (whale alert)
- Confirmation: high STH SOPR (>1.05), overheated funding rate
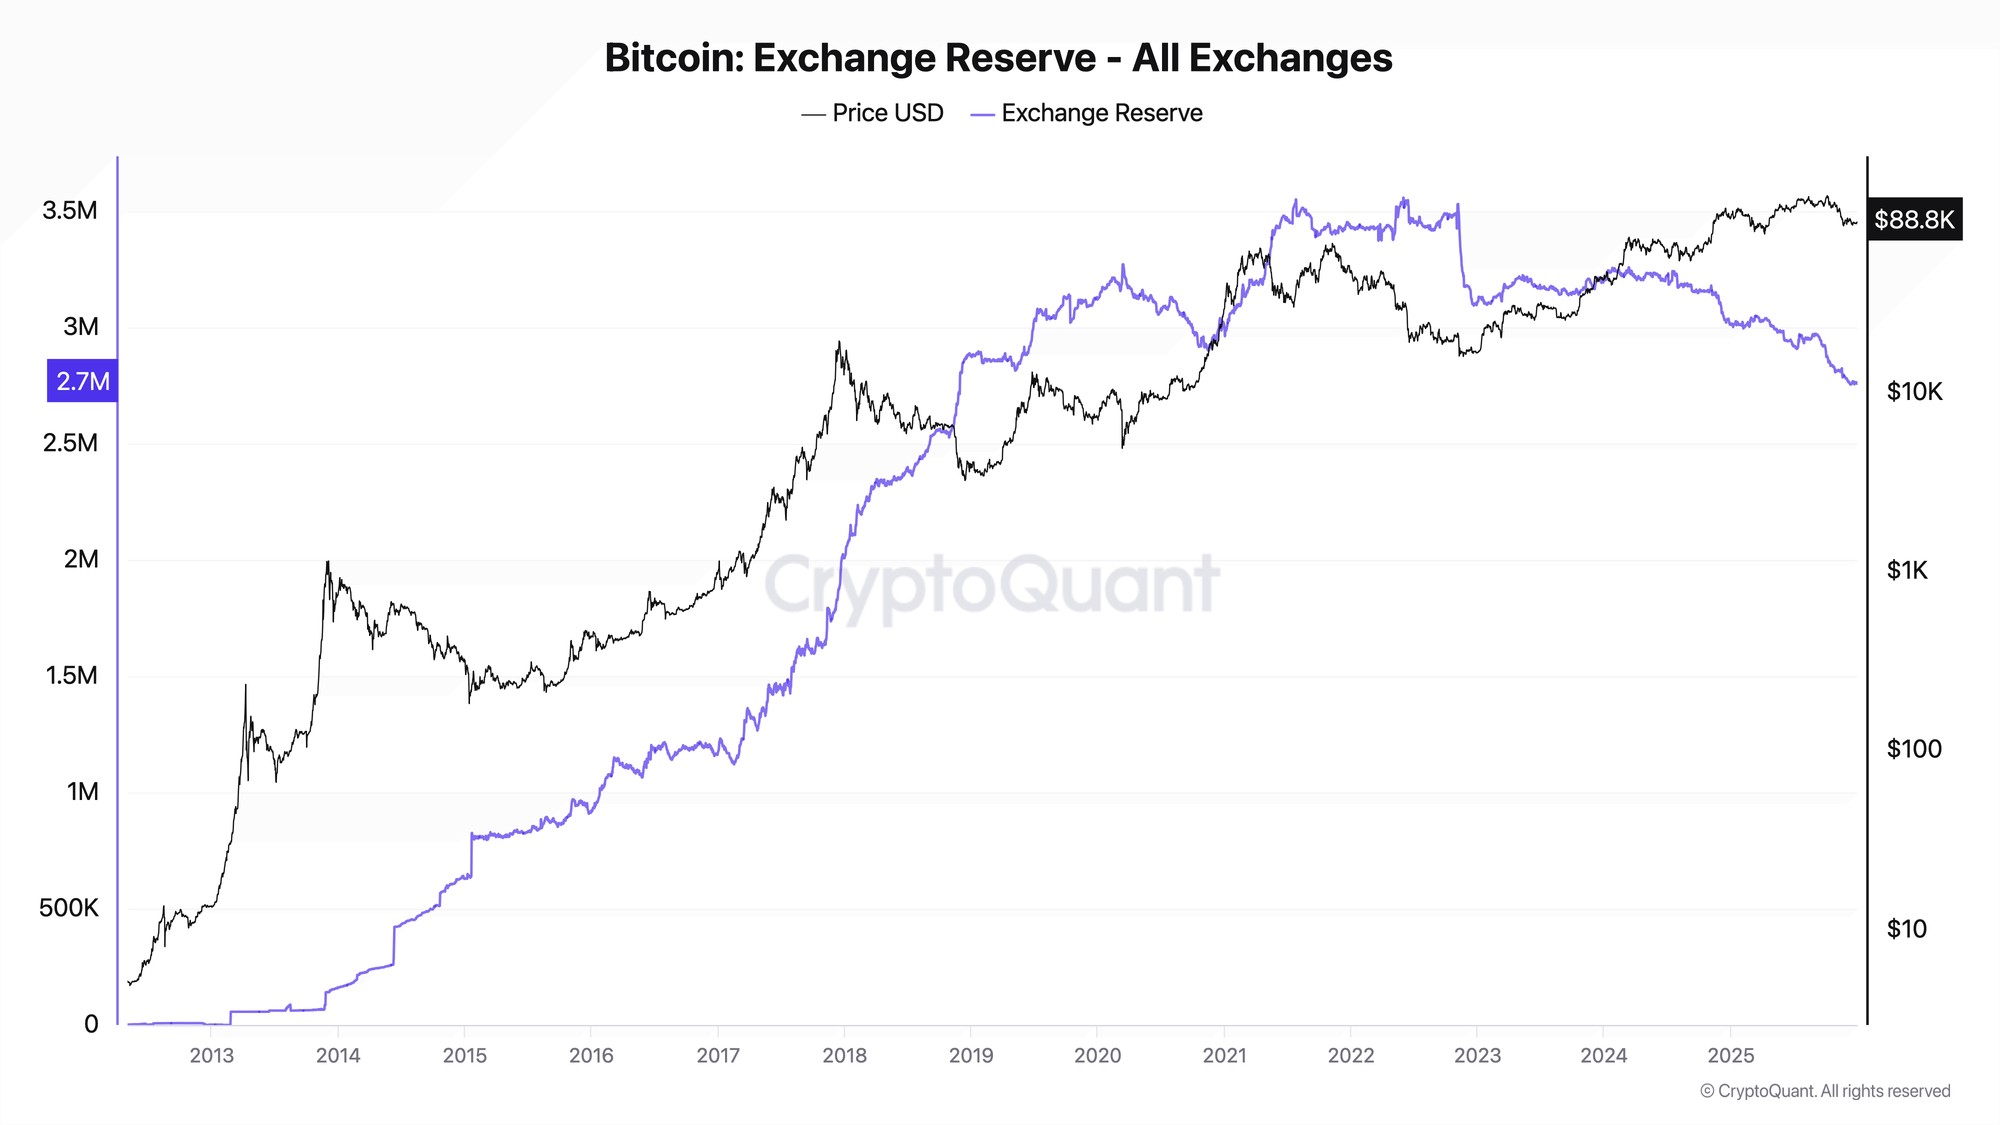
Exchange Netflow vs Exchange Reserve vs Exchange Balance
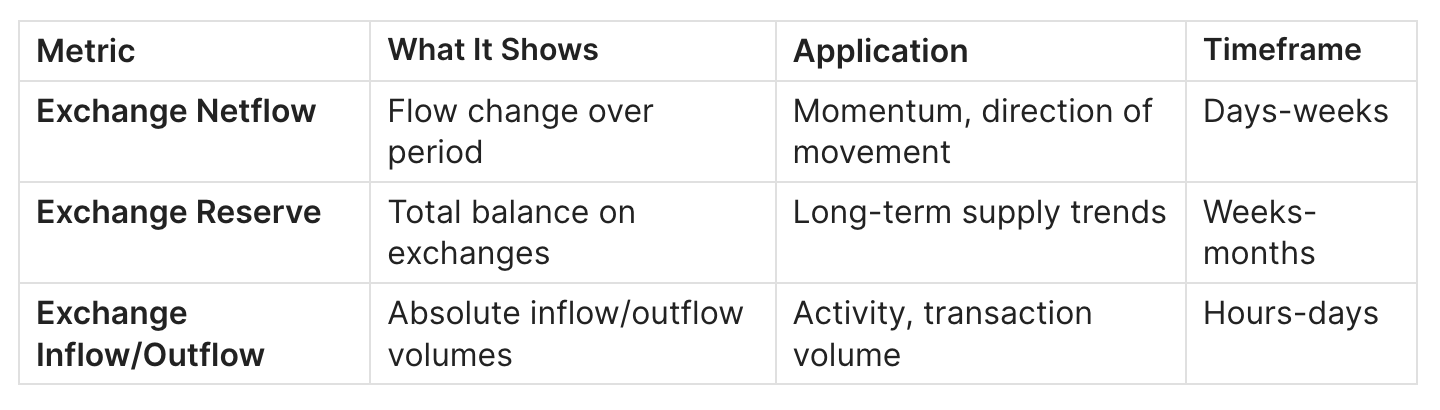
When to Use Which
Exchange Netflow is best for:
- Determining short-term direction of pressure
- Identifying reversal points
- Tactical decisions (days-weeks)
Exchange Reserve is best for:
- Assessing long-term accumulation/distribution trends
- Understanding structural market changes
- Strategic positioning (months)
Separate Inflow/Outflow Analysis is best for:
- Understanding market activity
- Assessing liquidity
- Identifying anomalies
Combined Analysis
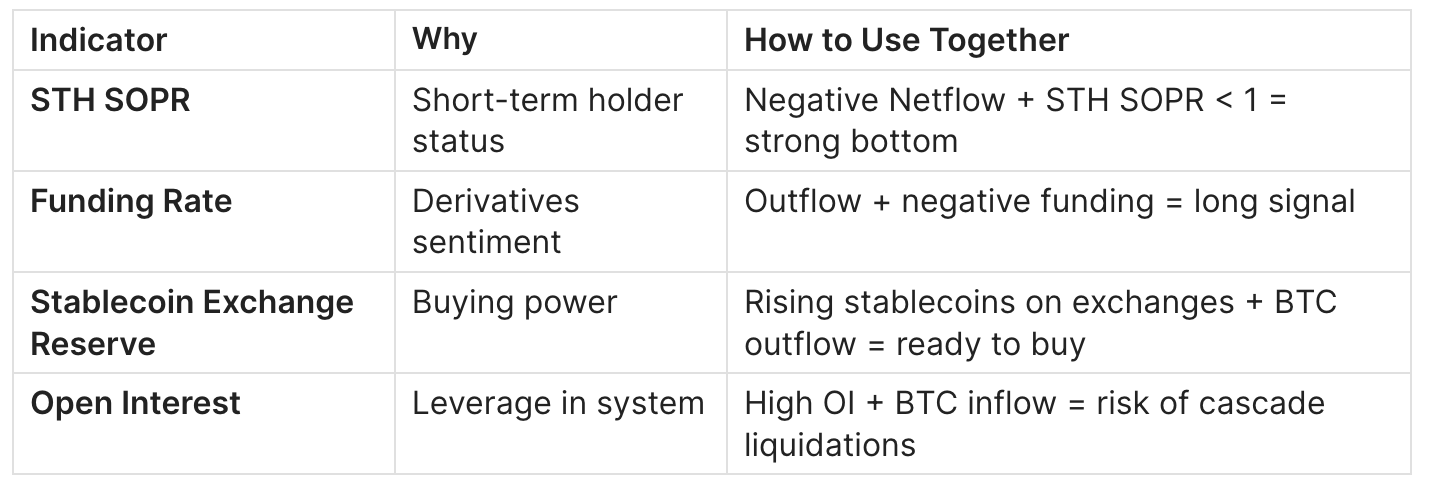
The strongest signals occur when multiple indicators align:
Negative Netflow + Falling Reserve + STH SOPR < 1
= Accumulation amid weak hands capitulation
→ Strong buy signal

Positive Netflow + Rising Reserve + STH SOPR > 1.05
= Distribution, profit-taking
→ Caution signal
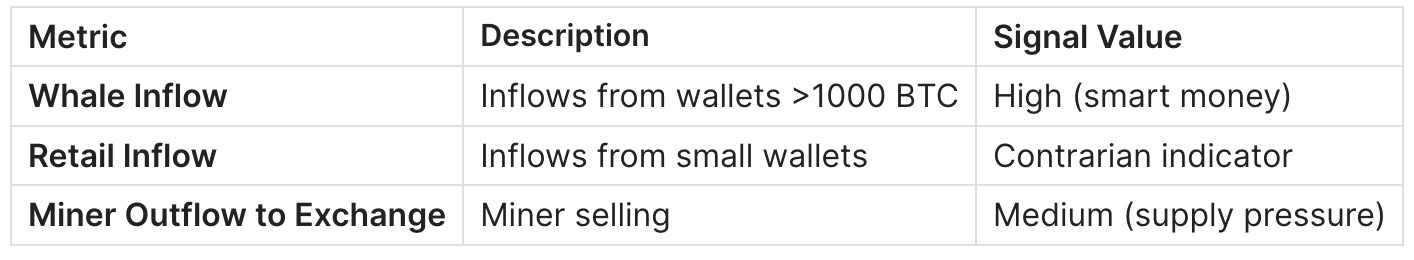
Advanced Exchange Flow Metrics
By Participant Type
By Exchange
Different exchanges have different user profiles:
- Coinbase: Institutions, US investors
- Binance: Retail, Asian market, derivatives
- Kraken: Europe, large players
Usage Example: Inflows to Coinbase with outflows from Binance may indicate institutional buying, not retail selling.
Coinbase Premium + Exchange Flow
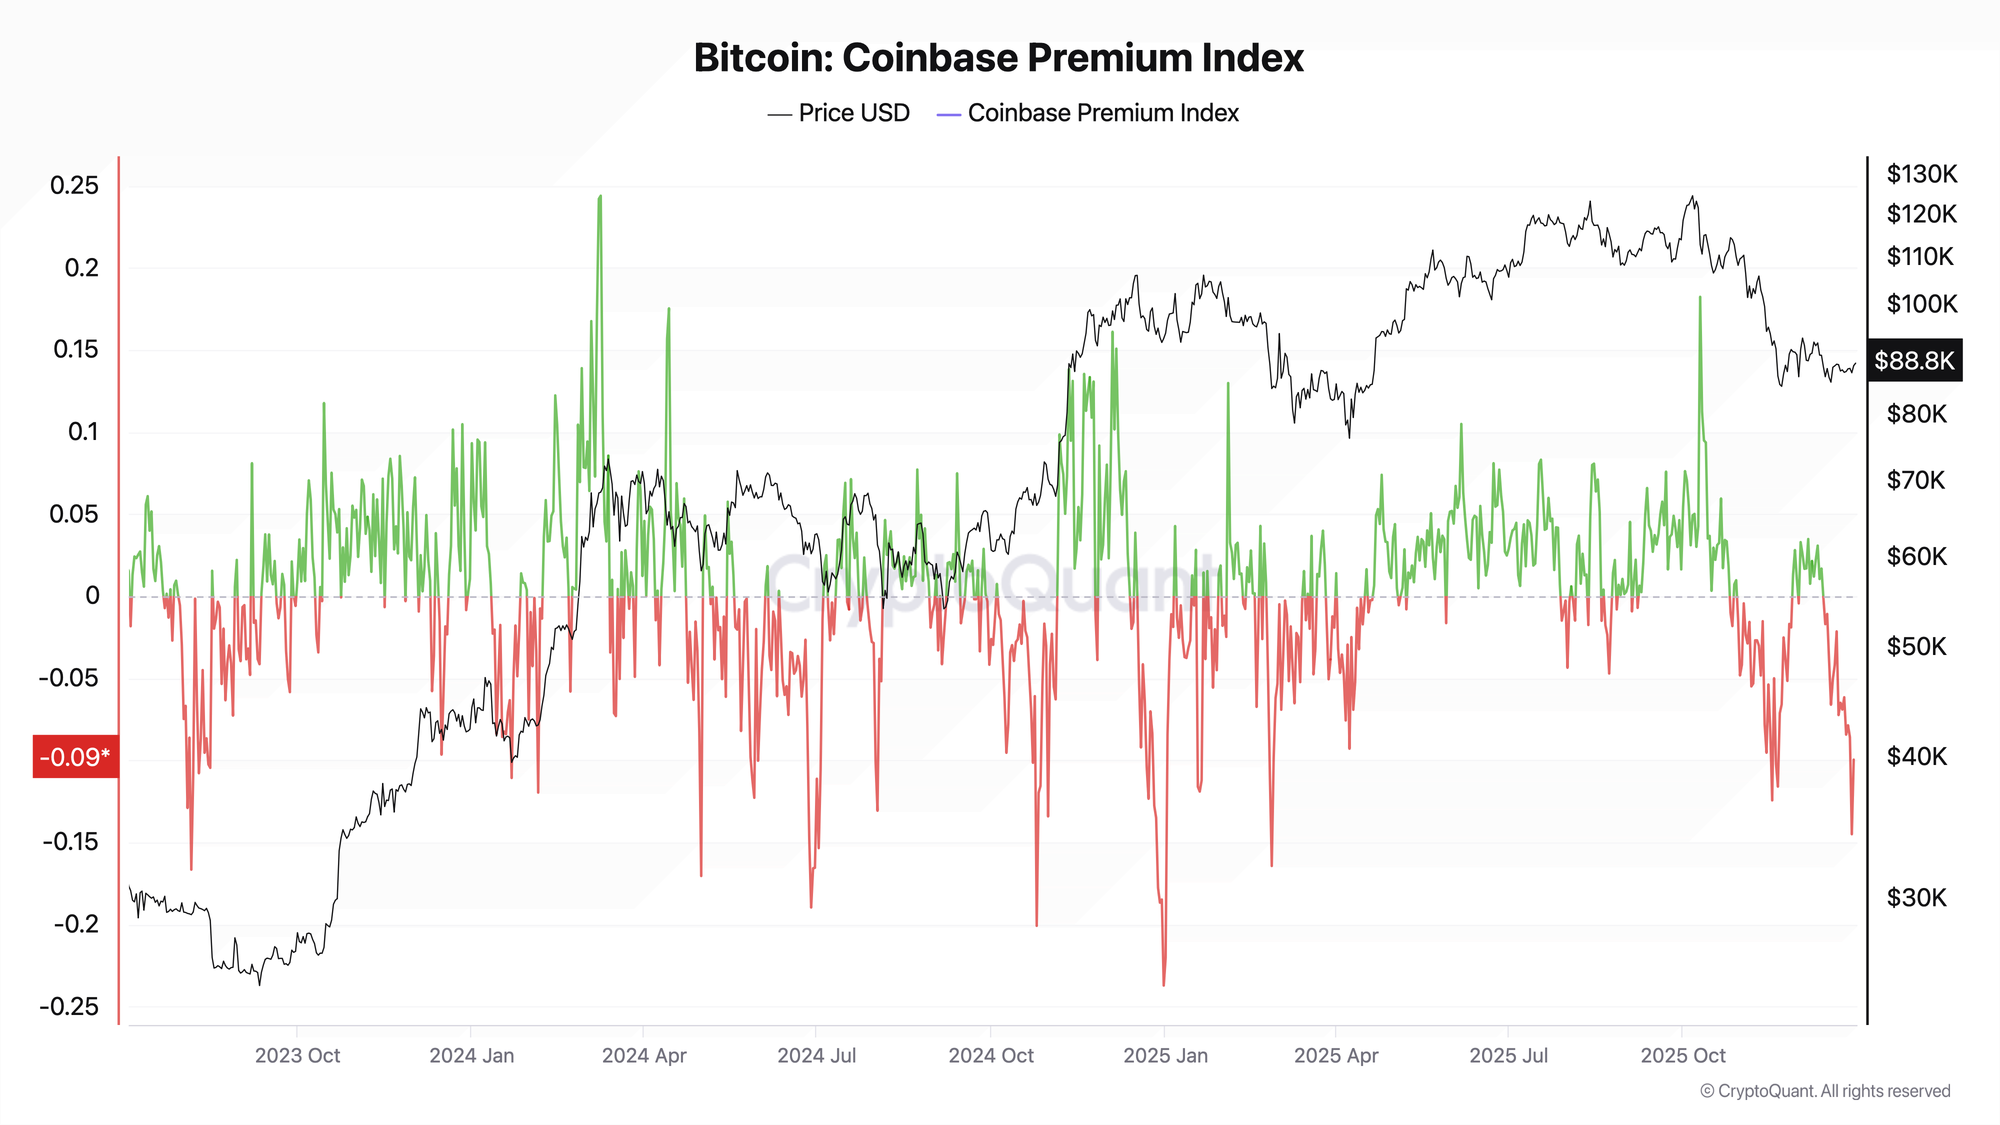
Coinbase Premium > 0 + Outflow from Coinbase = Institutions buying OTC/accumulating
Coinbase Premium < 0 + Inflow to Coinbase = Institutions selling
Limitations of Exchange Netflow
When the Indicator Doesn't Work
1. Internal Exchange Transfers
- Movements between hot and cold wallets within exchanges
- Can create false inflow/outflow signals
- Solution: use filtered data (CryptoQuant "adjusted")
2. New/Unidentified Addresses
- Not all exchange addresses are labeled
- New exchanges may not be included
- Solution: use multiple data sources
3. Changing Participant Behavior
- Growth of DeFi and DEX reduces CEX metrics significance
- Institutions use OTC, bypassing exchanges
- Solution: supplement with Stablecoin flows, ETF flows analysis
4. FTX-Type Events
- Force majeure outflows due to fear
- Not related to bullish accumulation
- Solution: consider news background
Which Indicators to Combine With
FAQ
What Exchange Netflow Value Is Considered Significant?
Depends on context and timeframe:
- Daily Netflow: >10,000 BTC — significant signal
- Weekly Netflow: >30,000 BTC — strong signal
- Trend matters more: 5-7 days in one direction is more important than a single day
Where to Find Exchange Netflow Data?
Free:
- CryptoQuant — basic charts (requires registration)
- Coinglass — Exchange Balance
Paid (extended data):
- CryptoQuant Pro — from $29/month (exchange breakdown)
- Glassnode Studio — from $39/month
Is Exchange Netflow Currently Bullish or Bearish?
Current analysis of Exchange Netflow and other on-chain metrics is published in ADLER AM — daily morning briefs on the Bitcoin market. Detailed Bitcoin market analysis is published on Substack, subscribe via AdlerInsight
How to Distinguish "Healthy" Outflow from Panic Outflow?
Healthy Outflow (Accumulation):
- Gradual, steady
- Against a backdrop of stable or rising prices
- No negative news
Panic Outflow (Distrust):
- Sharp, impulsive
- After negative events (hacks, bankruptcies)
- Accompanied by price decline
Conclusion
Exchange Netflow is a powerful tool for understanding the supply and demand balance in the Bitcoin market. Key principles:
- Outflow = reduced supply. Sustained outflows from exchanges historically precede price increases
- Inflow = selling pressure. Sharp inflows often coincide with local tops
- Context determines interpretation. The reason for the flow matters more than the flow itself
- Combine with other metrics. Netflow + SOPR + Funding provide more reliable signals
- Watch whale flows. Large transfers have greater predictive value