
The current correction of approximately -32% remains the mildest among Bitcoin's bear cycles: with approximately 88% of coins still in unrealized profit, and only about 12% of supply at a loss.
TL;DR
Bitcoin has frozen in the $90K zone with a relatively mild drawdown by historical standards. The key question for year-end is whether the maximum correction depth will remain in the range up to -35-40% from ATH (a new, more "flat" cycle paradigm) or whether the market will repeat the historical pattern with a deepening to -60-70%.
Bitcoin Bear Market Correction Drawdowns
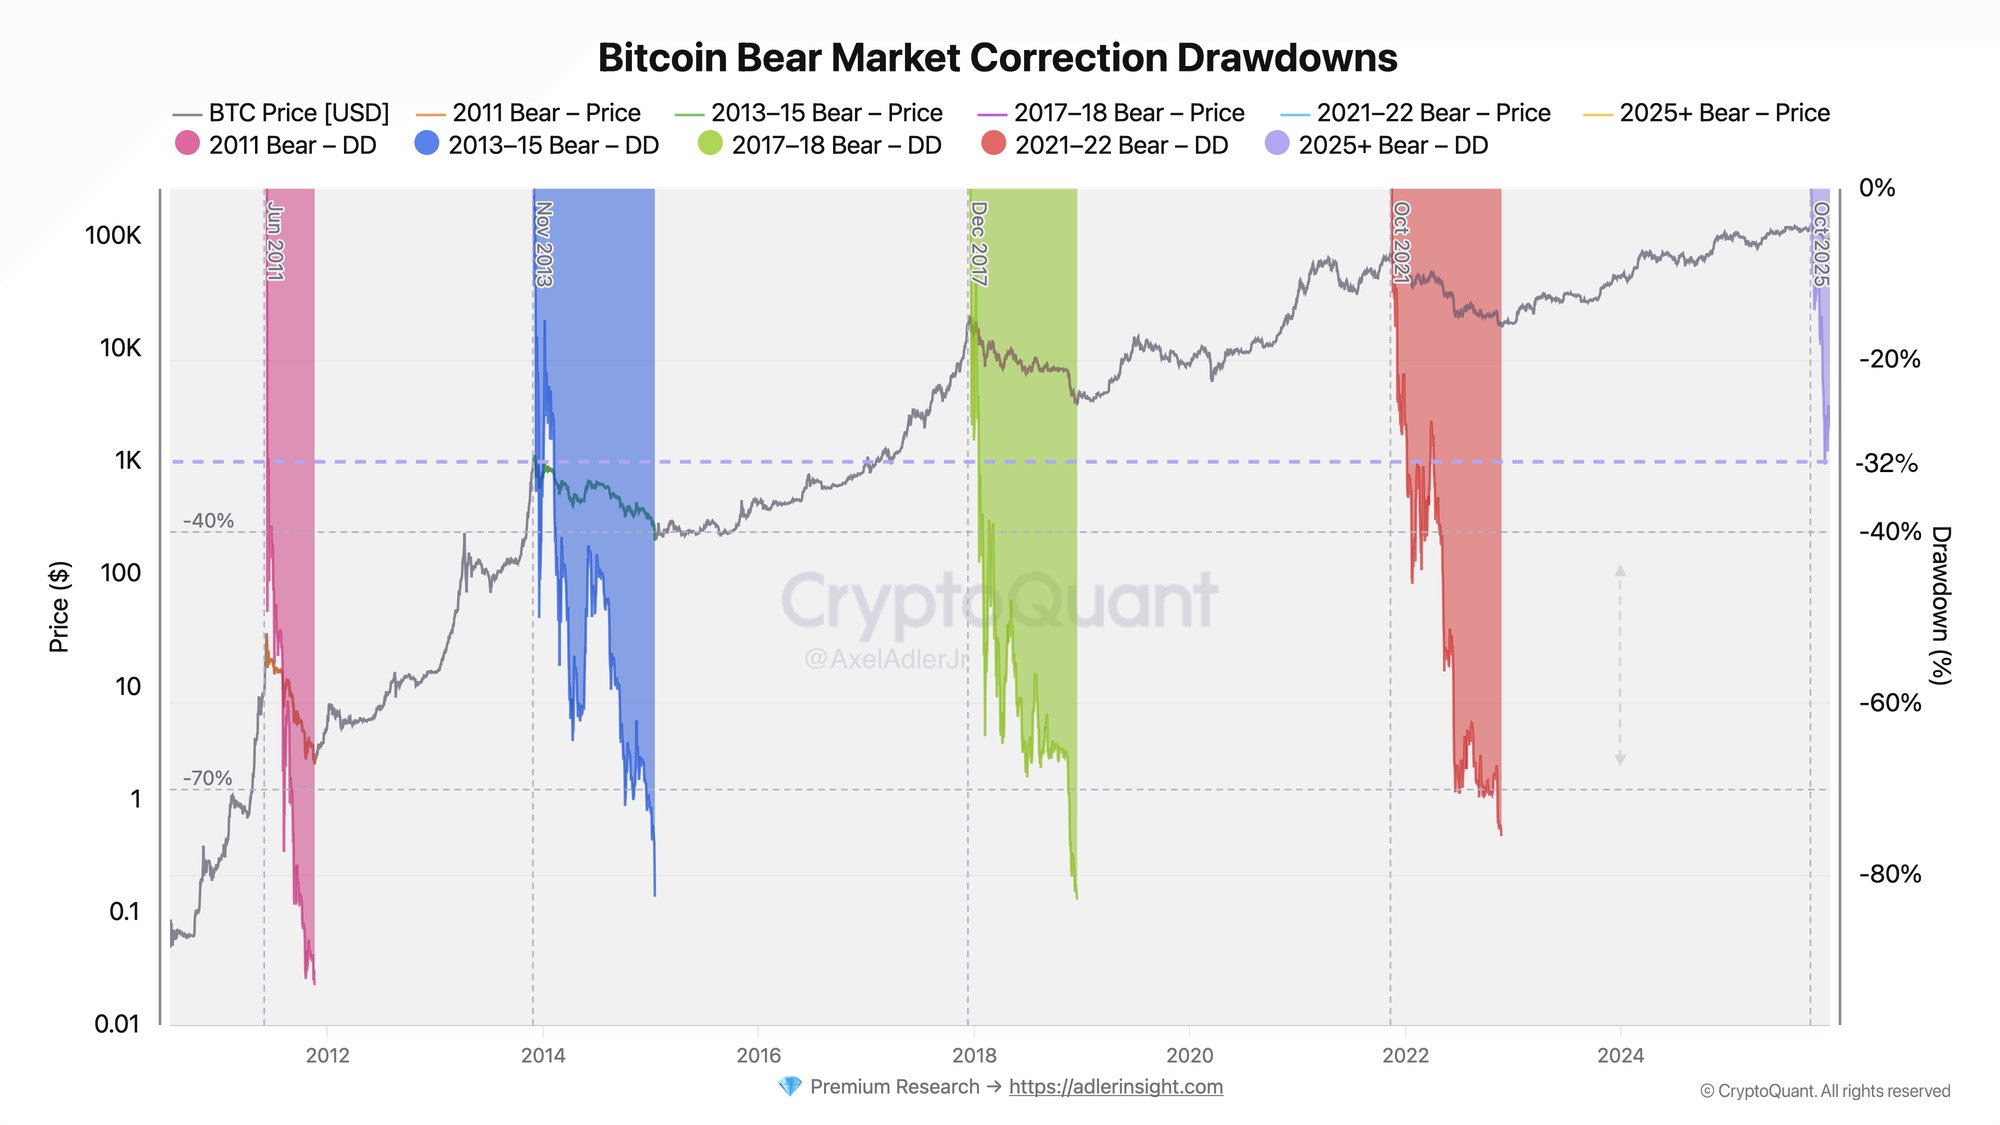
The current 2025+ cycle correction shows an achieved drawdown of -32% from ATH - today this is noticeably milder than the final cycles of past bear markets, which deepened into the -60-80% range. In all major cycles since 2011, breaking through the -40% zone became the starting point for a deeper decline phase, already closer to classic bear extremes.
Now the market seems stuck in the middle: technically we are already in a bearish correction mode, but in terms of depth and character of the drawdown, this is still more of a "softened" variant compared to historical analogues.
Bitcoin Percent Unrealised Loss
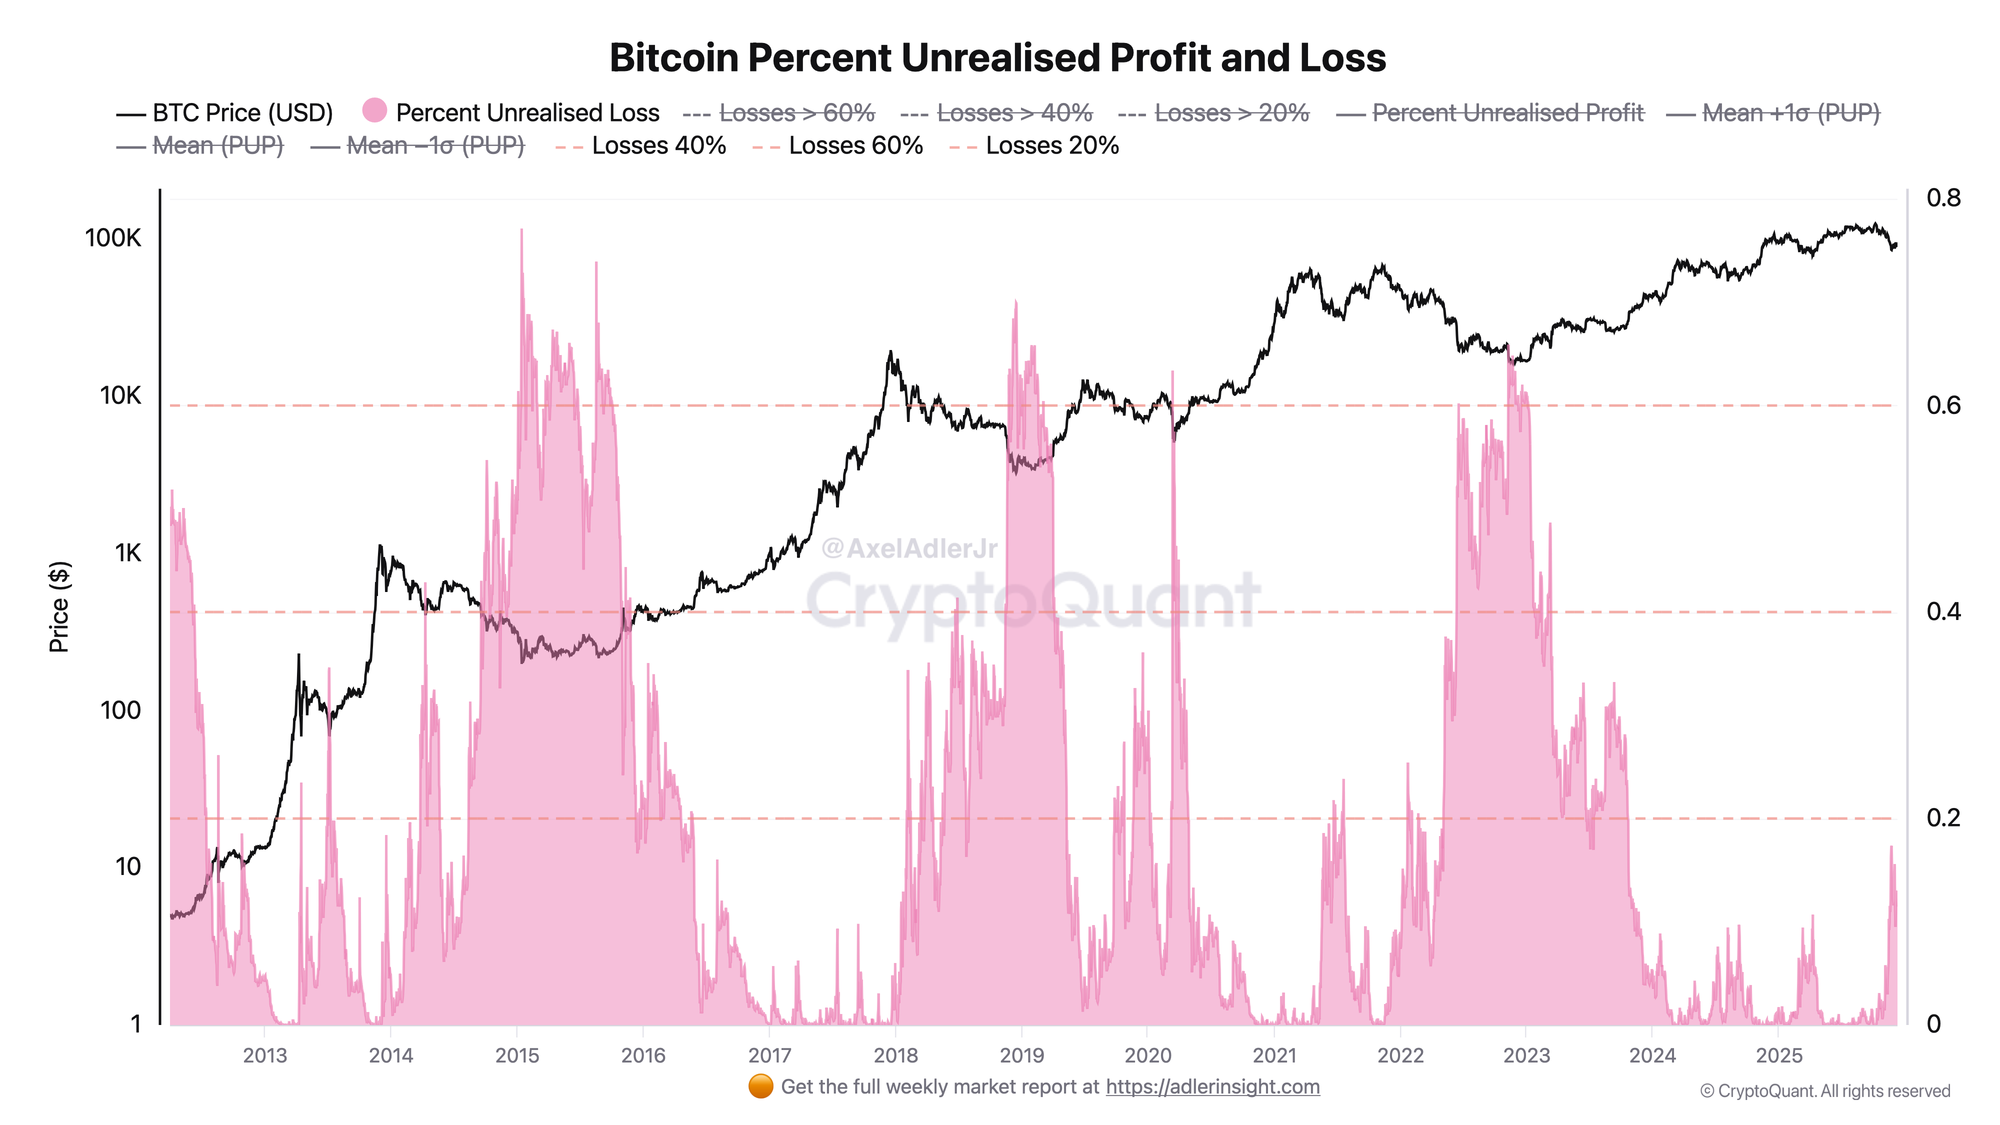
The current Percent Unrealised Loss of 12% means that only a small portion of holders are in sustained loss, while the overwhelming majority of positions remain in the profit zone. This is an atypical picture for a serious bear correction: even the recent local cycle maximum of around 17% of coins at a loss remains approximately 3-4 times lower than historical capitulation levels.
In the 2016, 2019, 2023 cycles, the share of coins at a loss rose to the ~60% zone, forming classic capitulation peaks when most of the market found itself "underwater." Now we are far from such extremes and the structure of unrealized PnL so far more closely resembles a correction within a bullish supercycle rather than the final phase of a full-fledged bear market.

FAQ
What does the current picture on the Bear Market Drawdowns chart mean?
At the current moment, the maximum correction depth of the 2025 cycle is approximately -32% from ATH - this is significantly milder than the final lows of past bear markets, which reached -60-80%. Historically, breaking through the -40% zone served as a threshold after which the market more often transitioned into a phase of deeper, "classic" bear correction.
How to interpret the Bitcoin Percent Unrealised Loss signals?
Approximately 88% of coins remain in unrealized profit with a relatively mild price drawdown. This combination creates an elevated risk that with any significant negative trigger, some profitable participants will begin taking profits. In past bear cycles, local bottoms formed at levels of around 60% of supply at a loss, meaning the current share of coins in the red is significantly below historical capitulation zones.
CONCLUSIONS
The market is testing the stability of the correction structure near -32% from ATH with a very high proportion of profitable positions - this is an atypical configuration for a classic bear market.
- Maintaining the maximum drawdown above the -35% zone combined with moderate levels of unrealized losses will strengthen arguments in favor of a new paradigm of more "flat" corrections under the influence of institutional demand and structural supply deficit.
- Breaking through the -40% zone in correction depth will significantly increase the probability of a classic bear market scenario, in which the path opens to a deeper decline phase in the -60-70% range and to the formation of a full-fledged capitulation phase in unrealized loss metrics.
In other words, the market is now balancing on the boundary between a mild institutional correction and a potential transition to a traditional bear regime, and the key triggers will remain the depth of the drawdown relative to ATH and the scale of growth in the share of coins in unrealized loss.