
Bitcoin is testing a critical oversold zone as the downtrend weakens.
TL;DR
RSI-14d in the oversold zone at 27% with ADX at 32% forms a technical configuration for a local bounce from current levels. The key reversal trigger is an RSI breakout above 30% with ADX stabilization in the 40% range.
#TechnicalAnalysis #RSI #ADX
Bitcoin Relative Strength Index
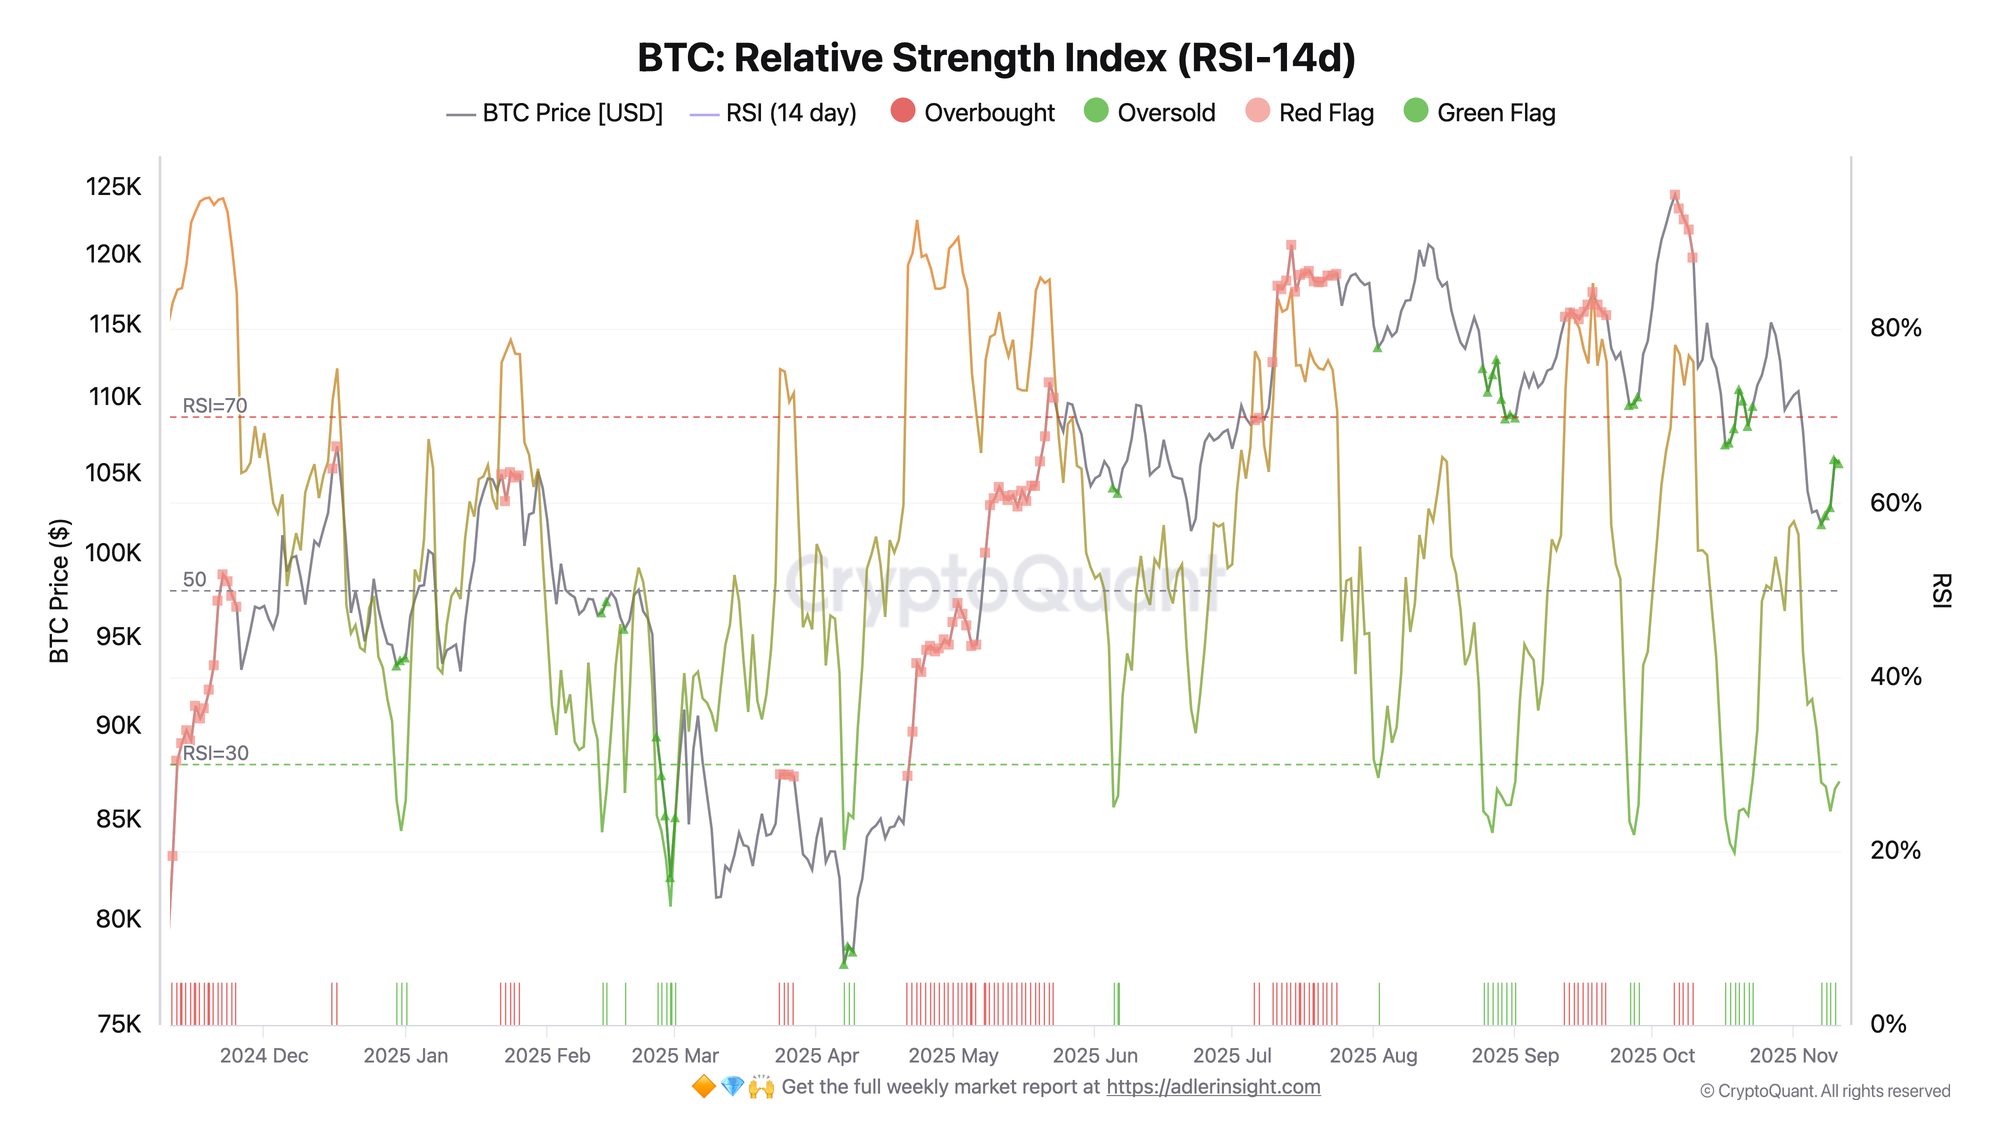
RSI is in the extreme oversold zone at 27%, which has historically preceded local reversals. The indicator has dropped below the RSI=30 level (oversold boundary), forming a green oversold flag. BTC price is trading in the $105K range; the current picture is identical to patterns in January, August, and September 2025, when subsequent rallies pushed the price up from local lows.
Bitcoin Power of Trend (ADX)
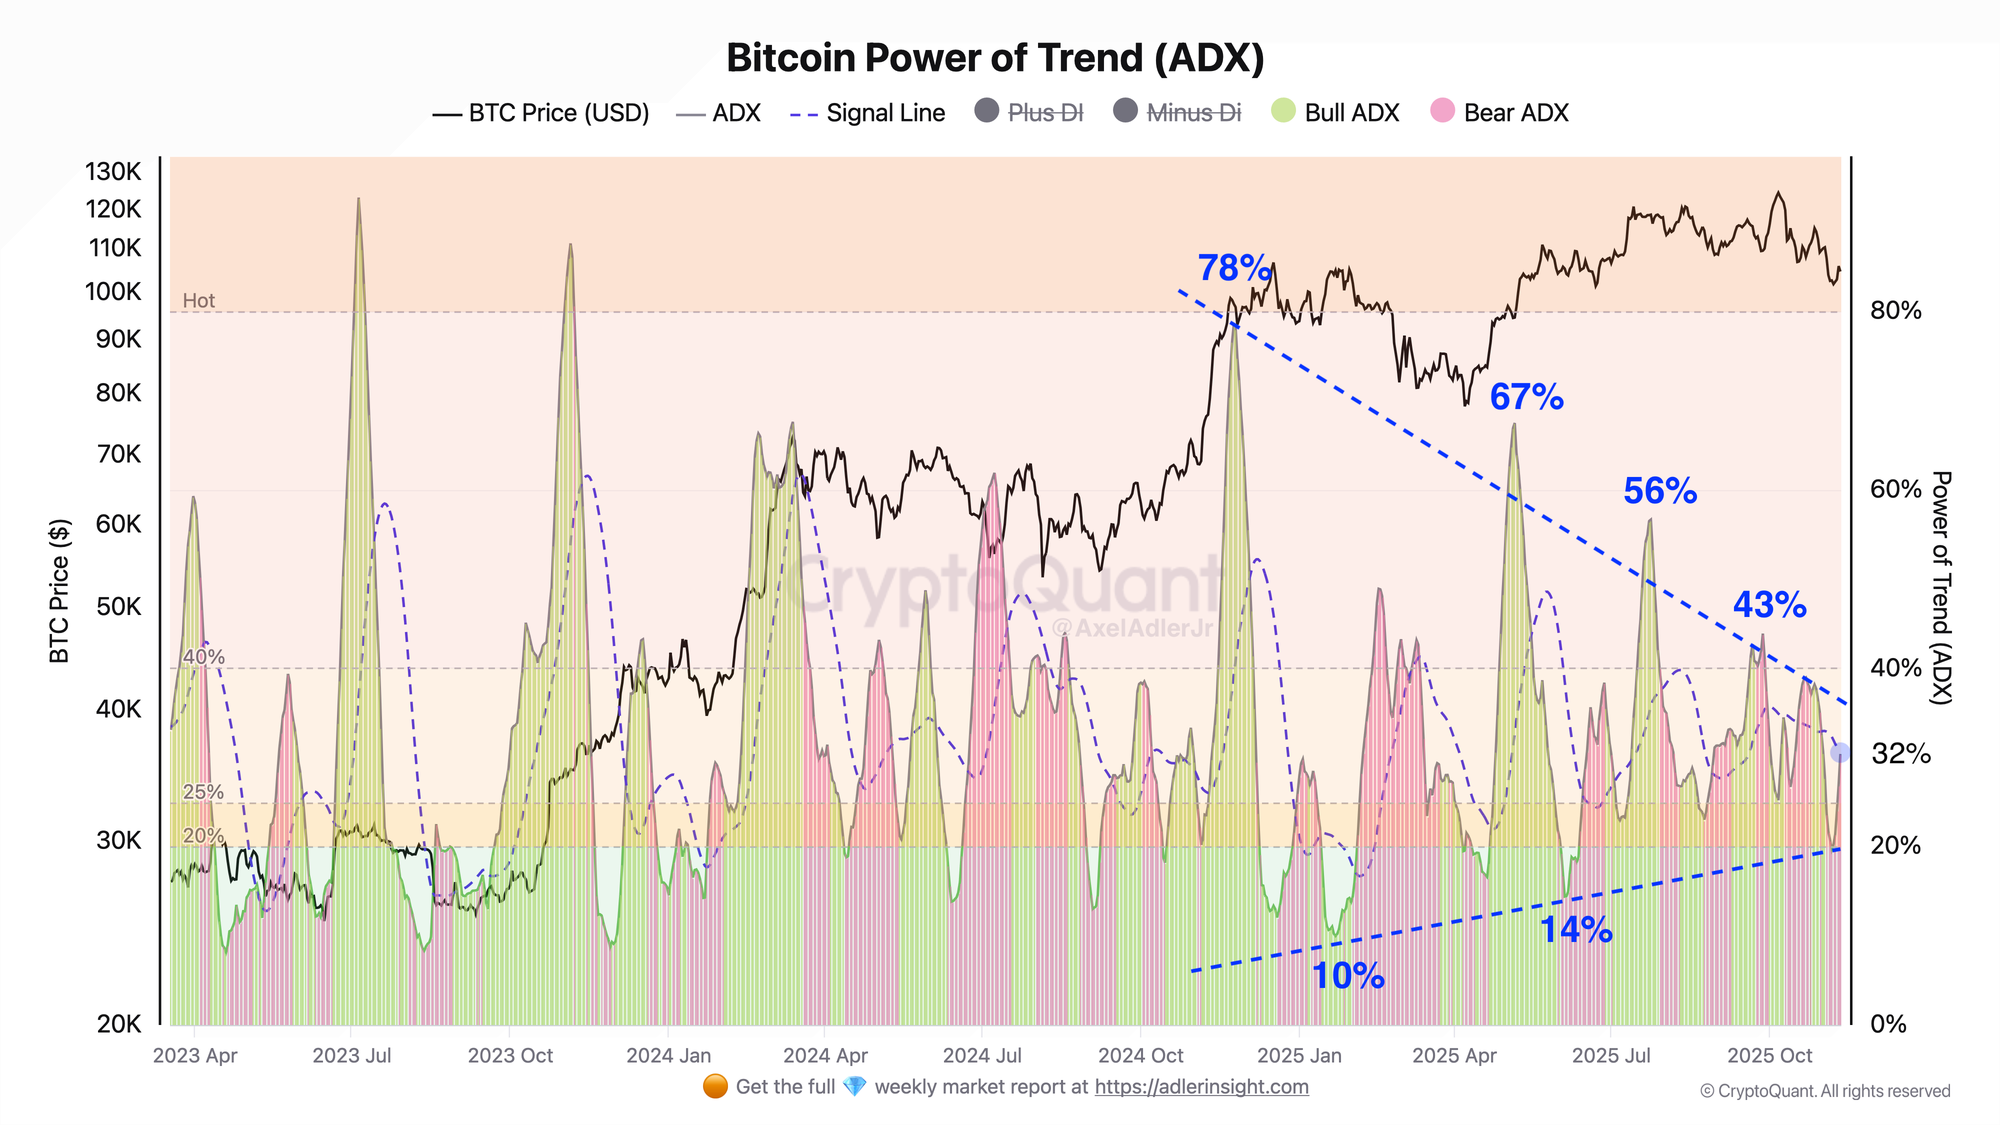
ADX has declined to 32% from a peak of 78% (January 2025), signaling trend weakening. The directional movement index shows a consistent decline from the year's beginning maximum values, when trend strength reached an extreme of 78%. The current value of 32% is in an intermediate zone—above the weak trend threshold (25%), but significantly below the strong directional movement zone >60%. Pink bars (Bear ADX) have contracted; green bars (Bull ADX) are not yet dominant.
RSI in extreme oversold territory with simultaneous weakening of trend strength ADX 32%. This configuration could become a setup for a local technical bounce.

FAQ
What does the current RSI picture indicate?
RSI in the 25% zone (oversold) has historically preceded local bounces. The key moment is a breakout of the metric above 30%.
How to interpret the ADX decline to 32% in the year's context?
The drop in ADX from 78% to 32% indicates overall exhaustion of the bullish momentum since January 2025.
CONCLUSIONS
The market may expect a local bounce upon confirmation of an RSI breakout above 30 and ADX stabilization. The target zone for short-term recovery is $110K.