
After the Federal Reserve's rate cut, the market is attempting to recover, but internal indicators show consolidation and a wait-and-see position among participants rather than confident expansion of impulse.
TL;DR
The market is digesting the macro event and remains in pause mode: momentum looks weakened, and derivative flows are neutral. The main logic of the day is to wait for synchronous confirmation in both indicators before concluding about trend continuation.
Bitcoin Adaptive Momentum Index
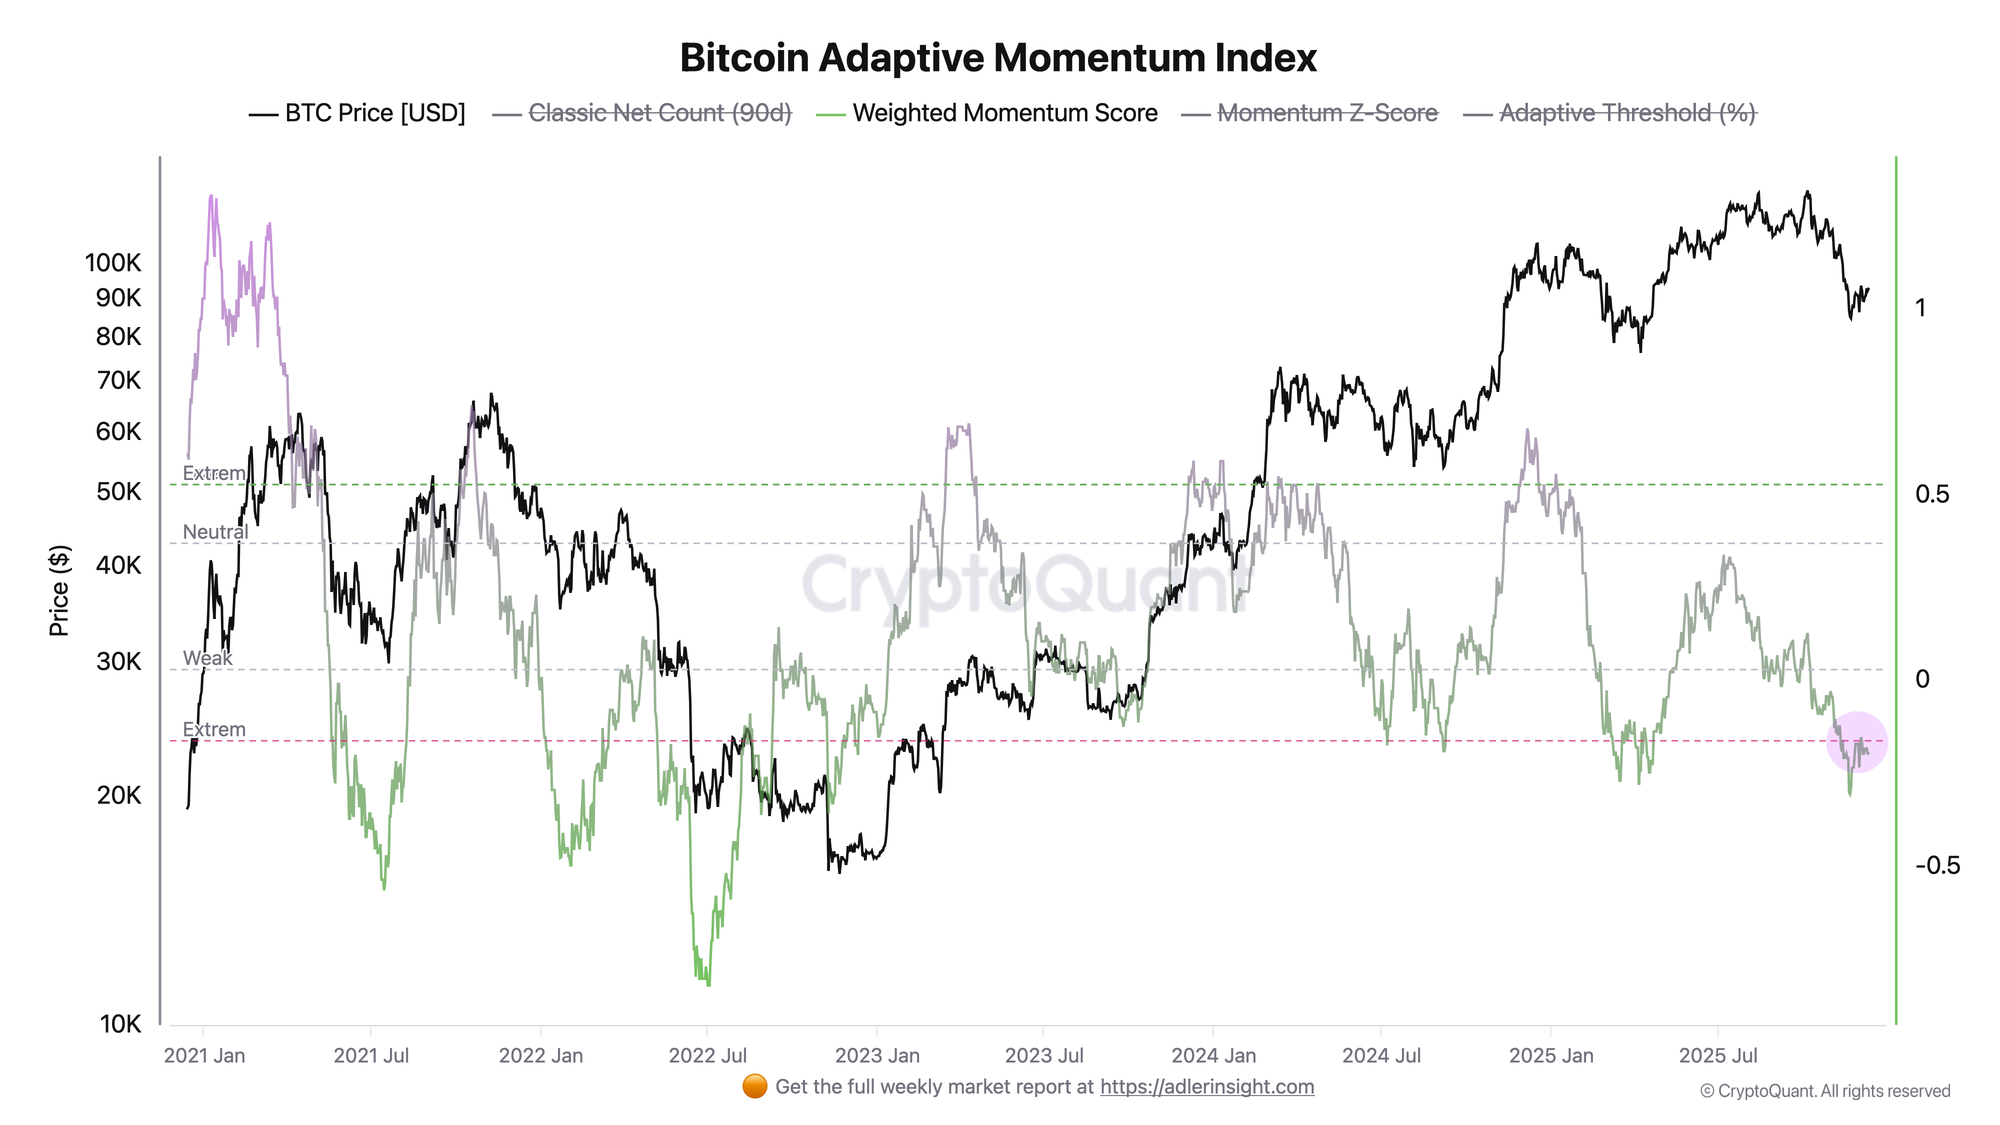
The index shows weighted momentum based on 90-day net count with adaptive regime thresholds. Currently, momentum is holding in the red zone nearby, which is typical for a pause after a strong downward movement. The base signal is "pause/accumulation" rather than impulsive continuation. Confirmation of renewed growth will come from a sustained transition of the indicator into positive territory and consolidation above the neutral zone, while deepening into negative territory will mean that weakness is intensifying and recovery is losing stability.
Bitcoin Futures Flow Index
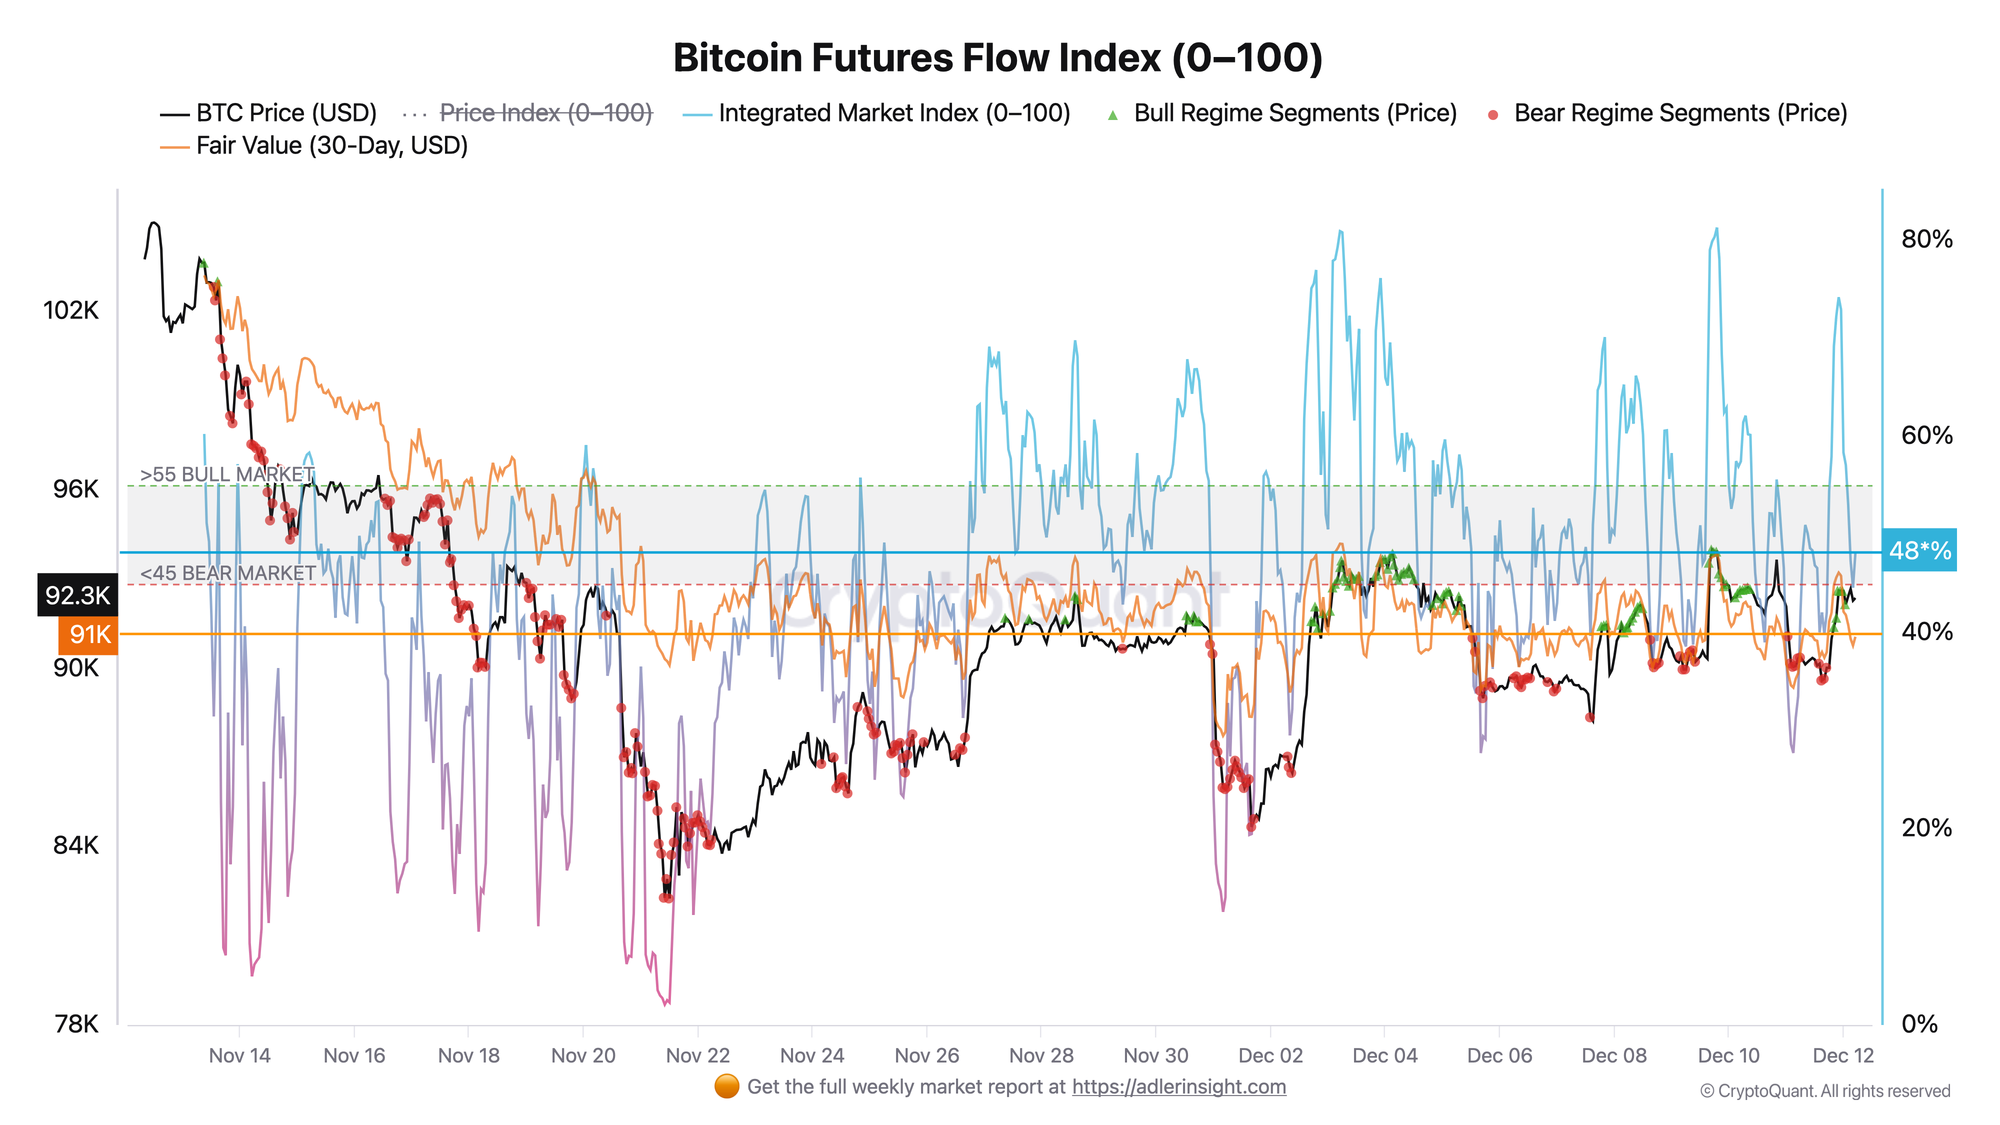
The integrated index reflects the state of flows and regime in the derivatives market, highlighting bullish and bearish segments. Currently, the index is in neutral territory between regime thresholds, and the structure of recent days looks fragmented with alternating bullish and bearish segments without clear dominance of one side, while price overall holds close to the short-term "fair" trajectory.
In derivatives, this looks like cautious positioning and waiting for a new signal rather than aggressive bet scaling. The second chart confirms the conclusion of the first - impulse is not expanding because flows are not providing sustained bias. The main trigger for regime change will be simultaneous consolidation of the Flow Index in the bullish zone and improvement of adaptive momentum, while desynchronization of these signals will indicate continuation of the sideways phase.

FAQ
What does a neutral picture simultaneously in momentum and in futures flows mean?
This means a pause after a macro event, when the market is "digesting" the news and participants are not ready to support the movement with aggressive positioning.
What is the clearest signal that the pause has ended and the market is ready to continue the trend?
Synchronous confirmation - when momentum steadily improves and enters positive regime, and the futures flow index consolidates in the bullish zone. If confirmation appears in only one indicator, the market more often remains in oscillation mode with heightened sensitivity to news.
CONCLUSIONS
After the Fed's decision, Bitcoin remains in a consolidation phase, and adaptive momentum and futures flow indicators synchronously describe a neutral regime with a pause in the trend: impulse is weakened, and derivative positioning does not demonstrate sustained bias. The final position is neutral, with focus on confirmation. The main trigger for improvement is simultaneous transition of both indicators into bullish regimes. The main risk is continuation of weak impulse, where any deterioration of external background will quickly return the market to defensive phase.