
Bitcoin corrected to the level of $92K after the strongest drawdown in this cycle equal to -32% from ATH.
TL;DR
On-chain metrics record bearish signals: P/L Score has been in the -3 zone since November 6, corresponding to the bearish regime of past cycles.
Bitcoin P/L Block Dashboard
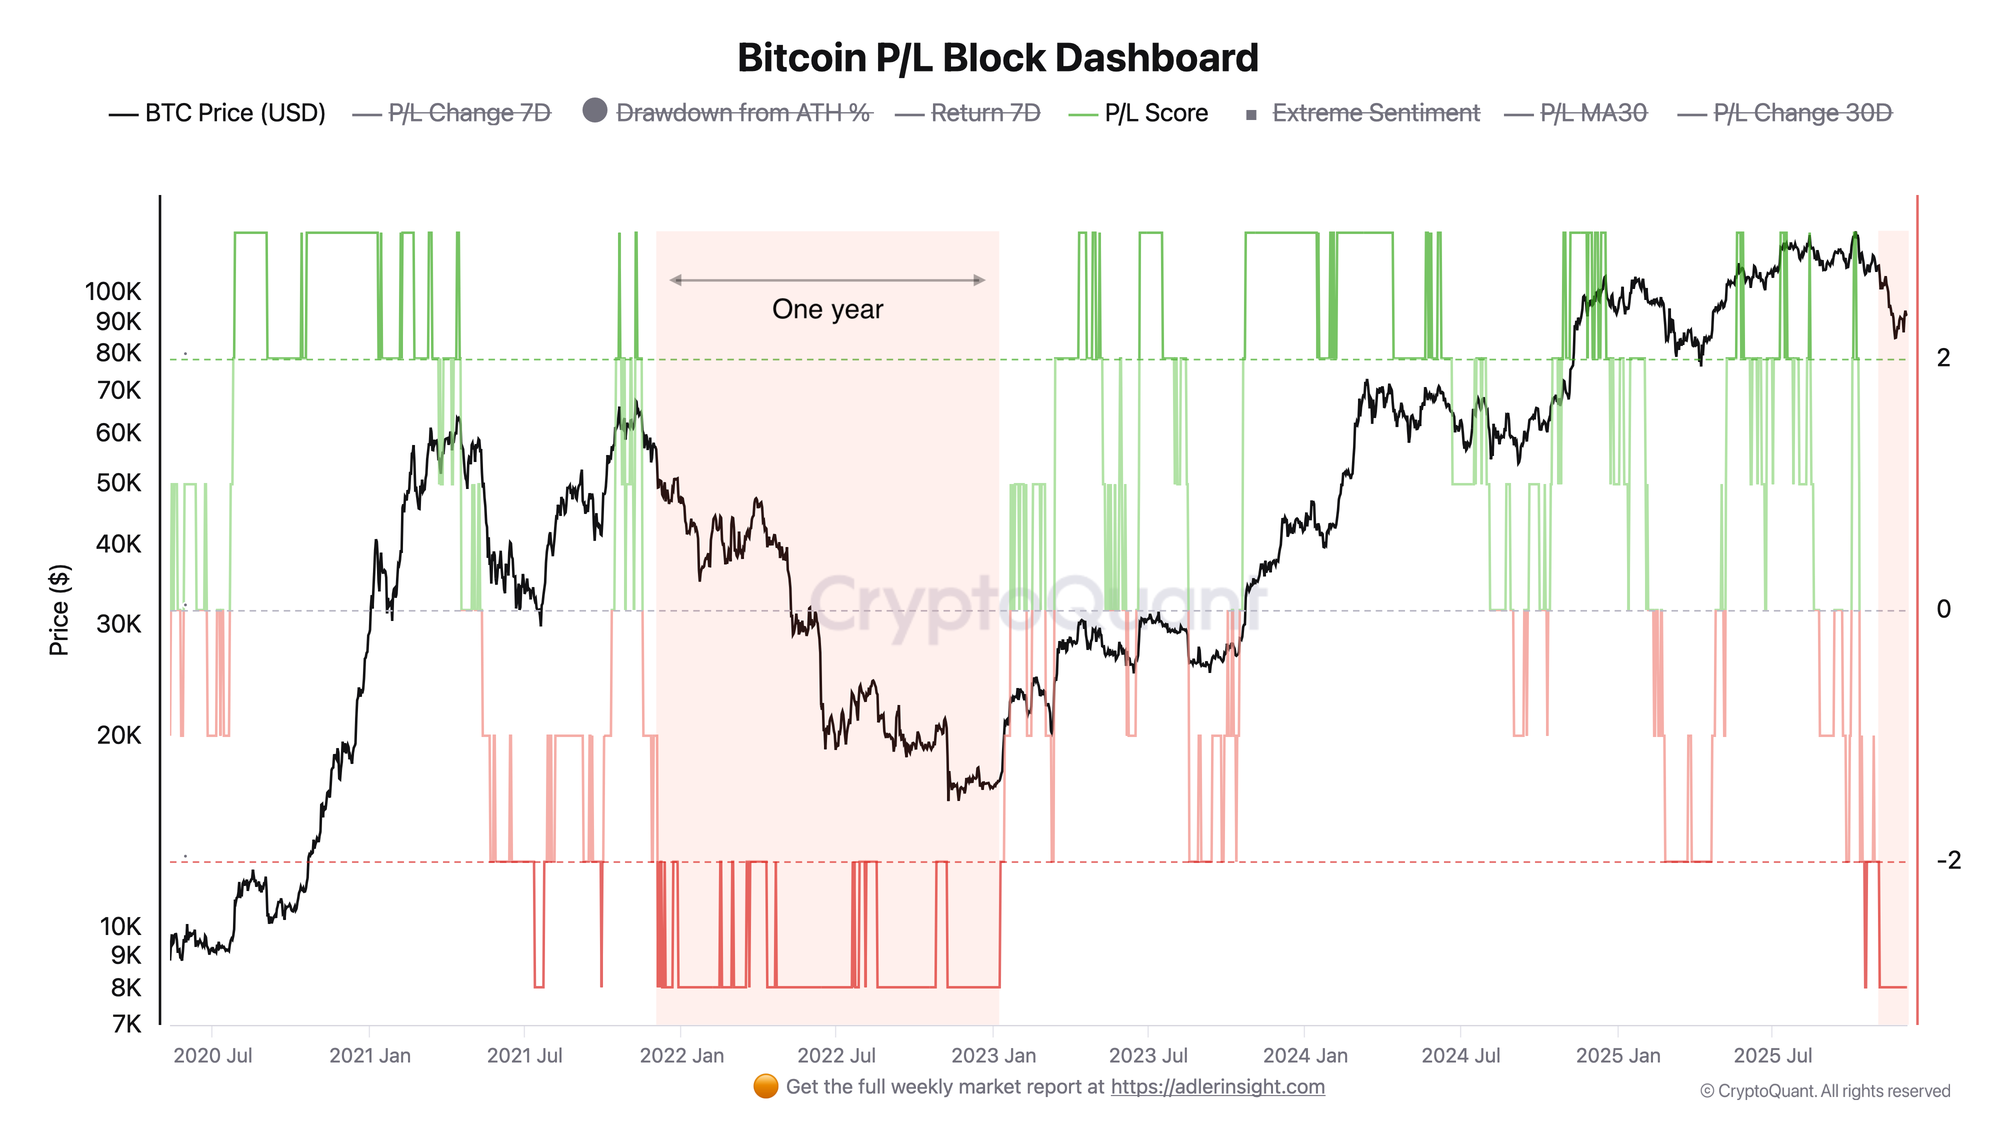
The chart tracks the ratio of profitable/loss UTXOs in each block and highlights moments of extreme sentiment. Green bars +3 (extreme bullish sentiment) concentrate at price peaks. Red bars -3 (extreme bearish) mark bear markets. Current picture: price $92K, the metric dropped to the -3 mark since November 6, the market entered a deep correction phase that lasted a year in the previous cycle.
Bitcoin Drawdown from ATH %
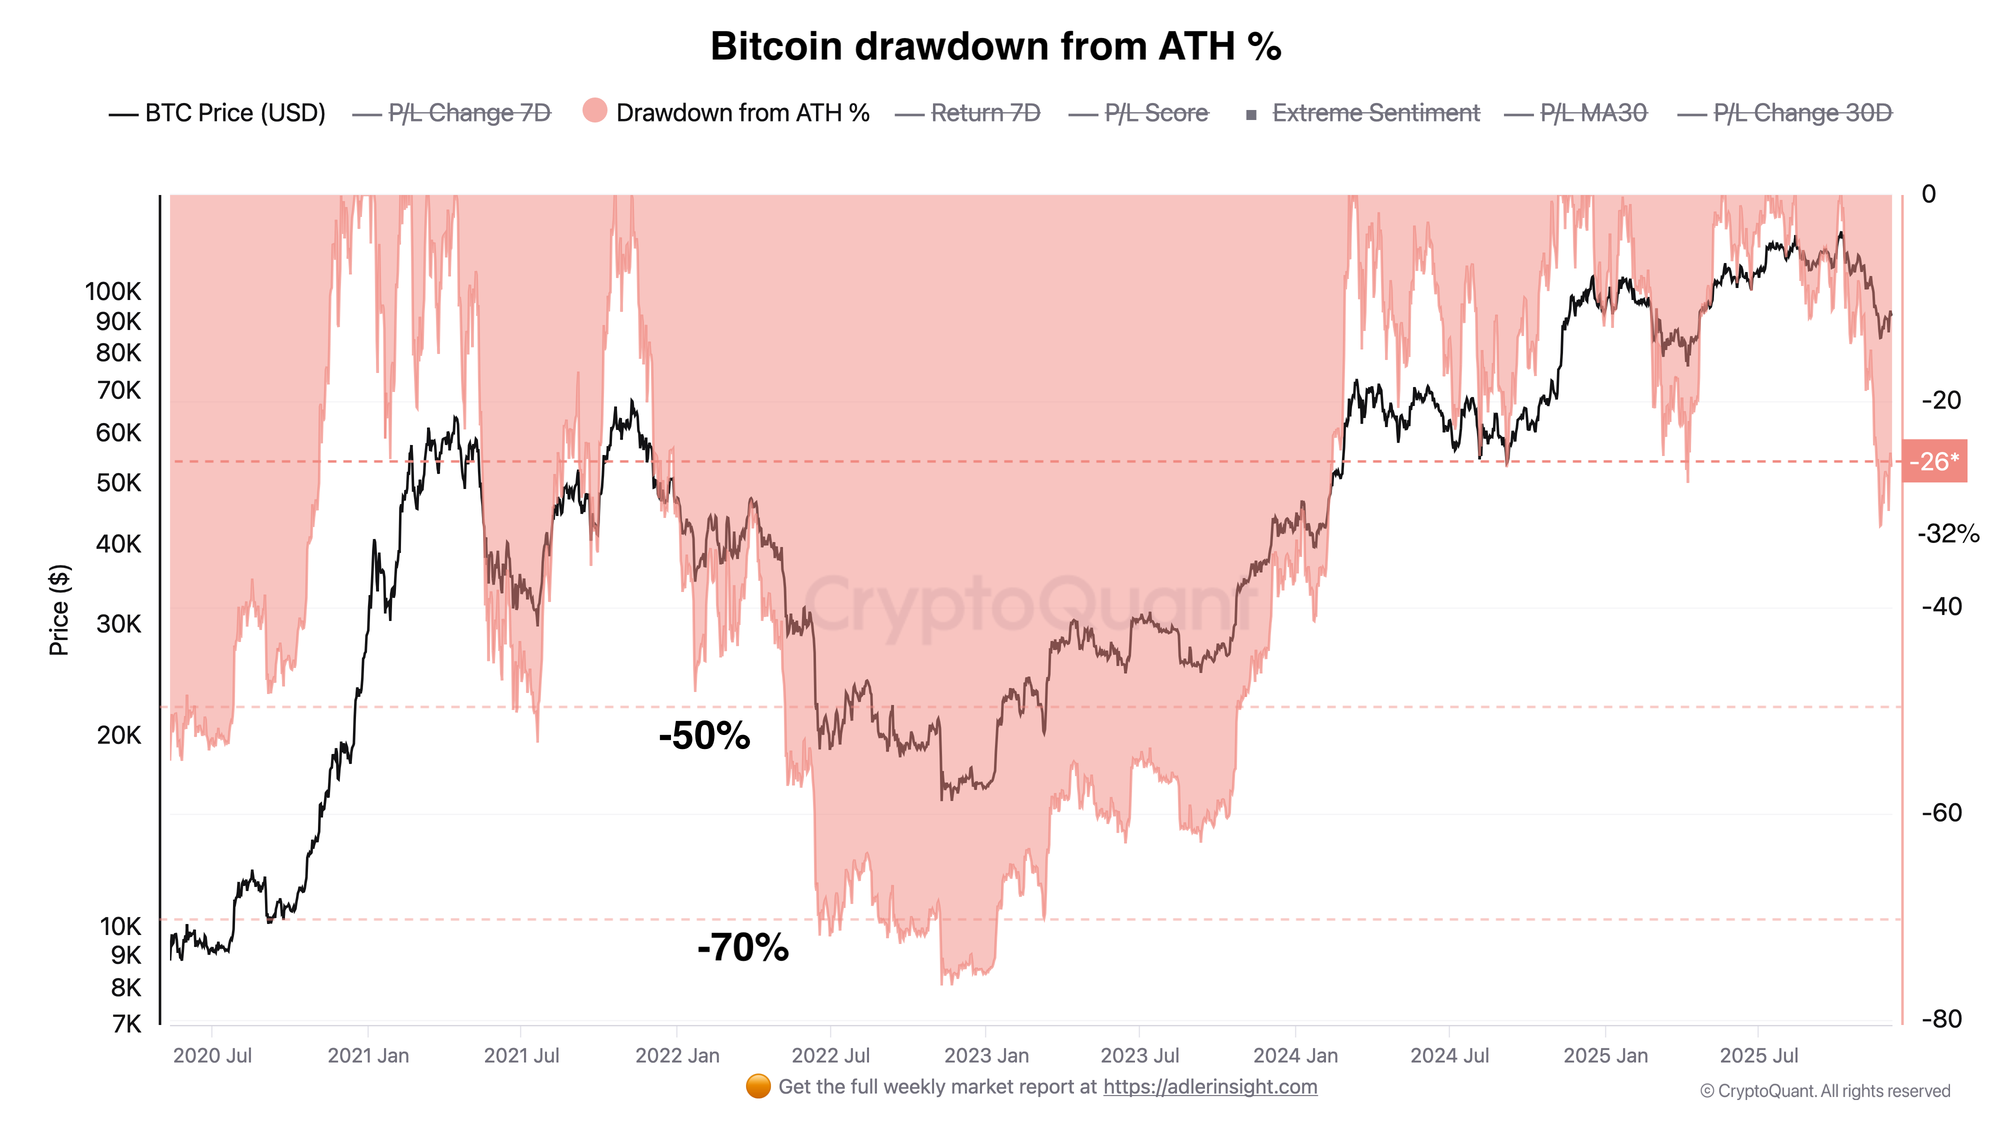
Drawdown overlay shows the percentage drawdown of the first cryptocurrency relative to peaks. Historical reference points: in the last cycle, light corrections were at the level of -20-25%, deep drawdowns of -50% and -70% marked capitulation. The current maximum drawdown of this cycle -32% is in an intermediate zone between a deep correction and market bottom.

FAQ
What does P/L Score = -3 mean?
P/L Score = -3 records an extreme predominance of unprofitable UTXOs. Historically, such a zone corresponds to bearish regimes and deep correction phases. In the previous cycle, similar signals appeared before prolonged periods of market cooling.
How dangerous is the current drawdown of -32%?
A -32% drawdown is more than typical corrections (-20-25%), but less than the capitulation levels of past cycles (-50% / -70%). This places the market in an intermediate zone where the risk of continued decline remains if macro and on-chain signals do not improve.
CONCLUSIONS
The current combination of signals indicates that the market has entered a phase of structural correction: P/L Score steadily holds in the -3 zone, which historically corresponds to bearish regimes, while the -32% drawdown already exceeds typical cycle corrections. As long as on-chain and macro indices show no signs of improvement, the probability of continued decline remains elevated, and recovery requires time and a shift in sentiment within the network's profit/loss structure.