
After an extended period of weakness in late December, the market is showing a local regime change. Structure Shift has moved from negative territory into pronounced positive readings, while momentum has settled above the neutral zone - both indicators point to a recovery of bullish structure.
TL;DR
Structural indicators are signaling a synchronized transition from a phase of weakness into a phase of strength. The key question is whether price can establish itself above the upper channel boundary to continue the move.
BTC Structure Shift: Regime Transition
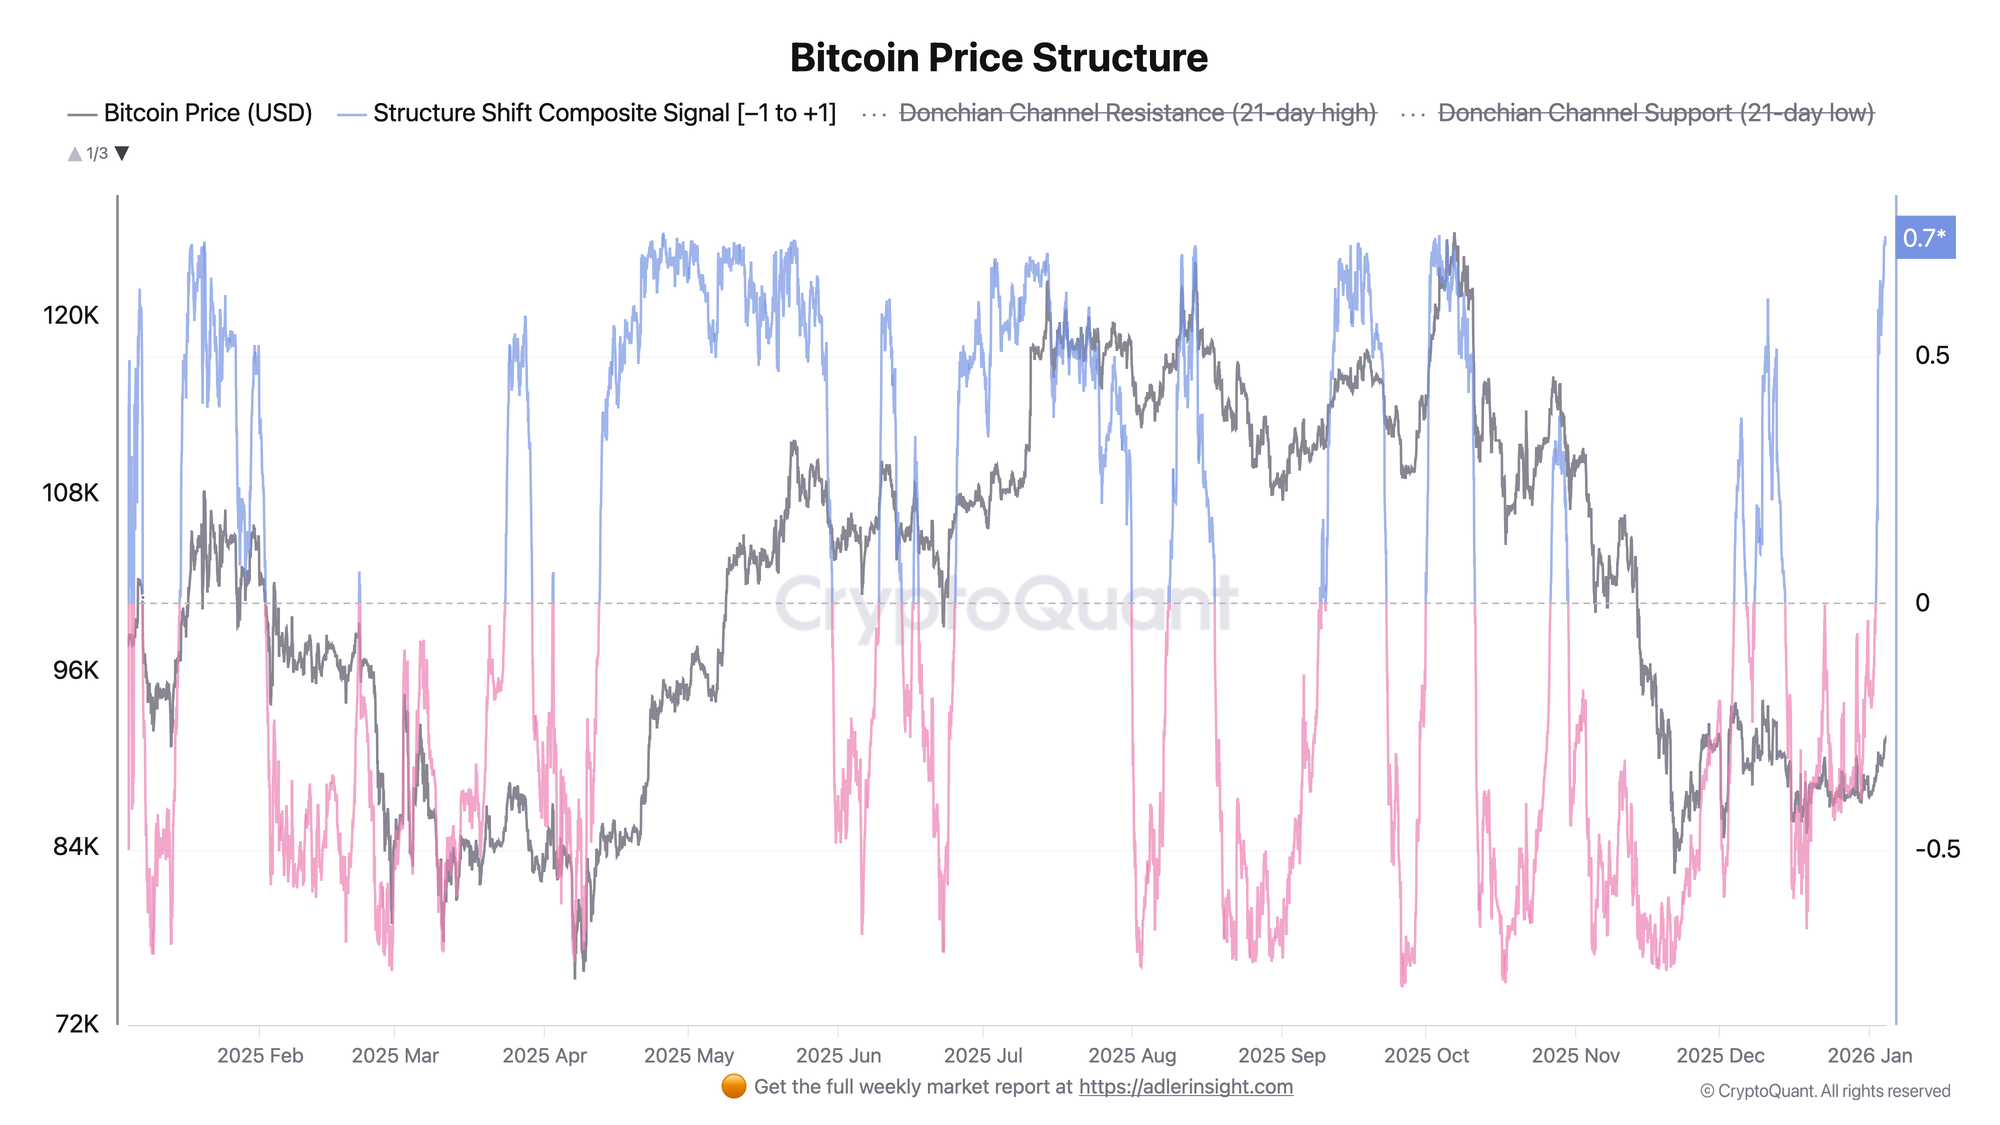
Structure Shift is a composite indicator combining channel position, MA trend, and directional movement within a range of -1 to +1.
In late December, the indicator was in a sustained negative zone (below -0.3), corresponding to bearish pressure and price decline toward the lower third of the range. Starting January 2nd, a reversal occurred: Structure Shift crossed the zero line from below, reaching +0.73 by January 4th - the upper portion of the positive zone. Simultaneously, price rose from $87,500 to $91,400, confirming the structural transition.
A Structure Shift move above +0.5 corresponds to sustained upward phases. The main trigger for continuation is holding the indicator above the zero line while testing resistance. A return below zero would signal a false breakout.
BTC Momentum & Donchian Channel Position
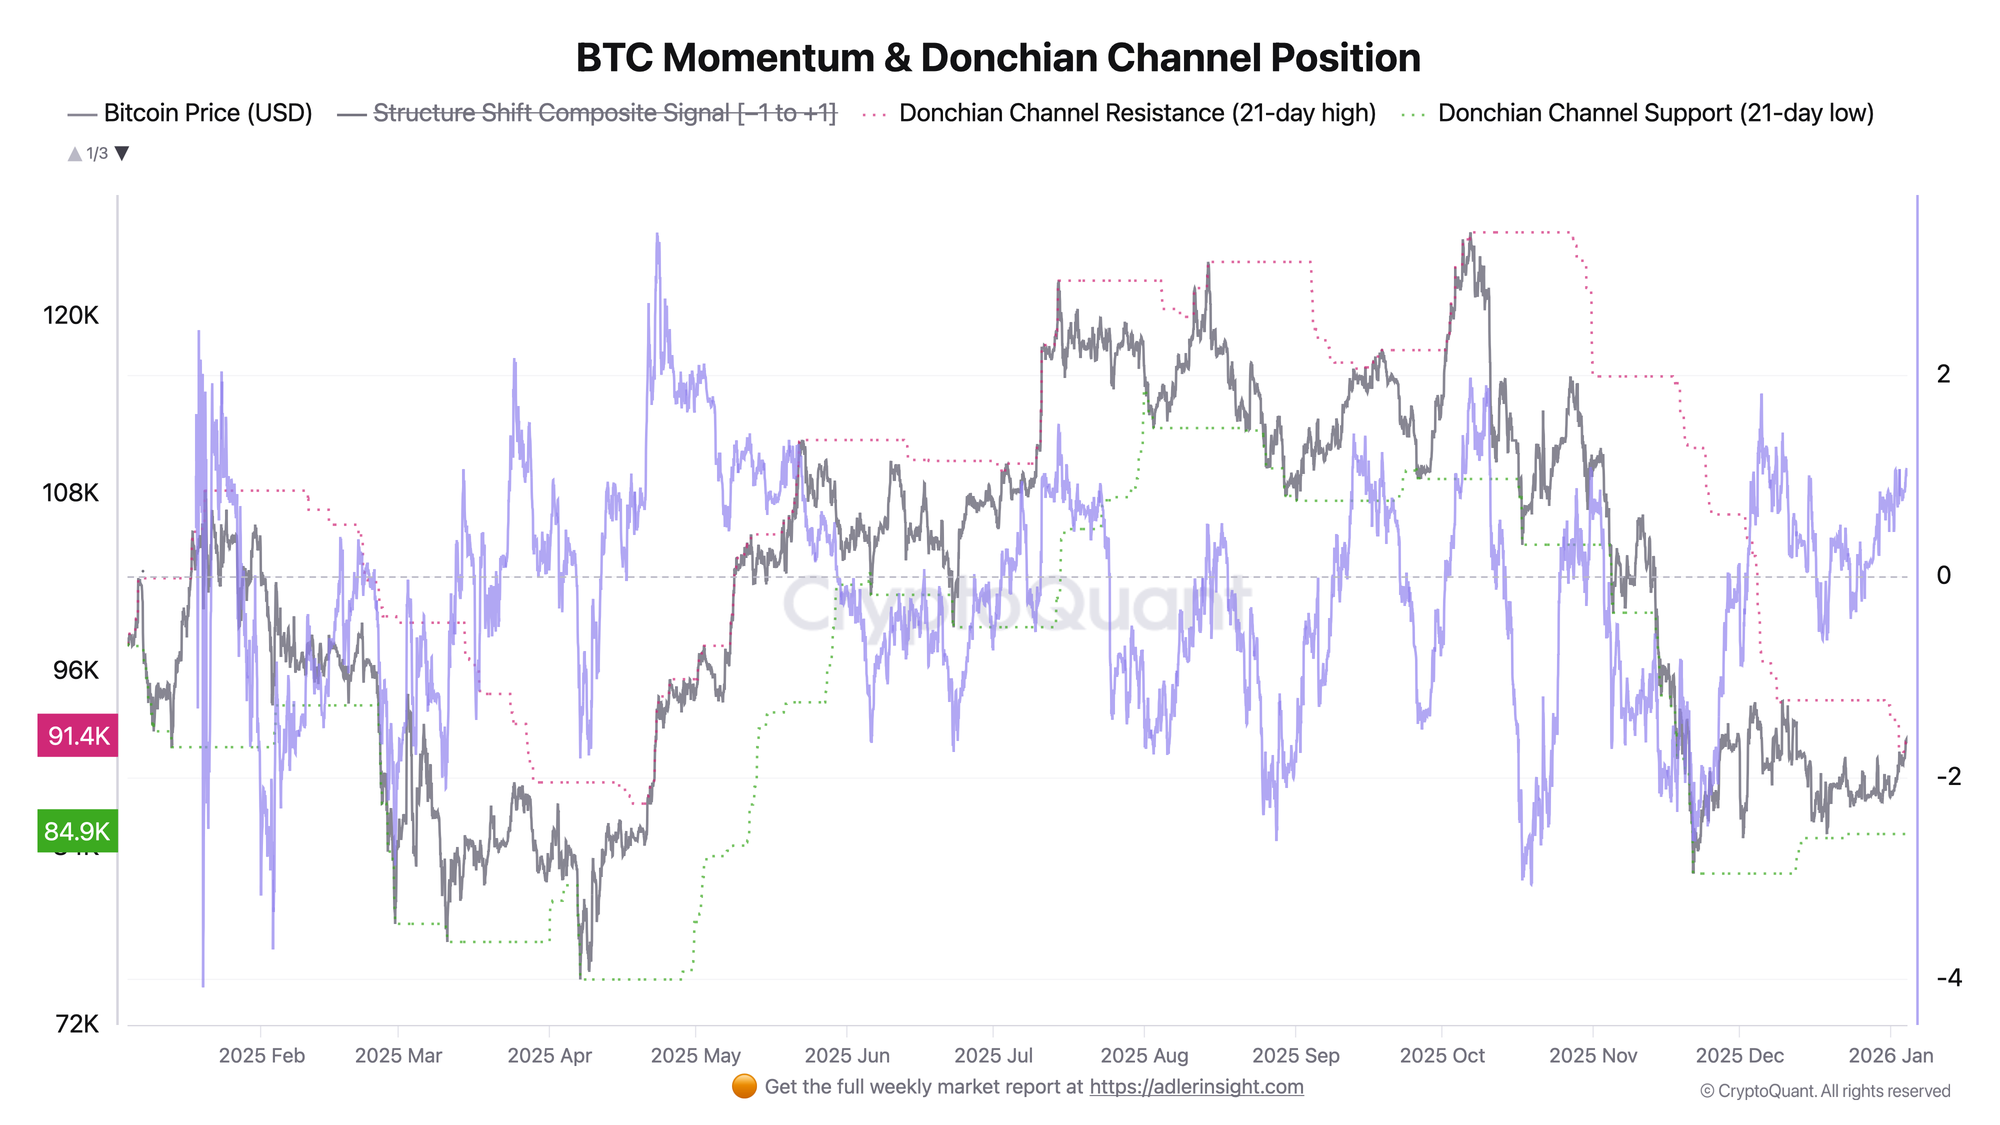
Momentum measures how much current returns deviate from the three-month average: values above 0.5 indicate the market is rising faster than usual, below 0.5 - slower or declining. Channel position reflects where price sits relative to the high and low of the past three weeks: 0 at the bottom of the range, 1 at the top. Currently, Momentum has settled in the 0.85–0.89 zone, indicating that the current rally significantly exceeds the average dynamics of recent months - a strong move, but not yet extreme. Channel position has reached 0.99, meaning price has approached the upper boundary of the trading range - the three-week high at $91,407, with support at $84,935.
The combination of strong momentum and position at the range ceiling creates a setup for a breakout scenario. However, being at the very upper boundary also implies short-term overbought conditions, increasing the risk of a pullback toward the middle of the channel before continuation.
Momentum confirms the Structure Shift conclusion: both indicators synchronously point to a bullish regime. The key focus today is price behavior at the upper channel boundary - a breakout and hold above $91,400 would open room for continuation, while rejection would return the market to consolidation mode.

FAQ
What does Structure Shift above +0.7 mean?
This is a zone of pronounced strength where channel position, moving average trend, and candle directionality all point to buyer dominance. Historically, such readings correspond to impulsive growth phases.
Under what conditions would the signal be invalidated?
A Structure Shift return below zero combined with channel position dropping below the midpoint would indicate a false breakout and return to uncertainty. The lower channel boundary remains critical support.

CONCLUSIONS
Structural indicators demonstrate a coordinated shift to risk-on mode following the late December weakness phase. Structure Shift in the +0.73 zone and momentum around 0.88 form a technical picture favorable for continued growth. The current regime is moderately bullish with emphasis on breaking the upper channel boundary. The main confirmation trigger is a hold above resistance while Structure Shift remains in positive territory. The primary risk is rejection from the upper boundary and a return of indicators to neutral values, which would shift the market back into consolidation mode.