
STH SOPR (Short-Term Holder Spent Output Profit Ratio) is one of the key on-chain indicators for analyzing Bitcoin short-term holder behavior. In this guide, we'll break down how it's calculated, how to interpret its values, and how to apply it in trading strategies.
What is STH SOPR?
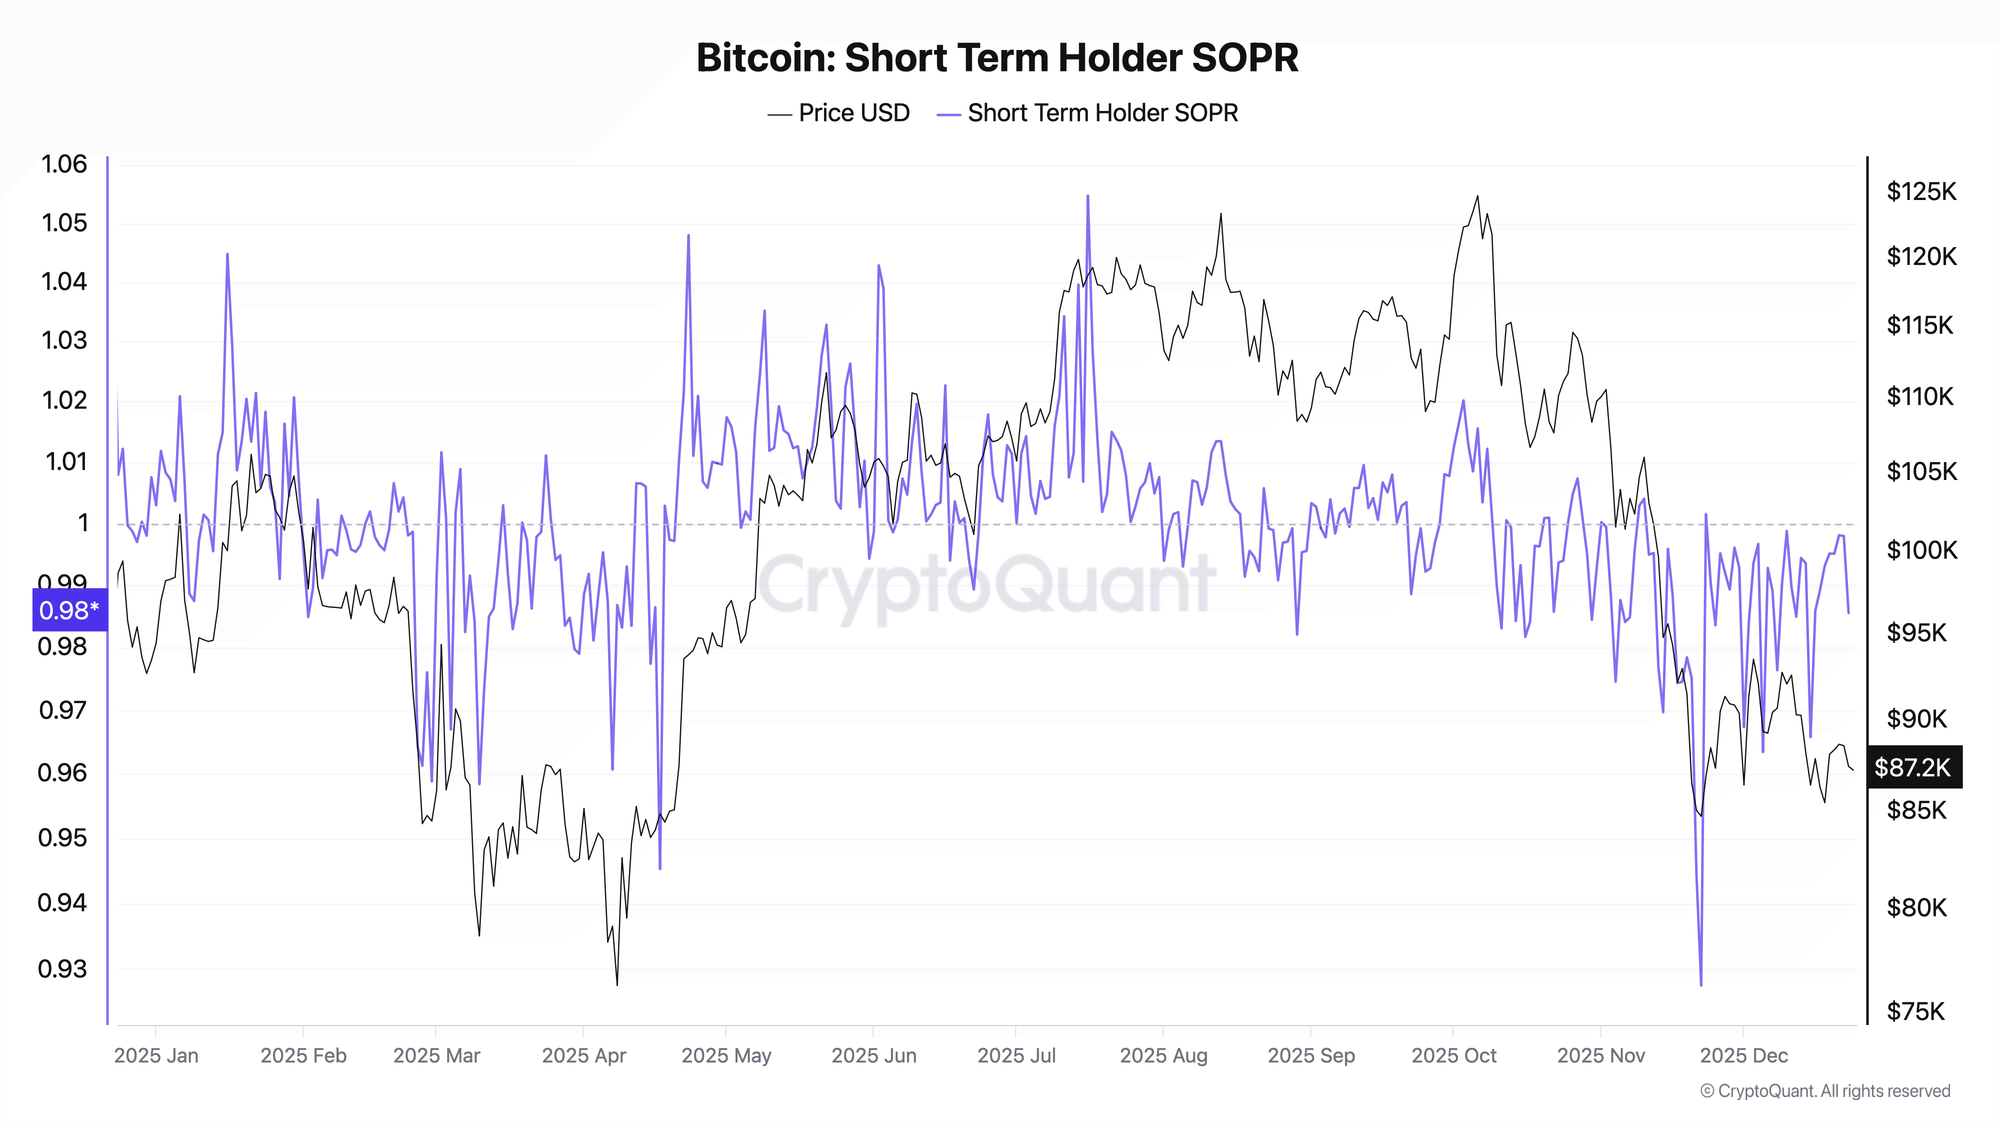
STH SOPR shows whether short-term Bitcoin holders are selling their coins at a profit or loss — those who have held coins for less than 155 days.
Formula:
STH SOPR = BTC Selling Price / BTC Purchase Price
Where only UTXOs (unspent transaction outputs) that existed for less than 155 days are considered.
Data Sources:
- Glassnode - original source of the metric
- CryptoQuant - alternative provider
- Bitcoin Magazine Pro - free charts
How STH SOPR is Calculated
Step 1: Defining Short-Term Holders (STH)
Short-term holders are addresses that have held Bitcoin for less than 155 days. This threshold was determined based on Glassnode's 2020 research: after 155 days, the probability of selling coins drops sharply.
STH (Short-Term Holder) < 155 days - Sensitive to volatility, tend to sell under stress
LTH (Long-Term Holder) ≥ 155 days - More resilient, sell during euphoria phase
Step 2: Calculating Profit/Loss
For each STH transaction on the network:
- The price at which the coin was received is taken (UTXO creation)
- Compared to the price at the time of spending (UTXO spent)
- The ratio is calculated
Step 3: Aggregation
All individual ratios are aggregated into a single indicator for the period (usually daily).
Process Visualization:
[Buy BTC at $40,000] → Hold 60 days → [Sell at $44,000]
                                              ↓
                                    SOPR = 44,000 / 40,000 = 1.10
                                              ↓
                                    Sold at 10% profit
How to Interpret STH SOPR Values
STH SOPR > 1 - Short-Term Holders Selling at Profit
What it means:
- Average selling price is above average purchase price
- Market provides opportunity to take profits
- The higher the value, the greater the realized profit
Market context:
- In a bull market: normal state, trend is healthy
- Extremely high values (>1.05): possible local overheating
STH SOPR < 1 - Short-Term Holders Selling at Loss
What it means:
- Average selling price is below average purchase price
- Holders are capitulating, realizing losses
- Sign of fear and stress in the market
Market context:
- In a bear market: typical state
- Extremely low values (<0.95): possible capitulation, potential bottom
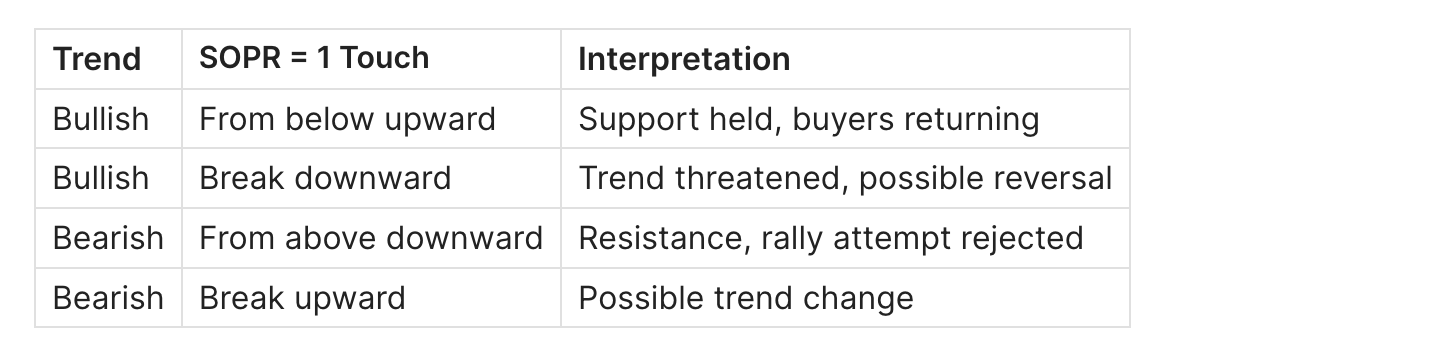
STH SOPR = 1 - Reset Signal
What it means:
- Short-term holders are selling at break-even
- Balance between profit and loss
- Critically important support/resistance level
Market context:
STH SOPR Trading Signals
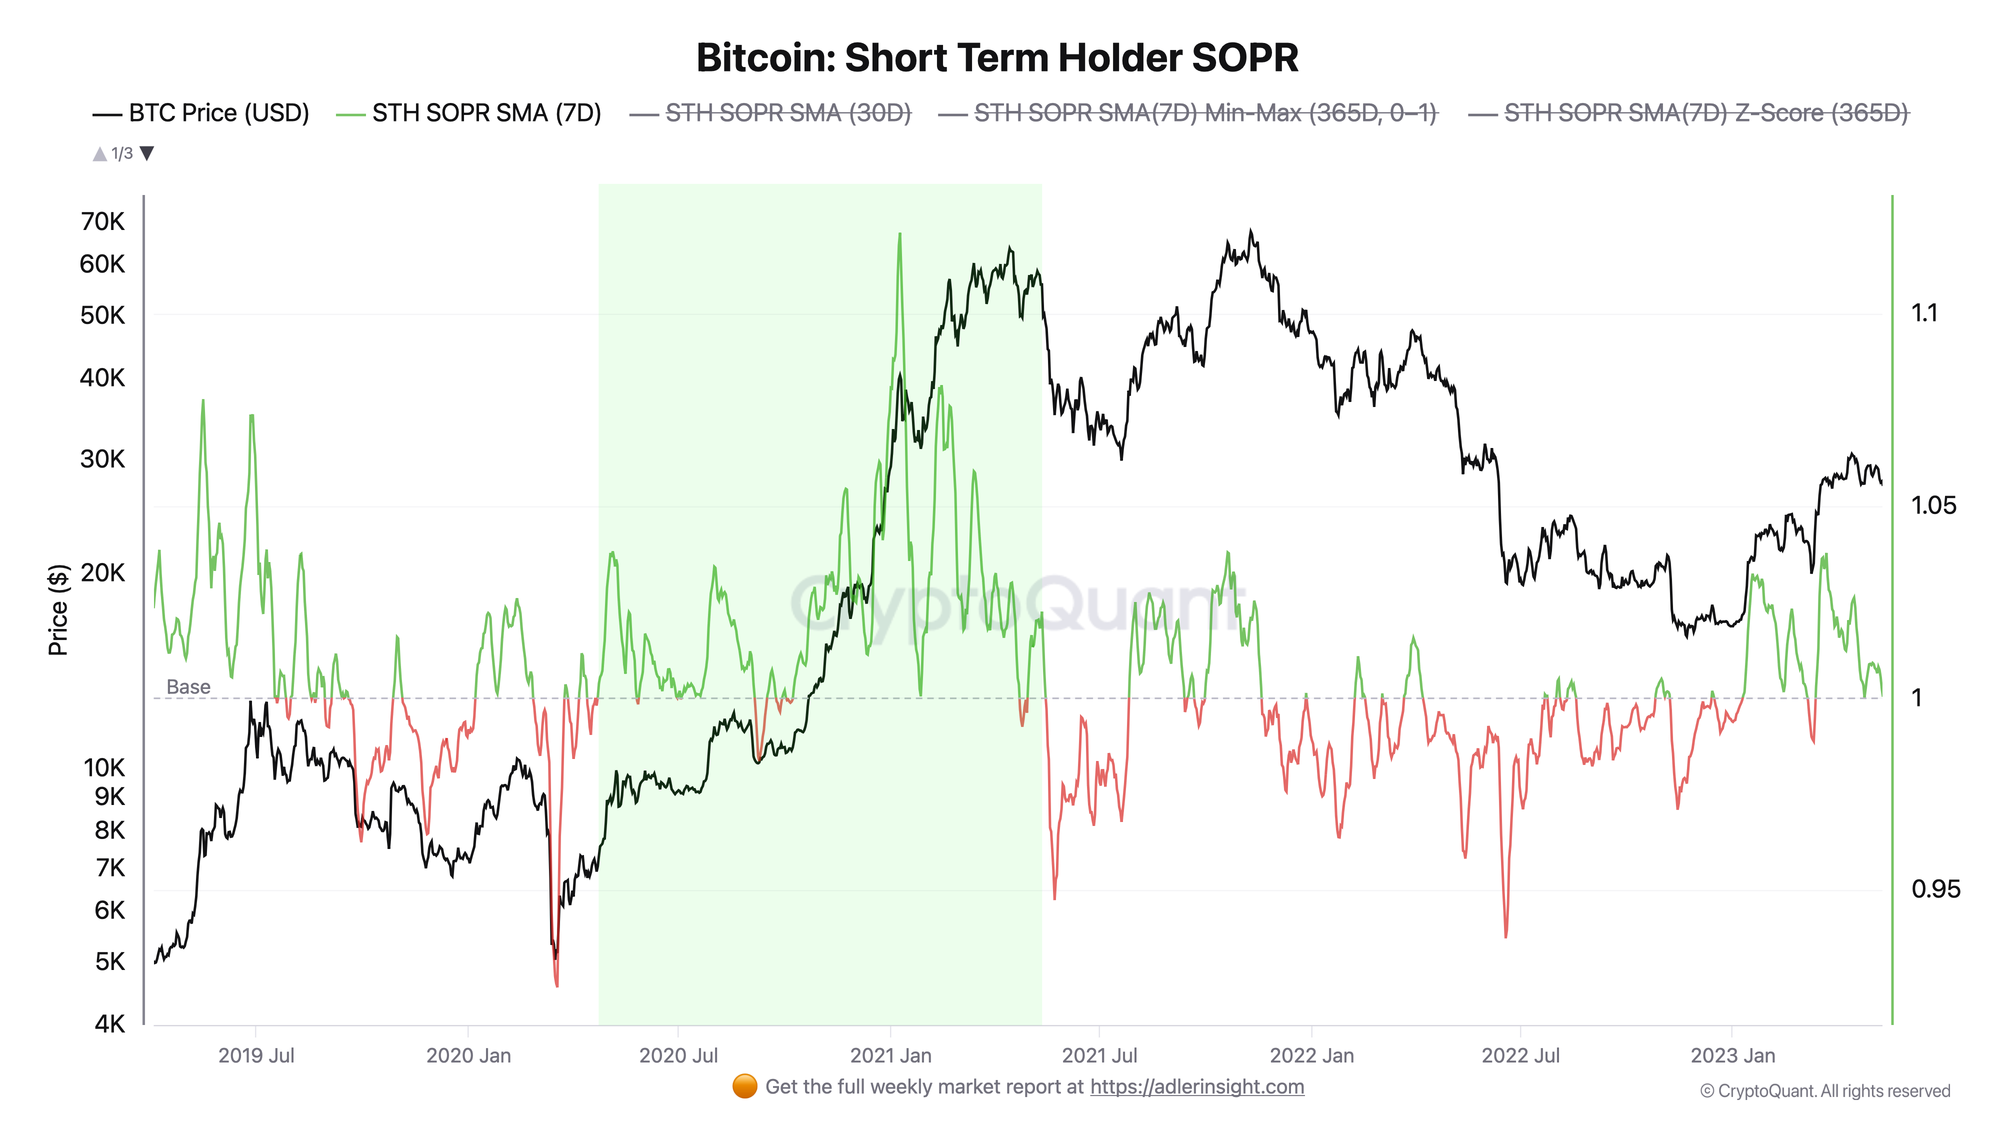
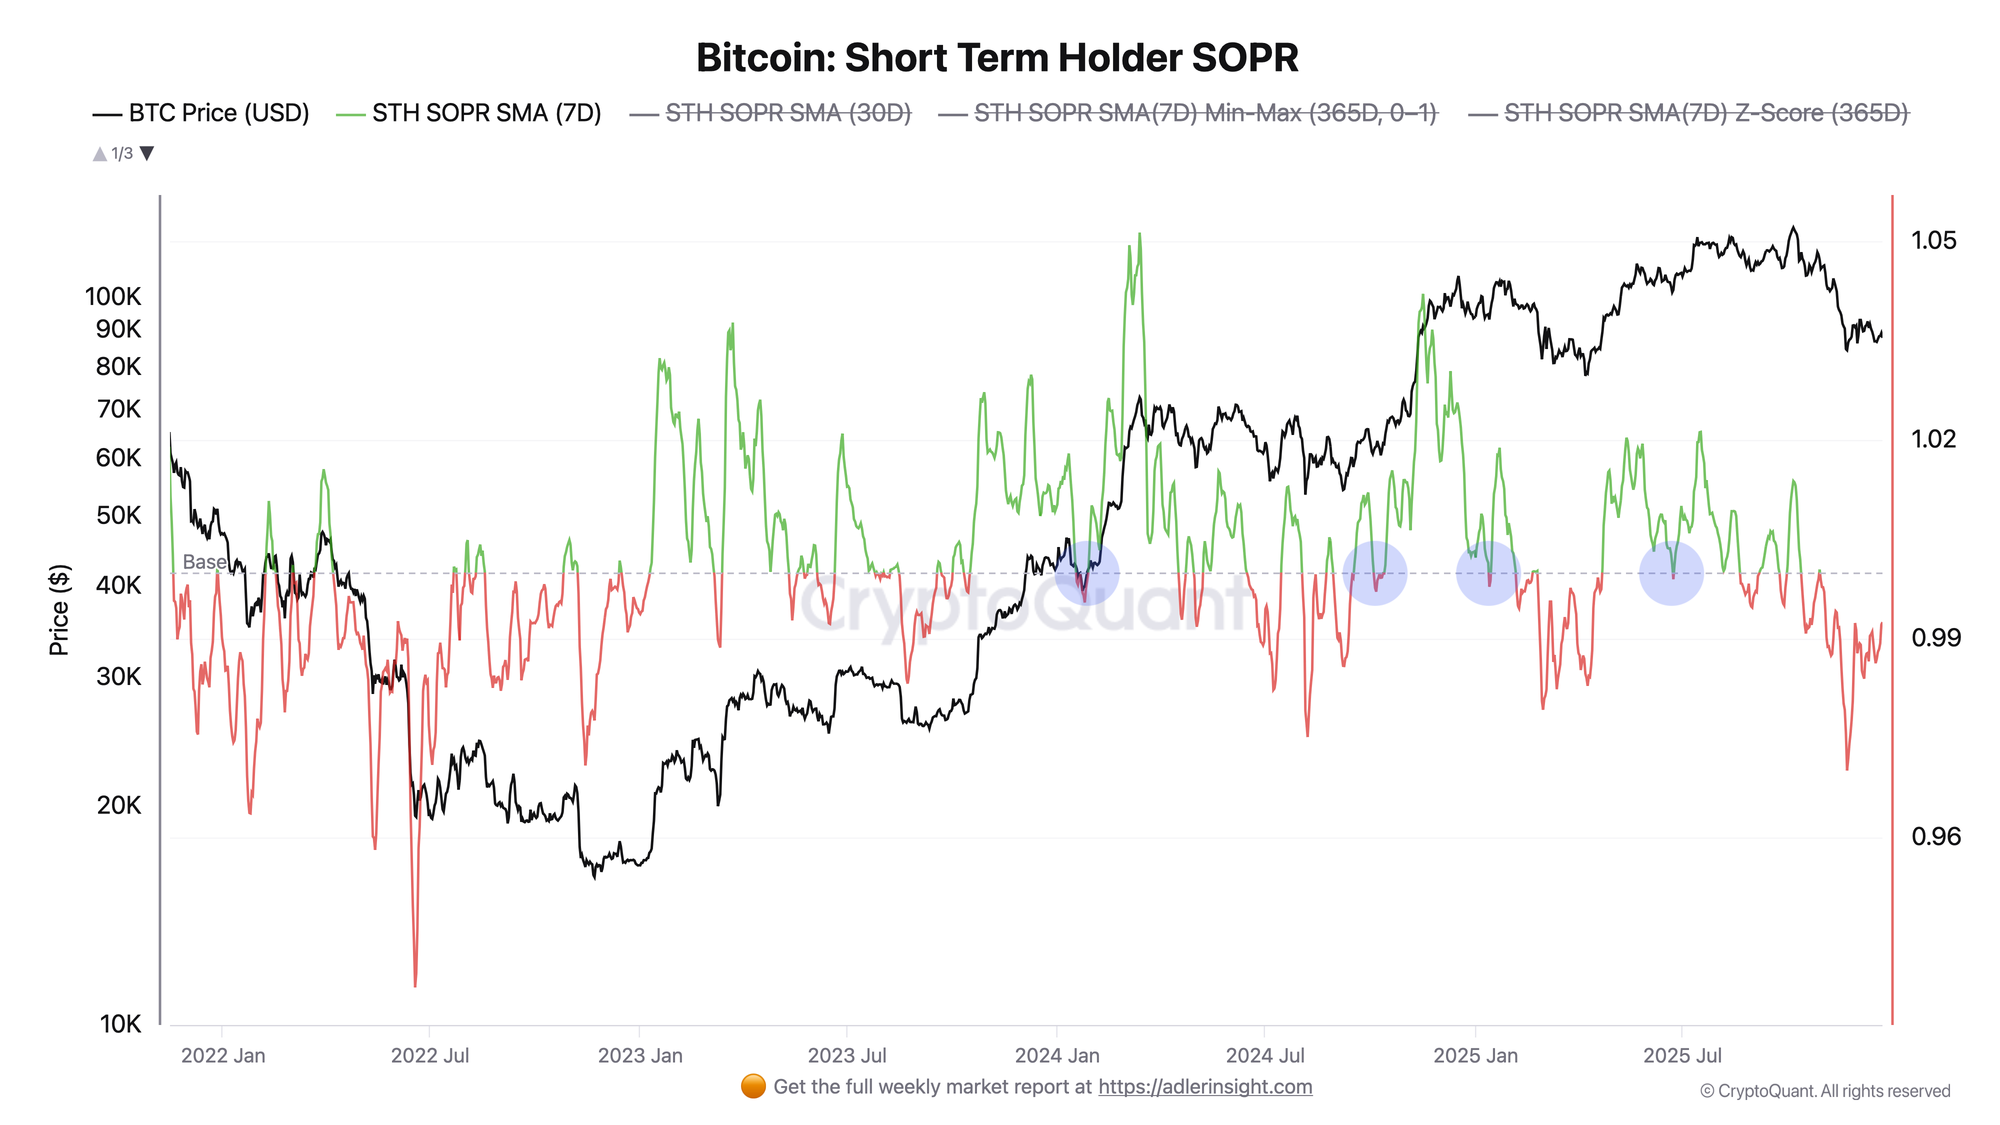
Historical Example 1: 2021 Bull Market
Situation: January-April 2021, BTC rise from $30,000 to $64,000
STH SOPR behavior:
- Consistently above 1.0
- Reset signals worked as entry points
Multiple touches of 1.0 level - bounce each time
Conclusion: In a bull market, STH SOPR dropping to 1.0 is a buying opportunity.
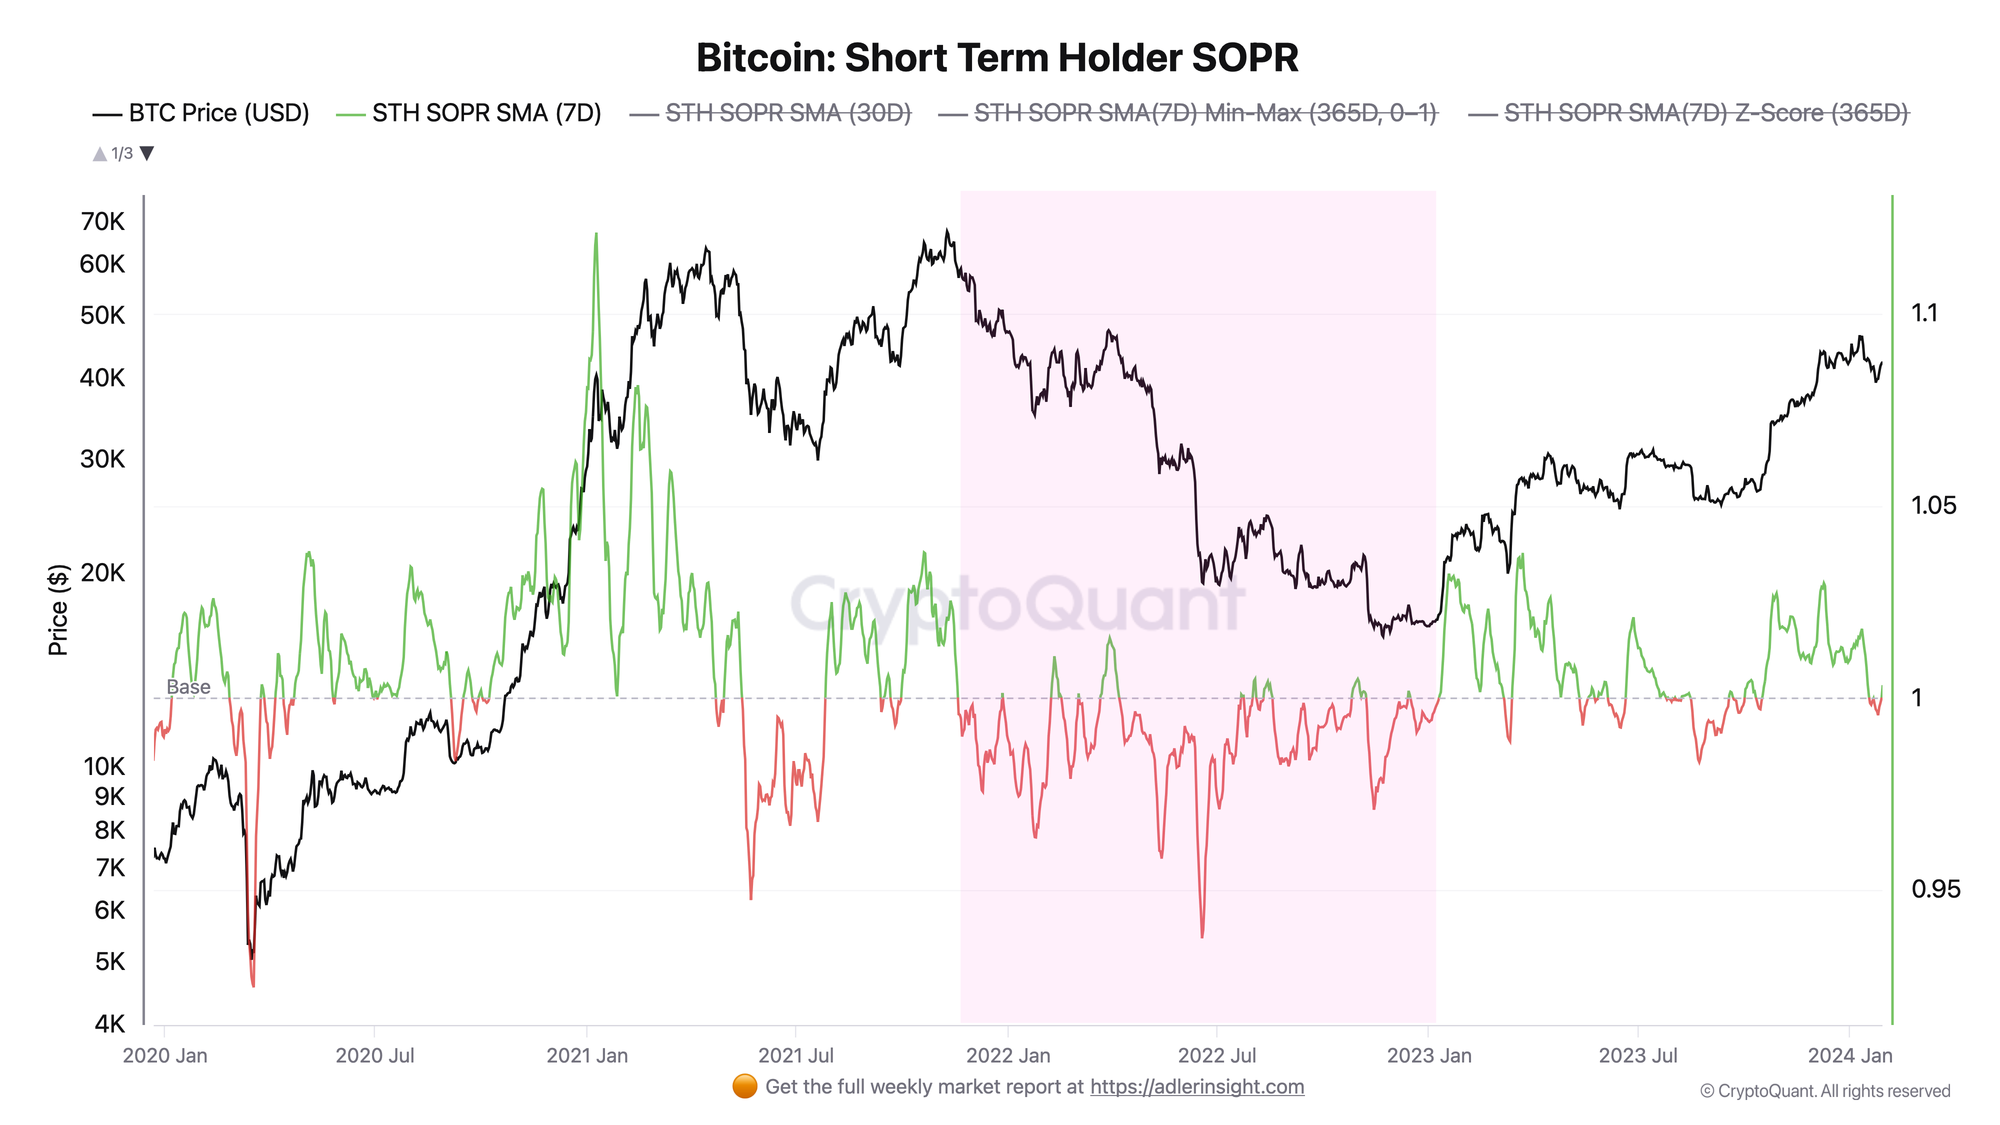
Historical Example 2: 2022 Capitulation
Situation: May-June 2022, LUNA/UST crash, BTC drop from $40,000 to $17,600
STH SOPR behavior:
- Consistently below 1.0
- Extreme values of 0.90-0.92
- Massive capitulation of short-term holders
Conclusion: Extremely low STH SOPR (<0.92) historically coincides with bottom formation.
Historical Example 3: 2024 Correction
Situation: August 2024, correction after ETF launch
STH SOPR behavior:
- Drop below 1.0
- Quick recovery above 1.0
- Reset confirmed, trend preserved
Conclusion: Brief dips below 1.0 with quick recovery are signs of healthy correction, not trend change.
Practical Application
Buy signal (bullish context):
- STH SOPR drops to 1.0 or slightly below
- Quick recovery above 1.0
- Confirmation: volume increase, positive funding rate
Caution signal:
- STH SOPR consistently below 1.0 for more than 3-5 days
- No buyer reaction at 1.0 level
- Confirmation: negative funding, rising exchange inflow
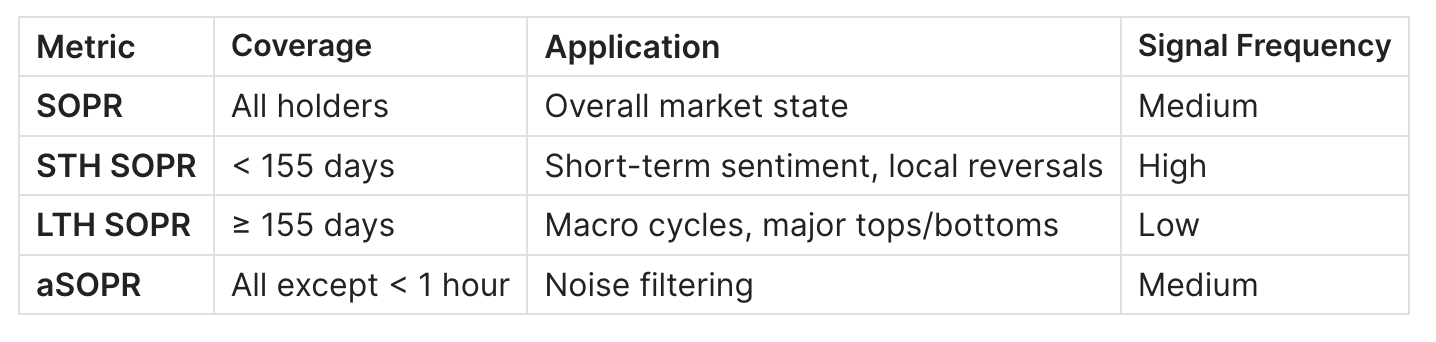
STH SOPR vs SOPR vs LTH SOPR

When to Use Which
STH SOPR is best for:
- Identifying local entry points
- Assessing short-term sentiment
- Swing trading (days-weeks)
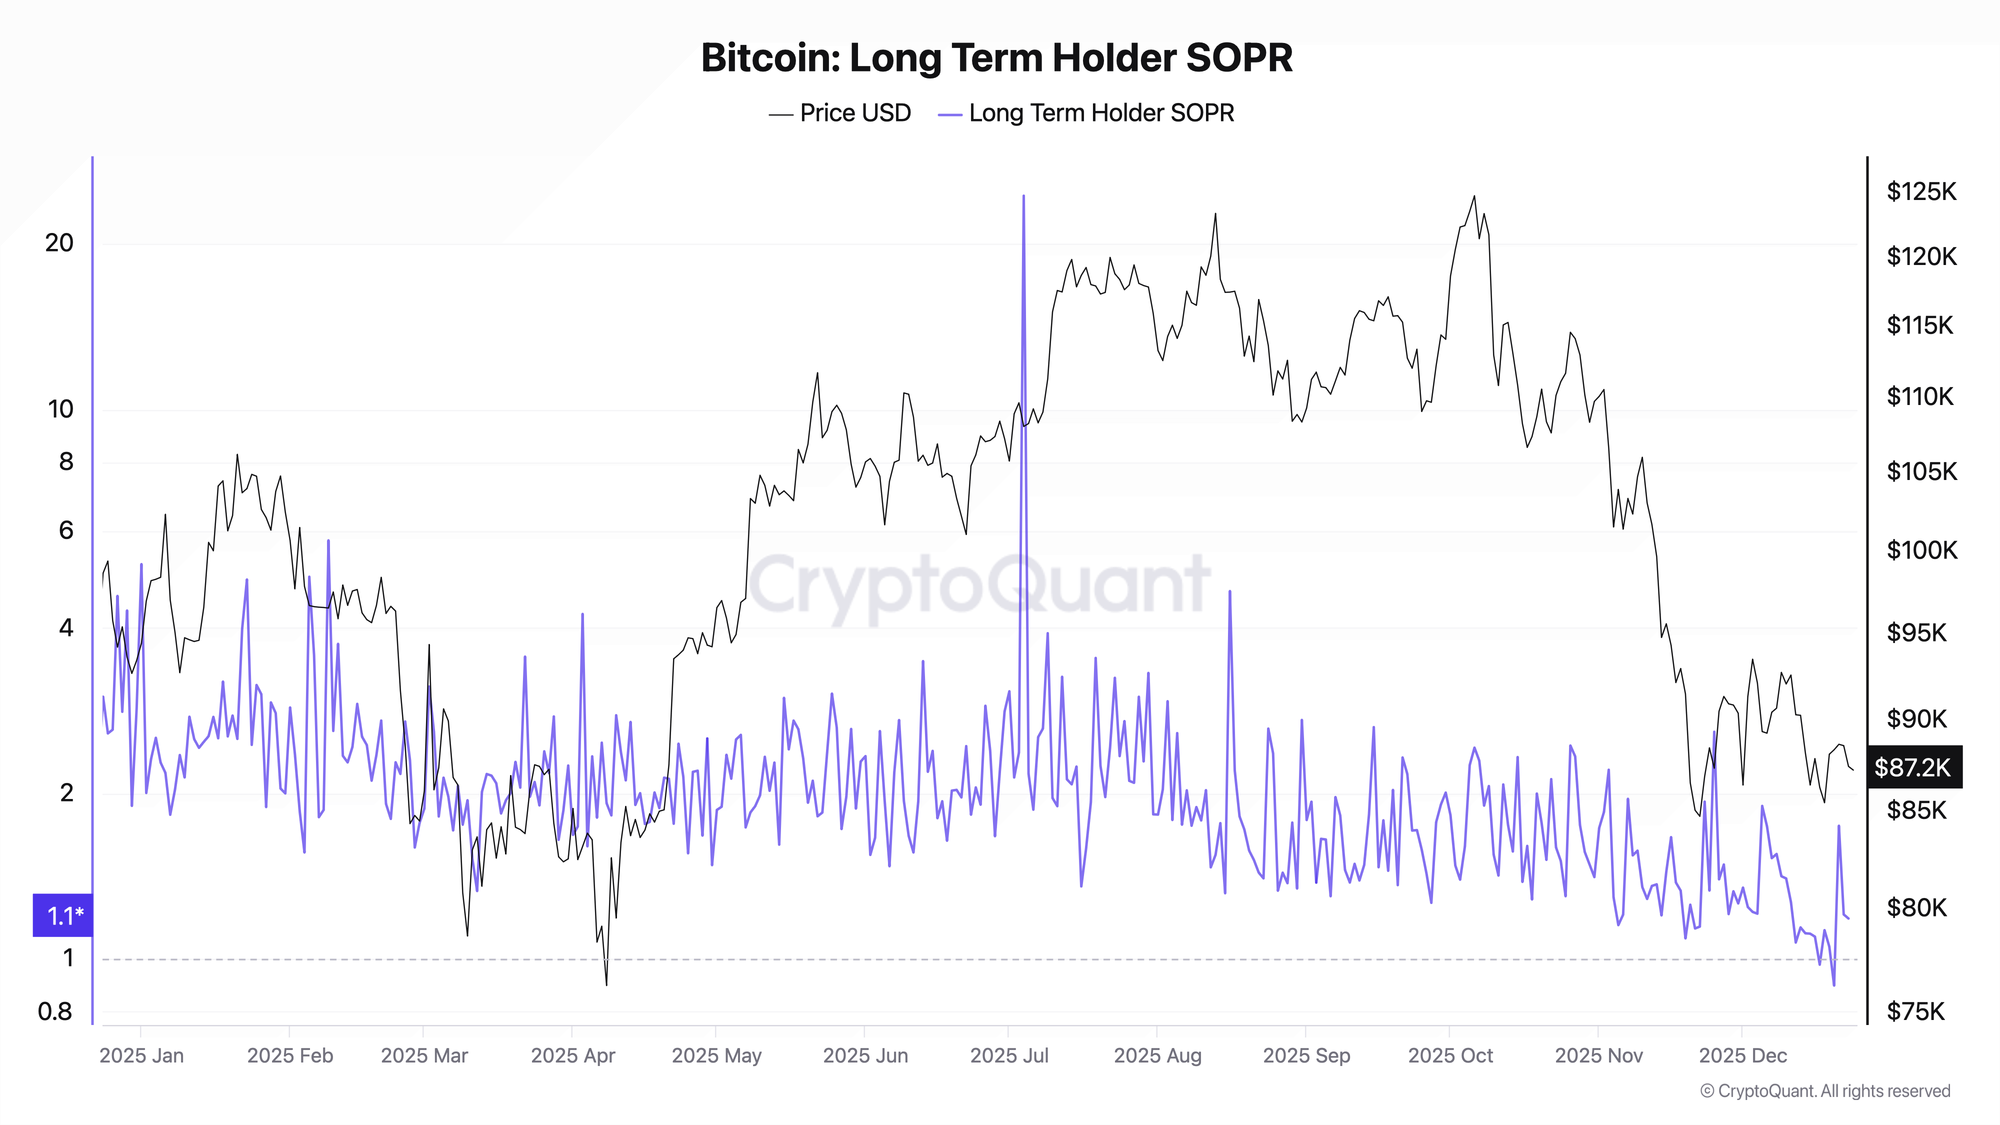
LTH SOPR is best for:
- Identifying macro tops and cycle bottoms
- Understanding "smart money" behavior
- Long-term positioning (months-years)
SOPR/aSOPR is best for:
- Overall market picture
- Confirming signals from STH/LTH versions
Combined Analysis
The strongest signals occur when aligned:
STH SOPR < 1 + LTH SOPR > 1 = Short-term capitulating, long-term accumulating
                              → Potential bottom

STH SOPR > 1.05 + LTH SOPR > 1.5 = Everyone taking profits
                                   → Potential top
STH SOPR Limitations
When the Indicator Doesn't Work
1. Sideways Market (Chop)
- SOPR oscillates around 1.0 without clear signals
- Many false breakouts
- Solution: use with volatility filters
2. Sharp Moves (Flash Crash)
- Data lags behind price
- UTXOs don't have time to form
- Solution: don't use for scalping
3. Changing Market Structure
- ETFs and institutions change patterns
- Historical levels may shift
- Solution: adapt threshold values
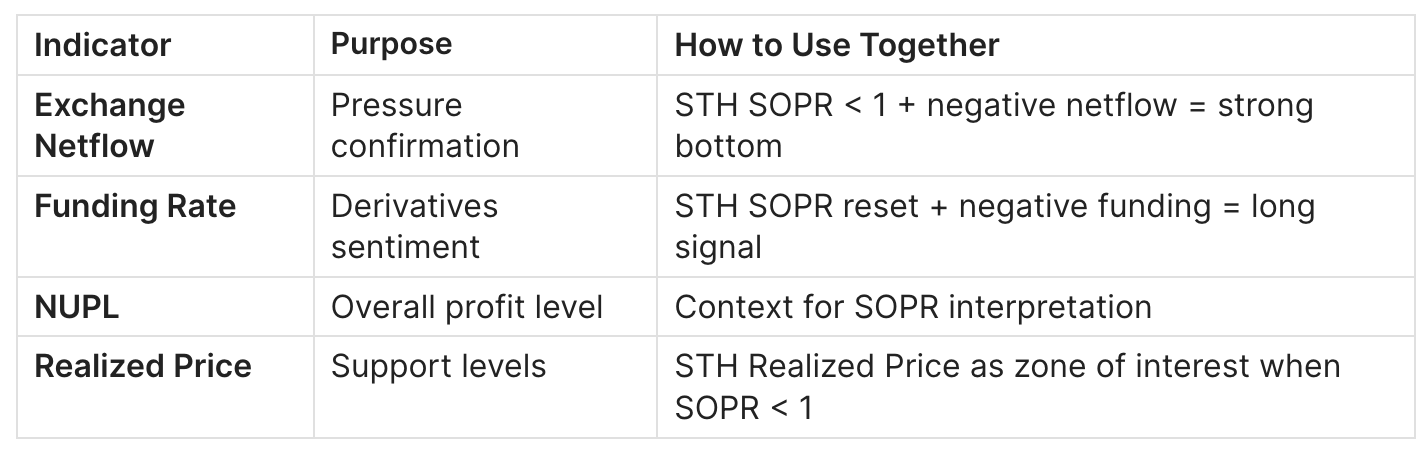
Which Indicators to Combine With
FAQ
What STH SOPR Value is Considered Good?
Depends on context:
- Bull market: > 1.0, ideally 1.01-1.03 (healthy growth without overheating)
- Entry point: drop to 1.0 with bounce
- Danger zone: consistently below 0.97 (capitulation) or above 1.06 (euphoria)
Where to Find STH SOPR Data?
Free:
- Bitcoin Magazine Pro — basic chart
- CryptoQuant — requires registration
Paid (extended data):
- Glassnode Studio — from $39/month
- CryptoQuant Pro — from $29/month
Is STH SOPR Currently Bullish or Bearish?
Current STH SOPR analysis and other on-chain metrics are published in ADLER AM - daily morning briefs on the Bitcoin market. Detailed Bitcoin market analysis is published on Substack, subscribe via the AdlerInsight page.

Conclusion
STH SOPR is a powerful tool for understanding short-term market participant behavior. Key principles:
- The 1.0 level is a critical point. A bounce from it in a bull market is a buy signal
- Extremes indicate reversals. Very low (<0.92) or high (>1.06) values precede corrections
- Context matters more than value. The same SOPR means different things in bull and bear markets
- Combine with other metrics. SOPR in isolation gives many false signals
Last updated: December 2024
This material is for educational purposes only and does not constitute investment advice.