
Bitcoin showed a positive 200/20DMA slope for the first time in a month and approached the 52-Week High range amid expectations of a Fed rate cut.
TL;DR
Bitcoin, after correcting to $80K, restored its bullish structure and is storming the 52-Week High against the backdrop of a third consecutive Fed rate cut almost fully priced in by the market, which improves financial conditions and creates a window for further growth absent a hawkish surprise from Powell.
Bitcoin 200DMA vs 50DMA
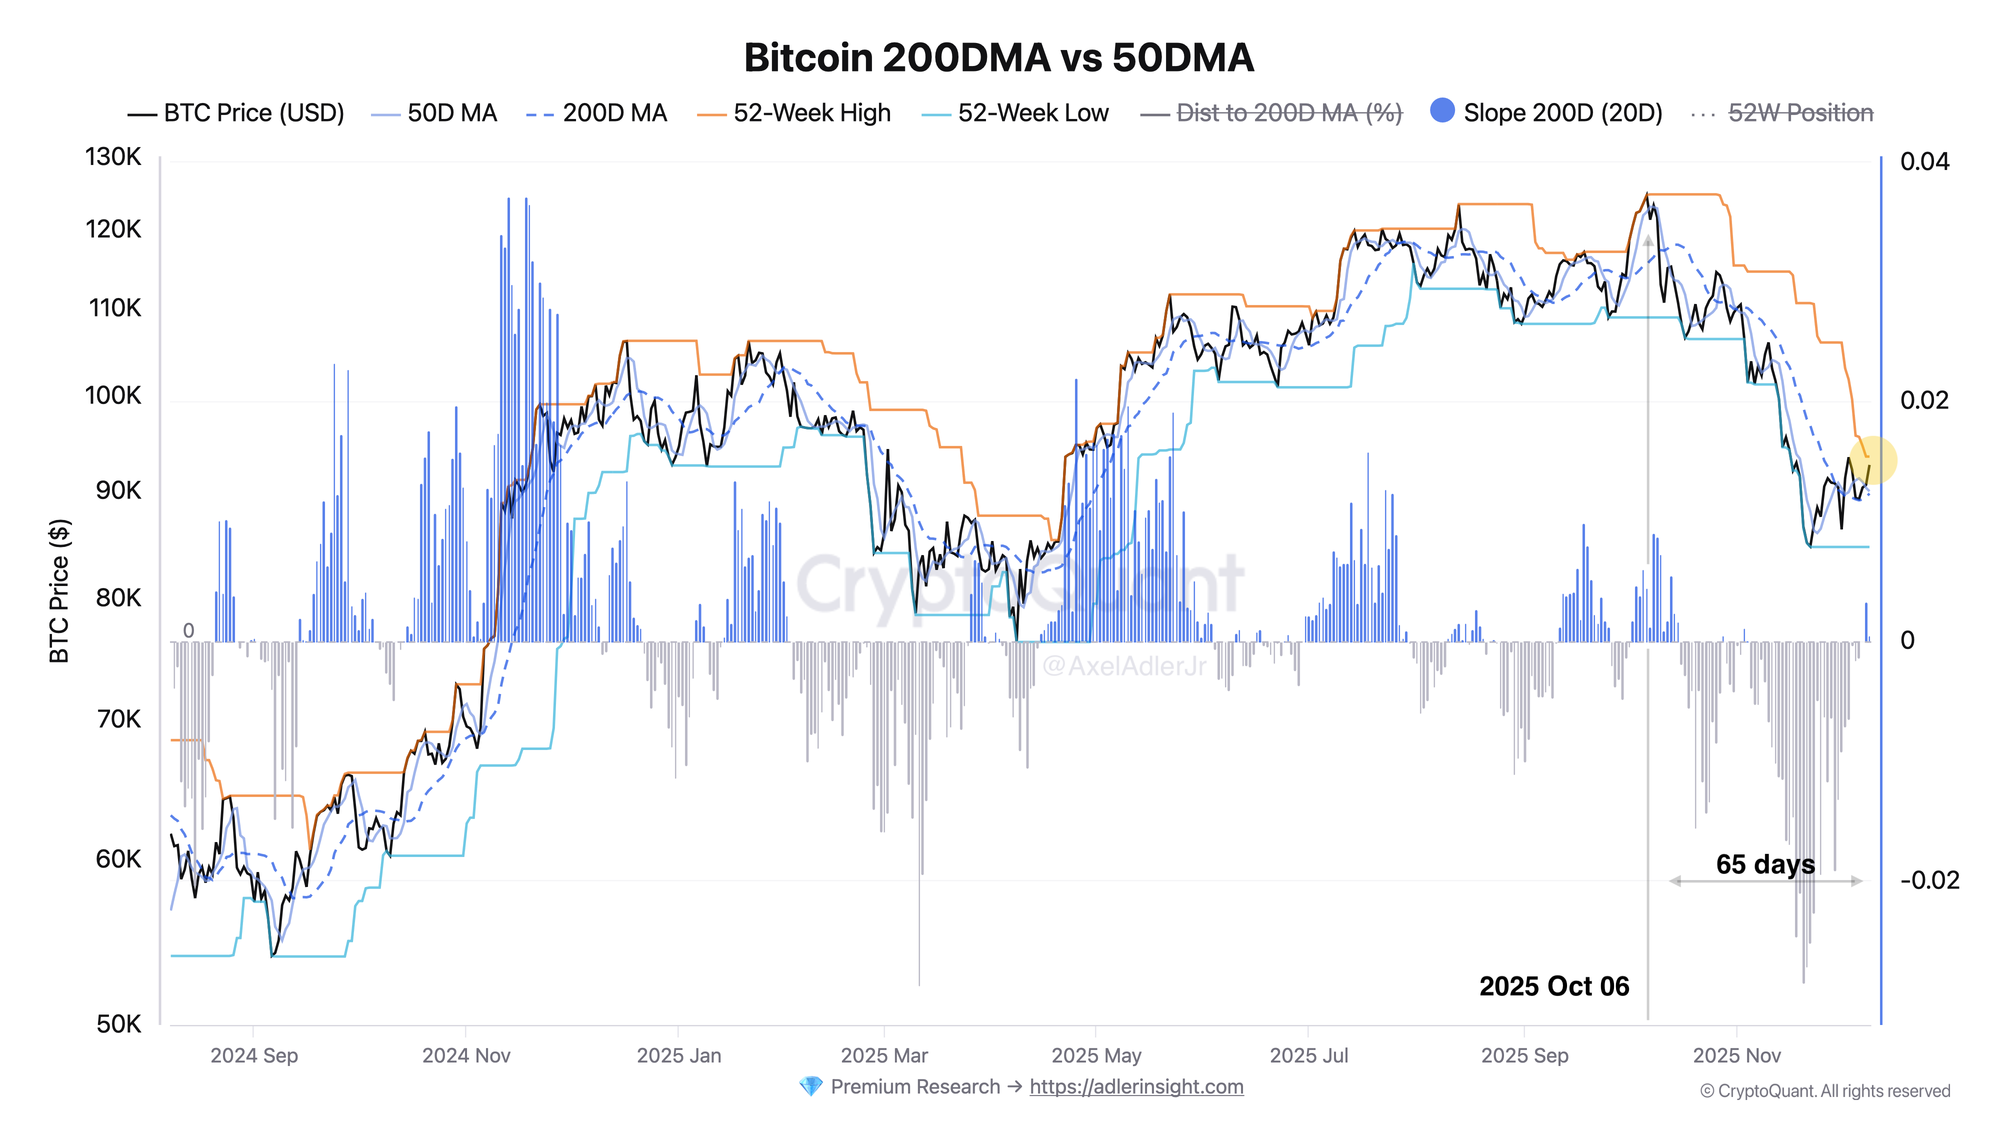
After the October peak, price corrected to the $80K zone, but the last 14 days show a steady uptrend. Key signal - the 200DMA slope (blue bars) turned positive for the first time in a month, indicating restoration of short-term bullish momentum. Price is above both moving averages (50DMA and 200DMA), confirming the trend. 52-Week High (orange line) acts as critical resistance - its breakout will open the path for further growth.
Federal Funds Effective Rate
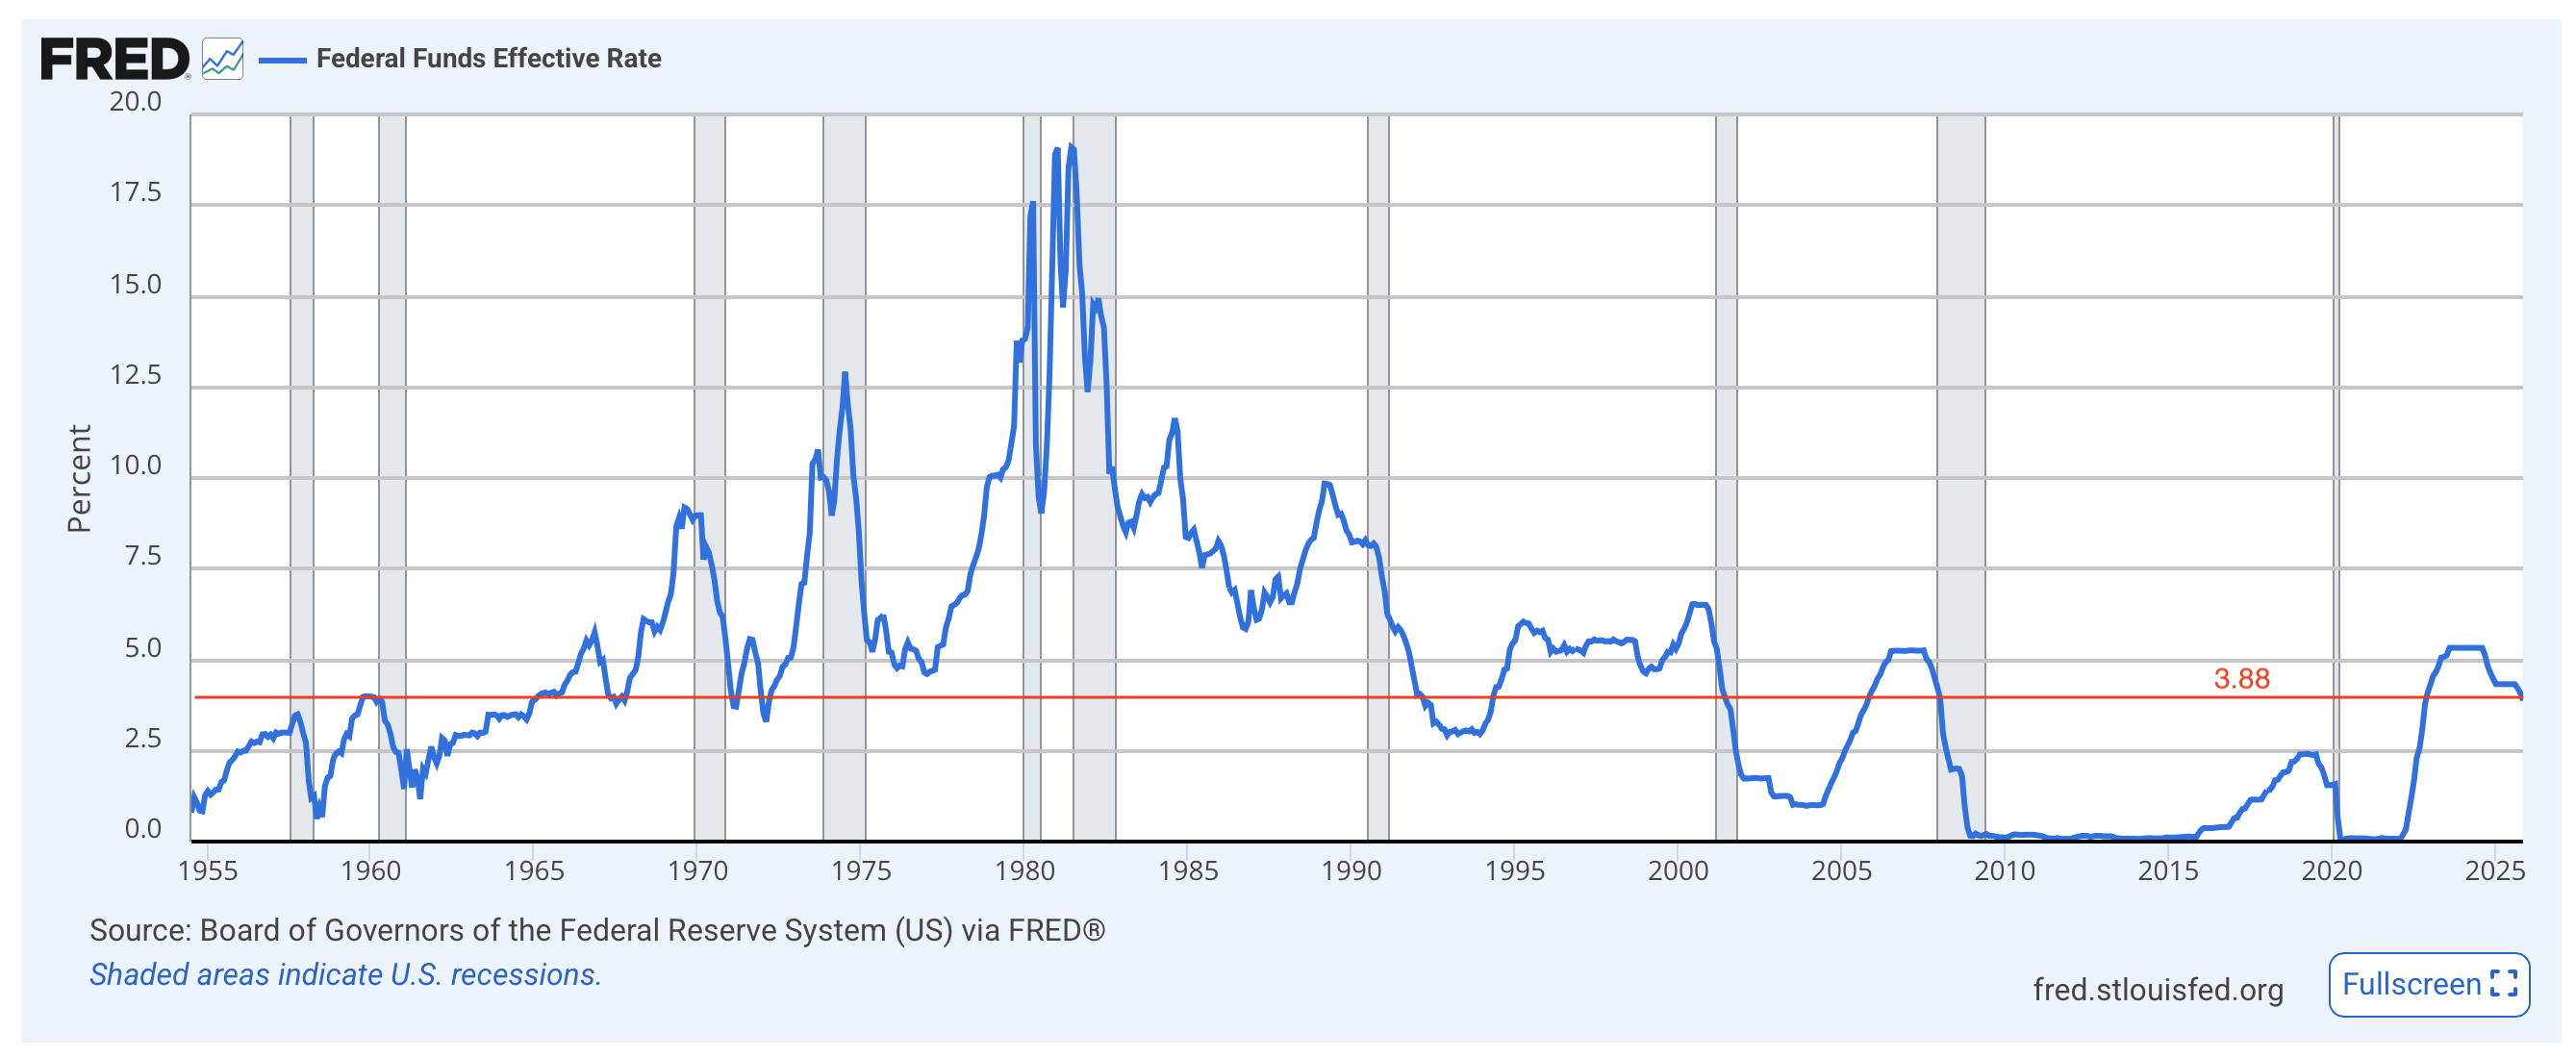
Polymarket prices in 96% probability of a 25 b.p. rate cut - following similar moves in September and October. This could be the third consecutive cut even though regulators are operating with incomplete macro data due to the government shutdown this year. Lowering the rate to the 3.50-3.75% range improves financial conditions and increases risk appetite, which directly supports risk assets.
Water cooler💧talk: Polymarket is betting 93% on a December cut, but the Fed could still wait, the November jobs and inflation data won’t even arrive until after the meeting.
— Axel 💎🙌 Adler Jr (@AxelAdlerJr) December 5, 2025

FAQ
What does the current Bitcoin chart picture mean?
BTC restored its short-term bullish structure after correction to $80K and is now testing the 52-Week High, this is a setup for breakout into a new price range with maintained macro support.
How to interpret Federal Funds Effective Rate signals?
The Fed rate cut in December reduces the cost of capital and improves conditions for risk assets.
CONCLUSION
Bitcoin is in a critical zone: price above 200DMA with positive slope, if market reaction to Fed actions is positive, a 52-Week High breakout will support the local bullish trend and upward movement. Scenario is invalidated with a hawkish Fed policy reversal. Today's focus for BTC is on market reaction to Fed rhetoric.