
🎧 Morning Brief #185 - audio debate on today’s market setup
Price has returned to the February low around $62K and is trying to break below it. Below, only two key cost basis levels remain - the aggregate realized price and the cost basis of long-term holder coins. Together, the two charts show where the market's main defense line lies and how much more painful loss realization has become compared with the winter bottom.
TL;DR
Bitcoin is testing the February low, while the current net realized loss of -$7B is already heavier than it was directly at the February price low. At the same time, it is still below the peak of winter capitulation at -$14B. The key observation - this time, seller pressure is building as price approaches the bottom, rather than fading before it.
Bitcoin Cost Basis
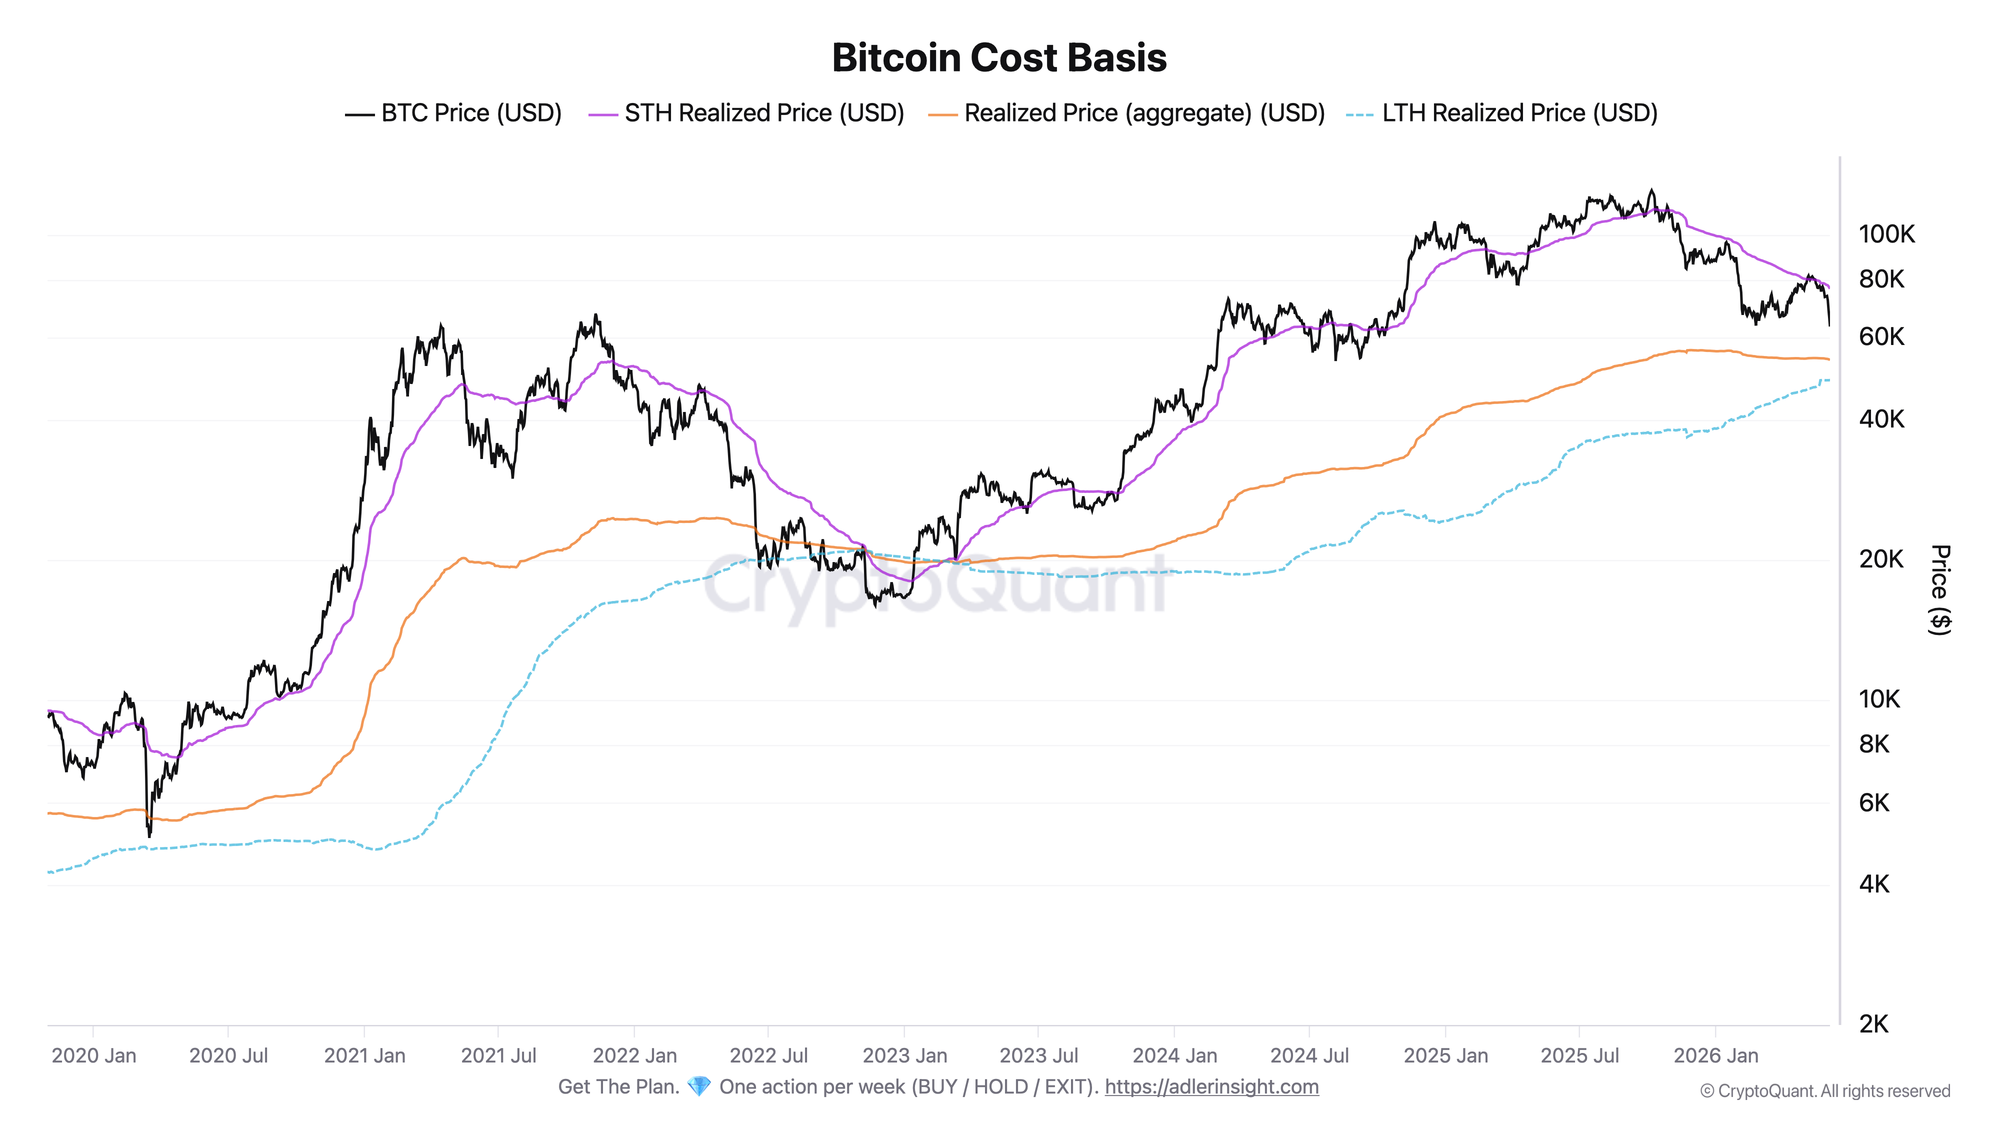
The metric compares BTC price with three cost basis levels: short-term holders (STH), long-term holders (LTH), and the aggregate cost basis of the entire network.
Price in the $63-64K zone is again significantly below the short-term holder cost basis of around $76K. This investor cohort, as in February, remains deeply underwater. But now the market has moved directly to the February low and is trying to break below it, which did not happen during the winter phase.
Below price, only two support lines remain: the aggregate realized price at $54K and the long-term holder cost basis around $49K. These are the levels the market approached in previous cycles during the phase of full capitulation.
As long as price holds above the $54K zone, the market has not yet entered the phase of full capitulation. The deterioration trigger is a break and hold below the February low, followed by a move toward the aggregate cost basis.
Bitcoin Realized Profit / Loss
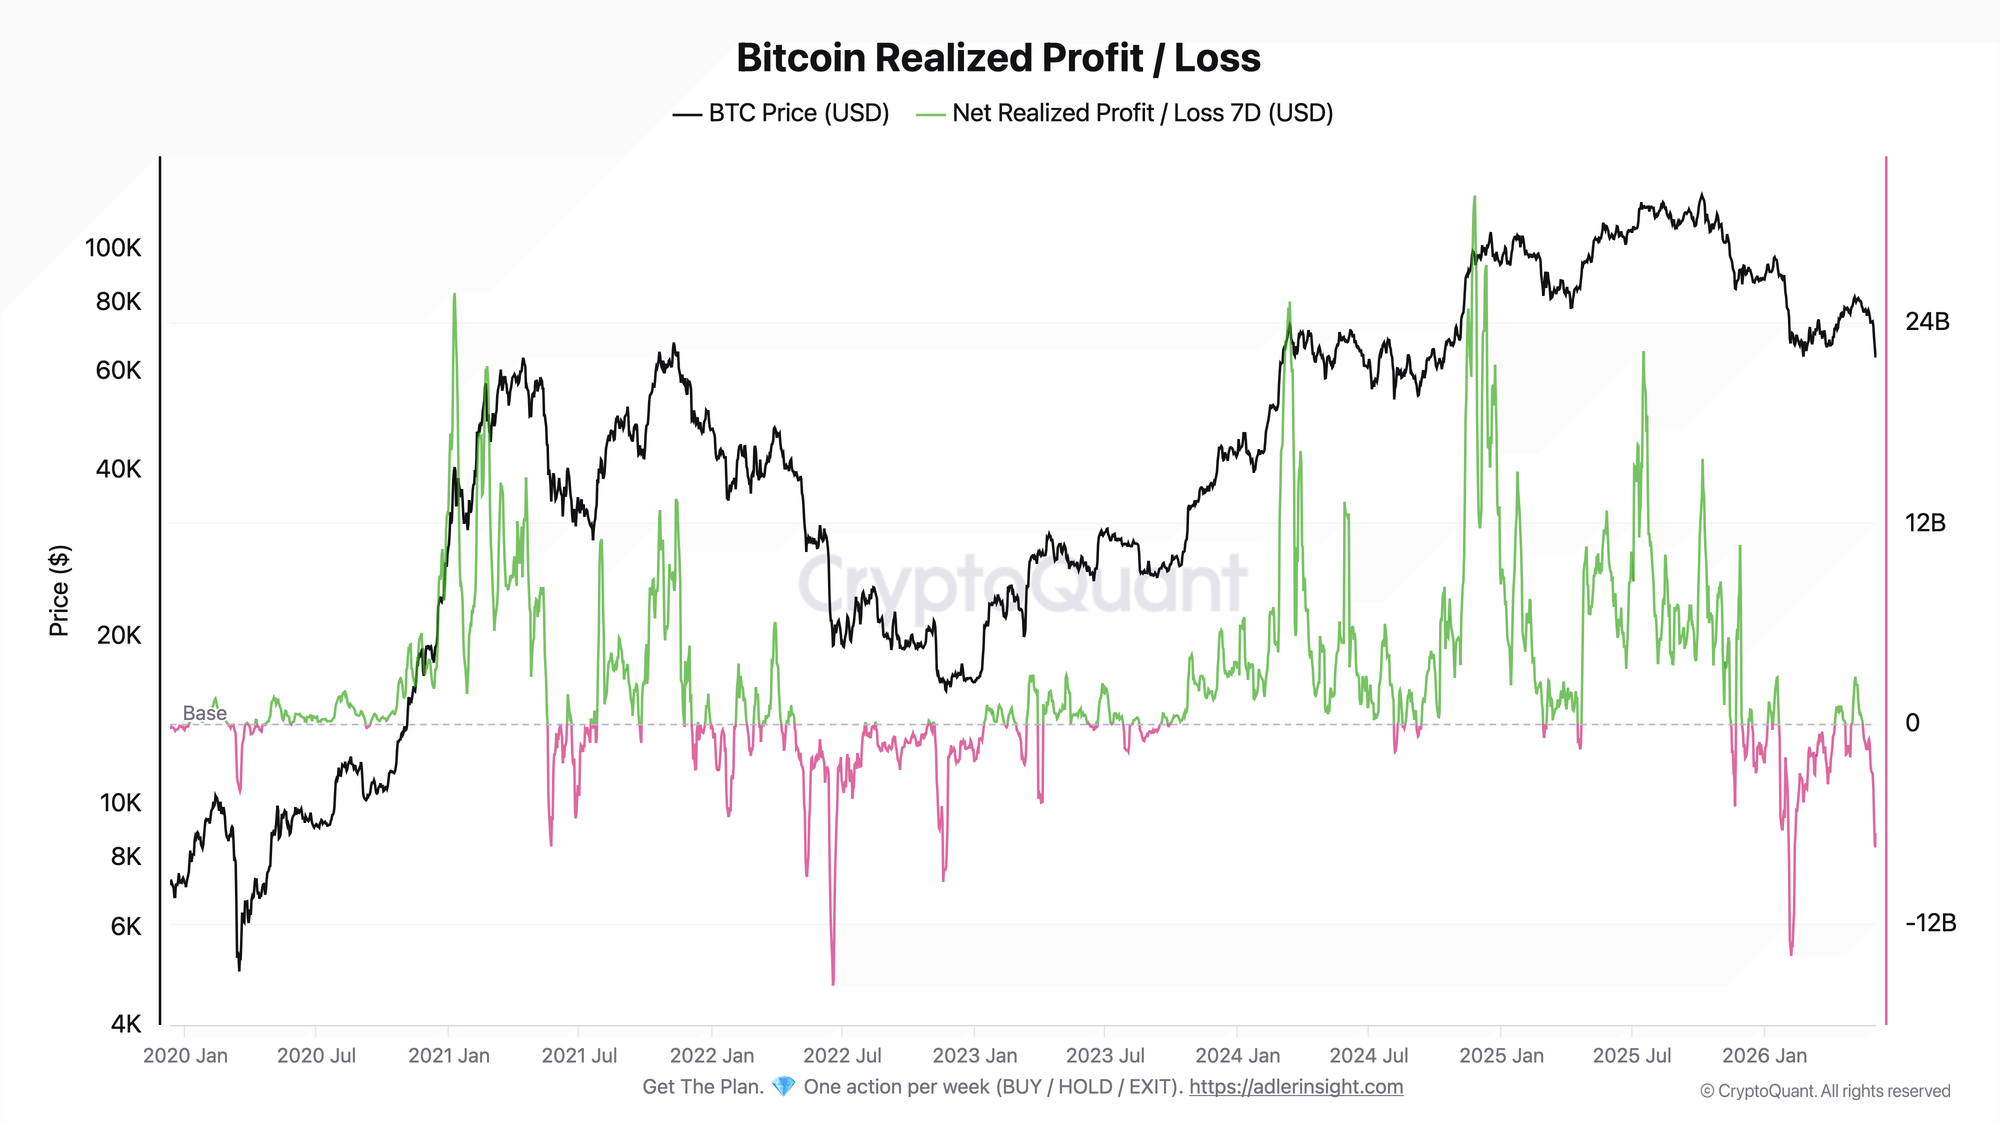
The metric reflects net Realized Profit / Loss over 7 days: the green area shows profit realization, the red area shows loss realization.
Now, in the same price area as in February, net realized loss is around -$7B. This is still below the winter extreme of -$14B, but the key difference is elsewhere: back then, the main wave of panic passed before the price bottom, while now seller pressure is intensifying precisely as price approaches it. In other words, seller pressure is strengthening as price returns to the low, rather than weakening at it. This means capitulation pressure on the current bottom test is still more intense than it was directly at the February low. The market is not giving a signal for a quick rebound "by inertia."
The two-chart setup gives one conclusion: the market is repeating the February scenario and testing a local bottom with heavier loss realization. That is why the key level now becomes defense of the aggregate cost basis zone near $54K.
FAQ
Why are the $54K and $49K levels more important than the current price?
They are the cost basis of the entire network and long-term holders. Historically, price approaching these levels has coincided with the phase of full capitulation and the formation of a cyclical bottom. Holding above them separates a deep correction from the phase of full capitulation.
What would signal a regime change?
The negative scenario is a sustained break below the February low and a move toward the aggregate cost basis. The positive scenario is a return above the February low while realized losses slow down.
CONCLUSIONS
The market is repeating the February scenario, but in a heavier configuration: price is again testing the winter low around $62K, while realized losses near -$7B are already deeper than they were directly at the February price low on February 24. At the same time, they are still below the winter capitulation extreme of -$14B.
The main difference in the current test is that seller pressure is not fading in advance, but is intensifying as price returns to the low. The current regime is risk-off within the cycle: as long as the $54-49K cost basis zone holds, the market is still not in the phase of full capitulation. The main trigger to watch is price behavior at the February low and the dynamics of realized losses. The main risk is a break and hold below this low with a move toward the aggregate cost basis, where full capitulation has historically begun.
Live Charts
Explore the metrics behind this brief with live, auto-updating charts:
Realized Price — Aggregate on-chain cost basis compared with BTC price and long-term trend.
Realized Price Bands — Dynamic realized-price valuation zones from live BTC price and on-chain cost basis.
SOPR — Spent Output Profit Ratio shows whether moved coins realize profit or loss.
STH-SOPR — Short-term holder profit/loss behavior around the 1.0 breakeven threshold.
NUPL — Net unrealized profit/loss across holders, mapped into cycle sentiment phases.