
Over the past 24 hours, volatility has surged to 95%, with liquidations occurring in both directions on the derivatives market.
TL;DR
As long as volatility remains >75% and liquidation spikes continue, further liquidations should be expected.
#Bitcoin #Derivatives #Volatility #Liquidations
Bitcoin Liquidations Index
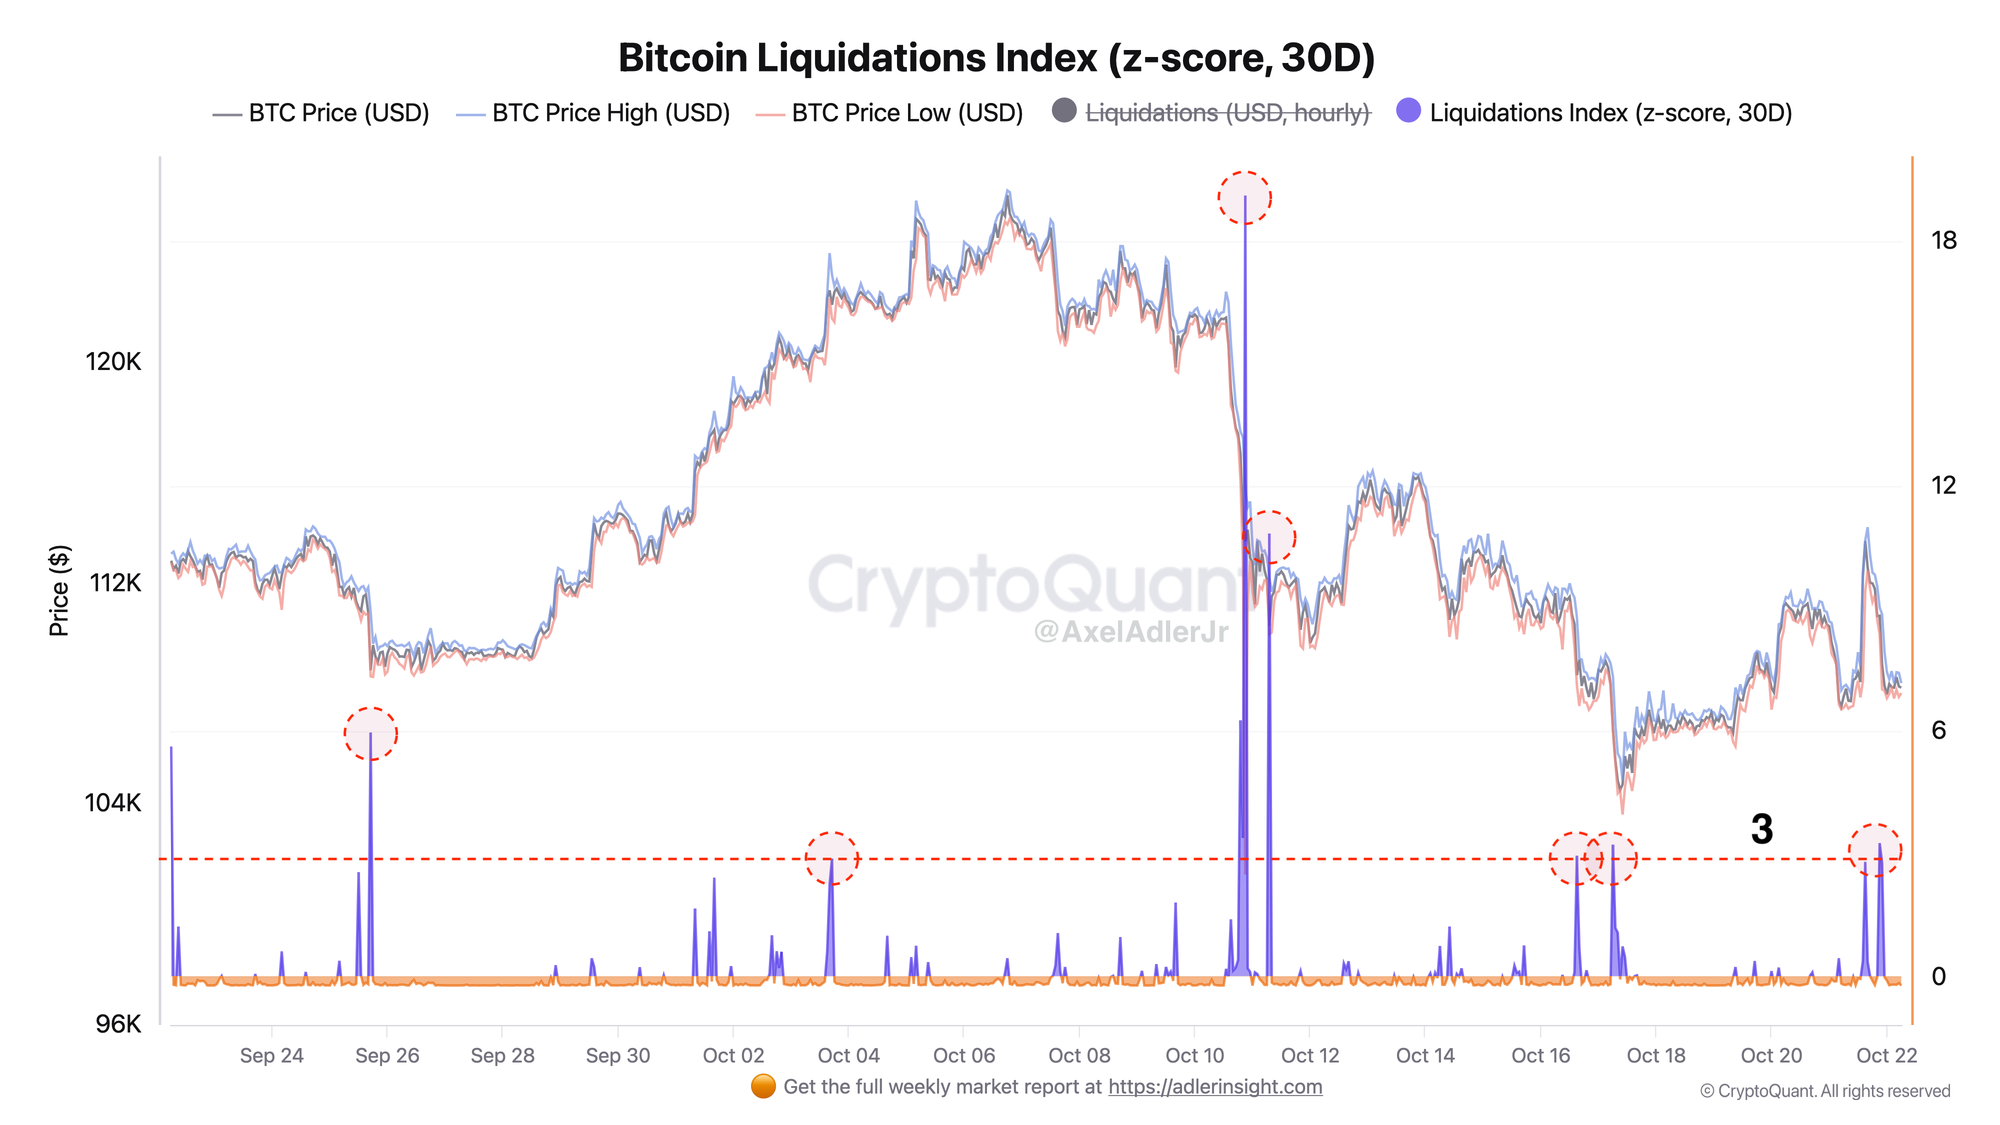
Yesterday, the market experienced sharp movements in both directions—liquidations exceeded 3 sigma, with both long and short positions being liquidated.
The chart displays a series of sharp peaks in the liquidations index, with several repeated spikes at the same level following the extreme. These are signs of elevated risk with a series of cascading liquidations in both directions.
The threshold value for the index is marked by a red dashed line at the 3-sigma level (benchmark for stress conditions). It is necessary to monitor the frequency of peaks, their amplitude, and price reaction to repeated spikes.
Bitcoin 24h VWAP & Volatility Index
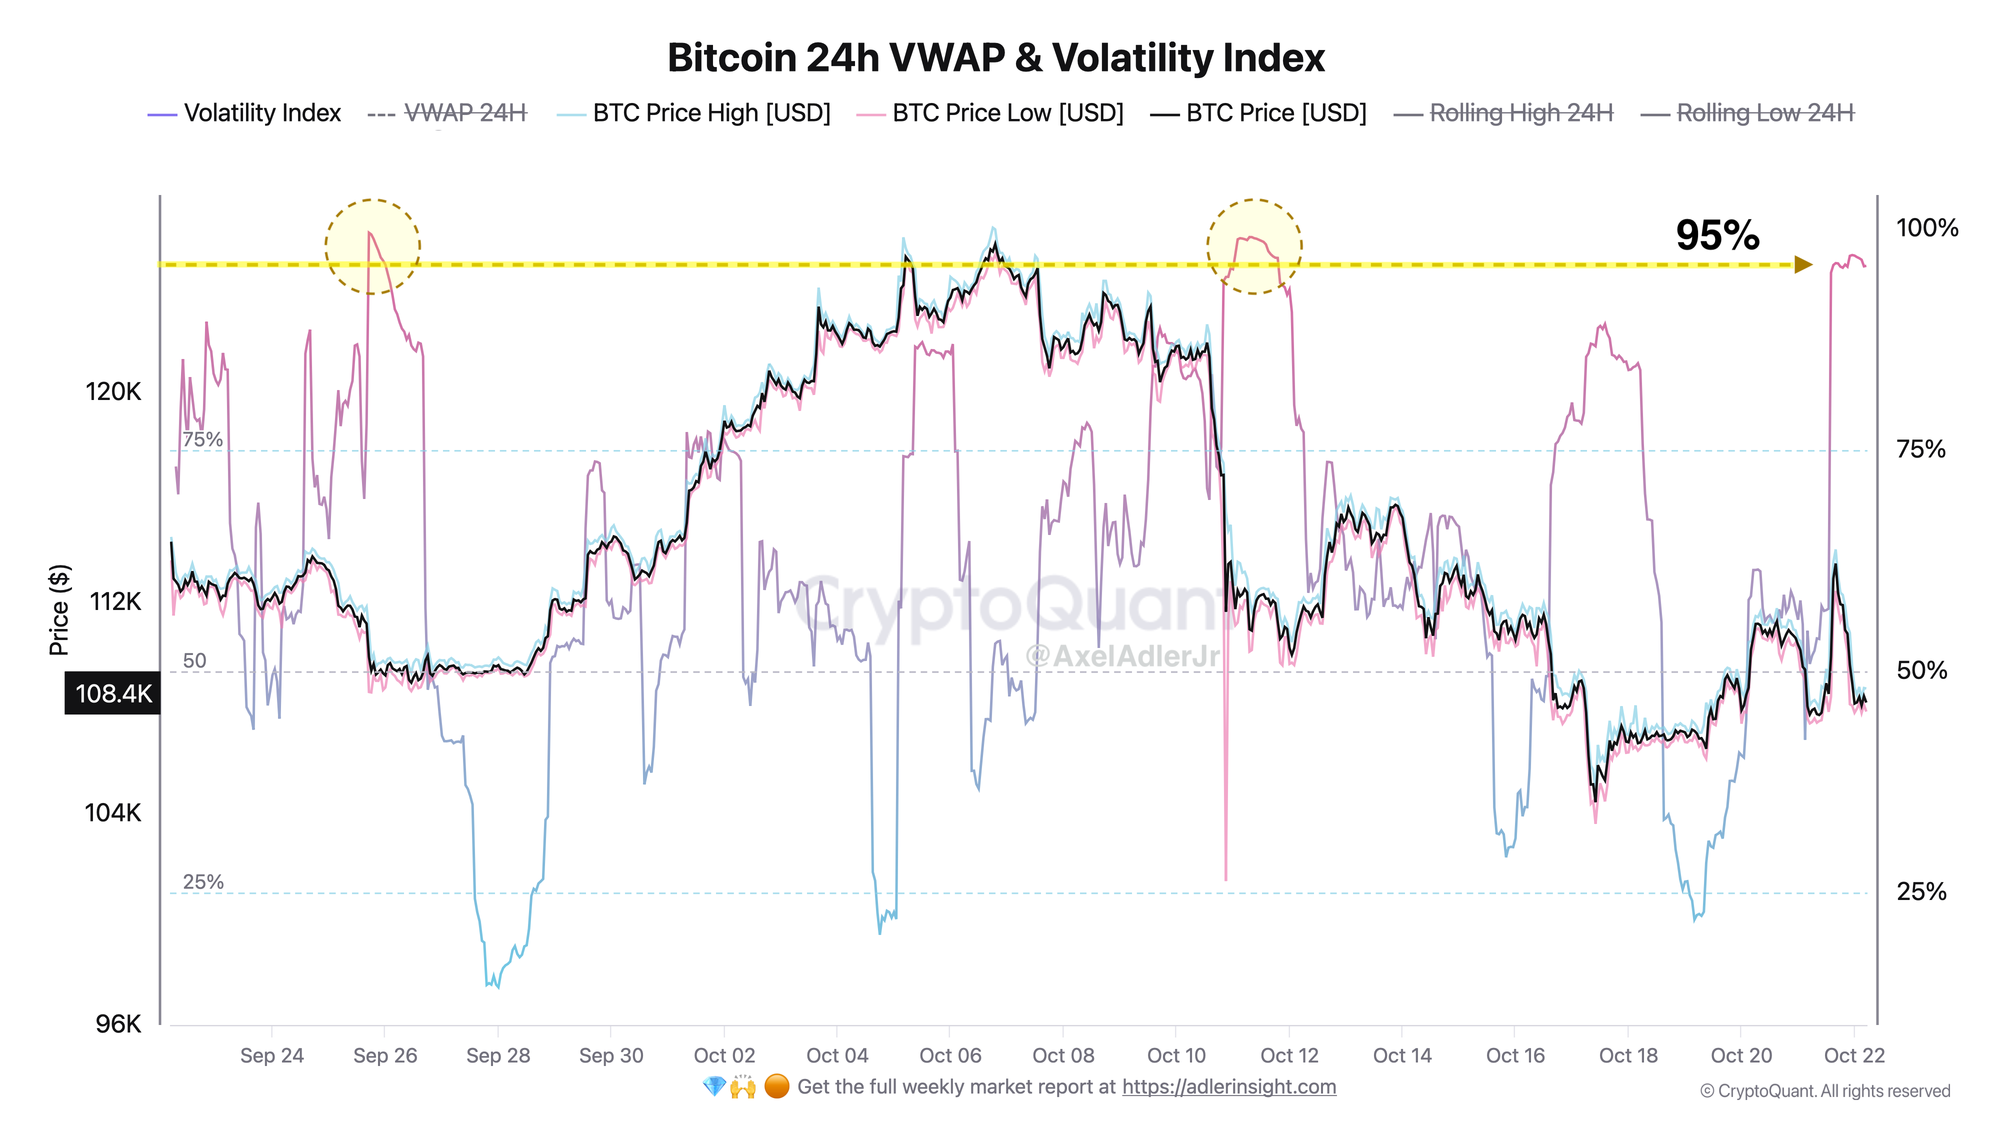
The volatility index has risen above 95% for the third time this month. Essentially, this is a zone of sharp liquidations that are currently occurring in the market and reflected in the previous chart.
Currently, price is oscillating between daily boundaries of $107K and $113K, touching the Rolling High/Low 24h and forming wide tails. As long as liquidation peaks continue, volatility remains elevated, and the market maintains a forced position closure regime.
The key filter is declining volatility: falling values <50% will confirm normalization and enable a quality breakout.

FAQ
What does the current picture on the Bitcoin Liquidations Index chart indicate?
The market is in a phase of stress-induced forced position closures: a series of liquidation peaks at the same level. As long as amplitude and frequency remain high, sharp one-to-two-hour movements prevail.
How should Volatility Index signals be interpreted under current conditions?
With volatility >75%, liquidations in both directions will dominate the market.
CONCLUSIONS
Base case scenario: oscillations within the $107–113K range with wide tails. For a sustained trend to form, a breakout above $114K on declining volatility is required, or consolidation below $107K on a liquidation impulse. Scenario invalidation: stable decline in volatility toward 50% and successful retests of range boundaries.