
The derivatives market continues to register a shift in pressure toward bulls, with the liquidation dominance oscillator sitting at 32%, reflecting sustained pressure on leveraged buyers.
TL;DR
The November BTC correction has been accompanied by a series of large long position liquidations. The current dominance reading of 32% is one of the highest in three years, indicating persistent risk of further local lows.
Bitcoin Futures Long Short Liquidations Dominance
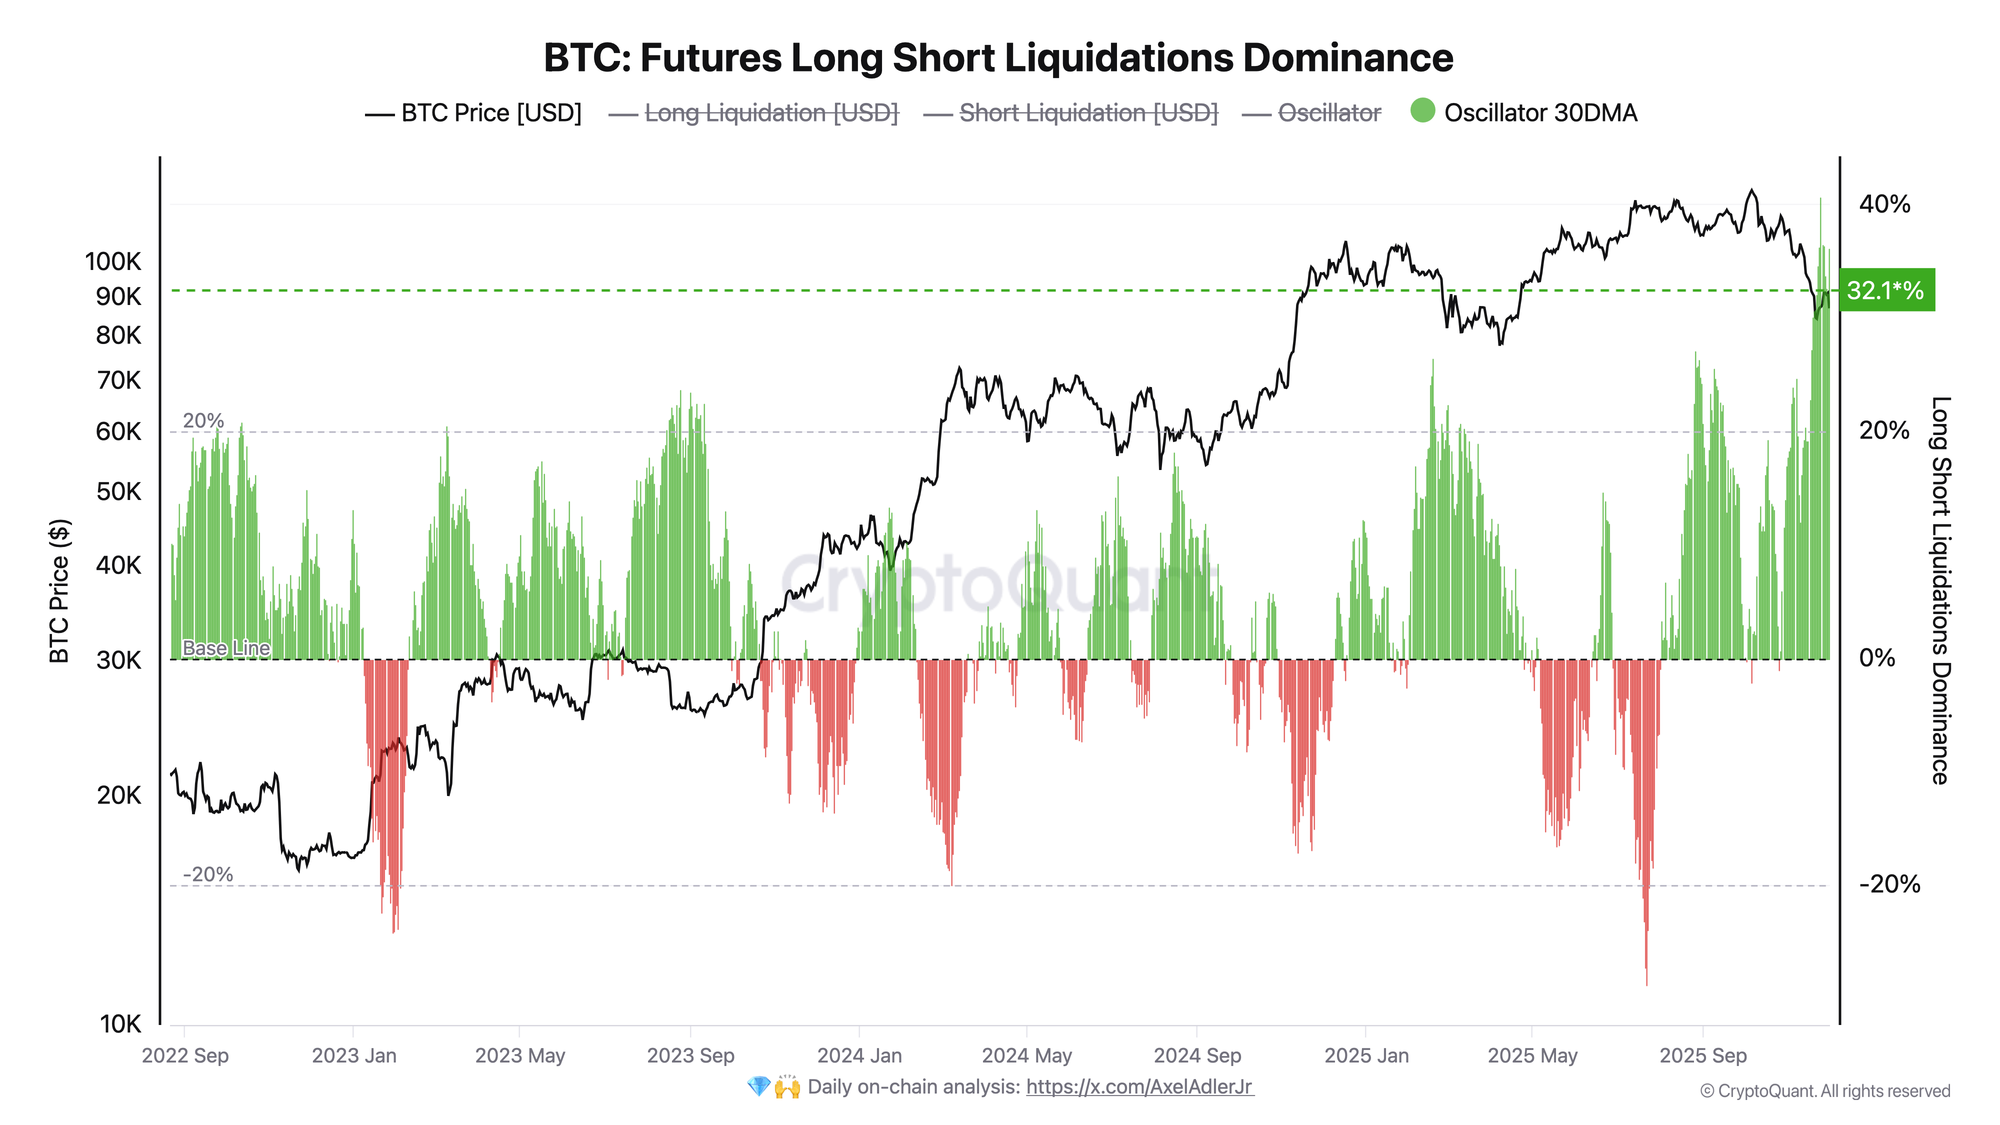
The indicator shows the ratio between long and short position liquidations in the derivatives market. Positive values (green bars) indicate a predominance of long liquidations, while negative values show dominance in short liquidations. The current reading of 32% is one of the highest over the past three years.
Bitcoin Long Liquidations USD
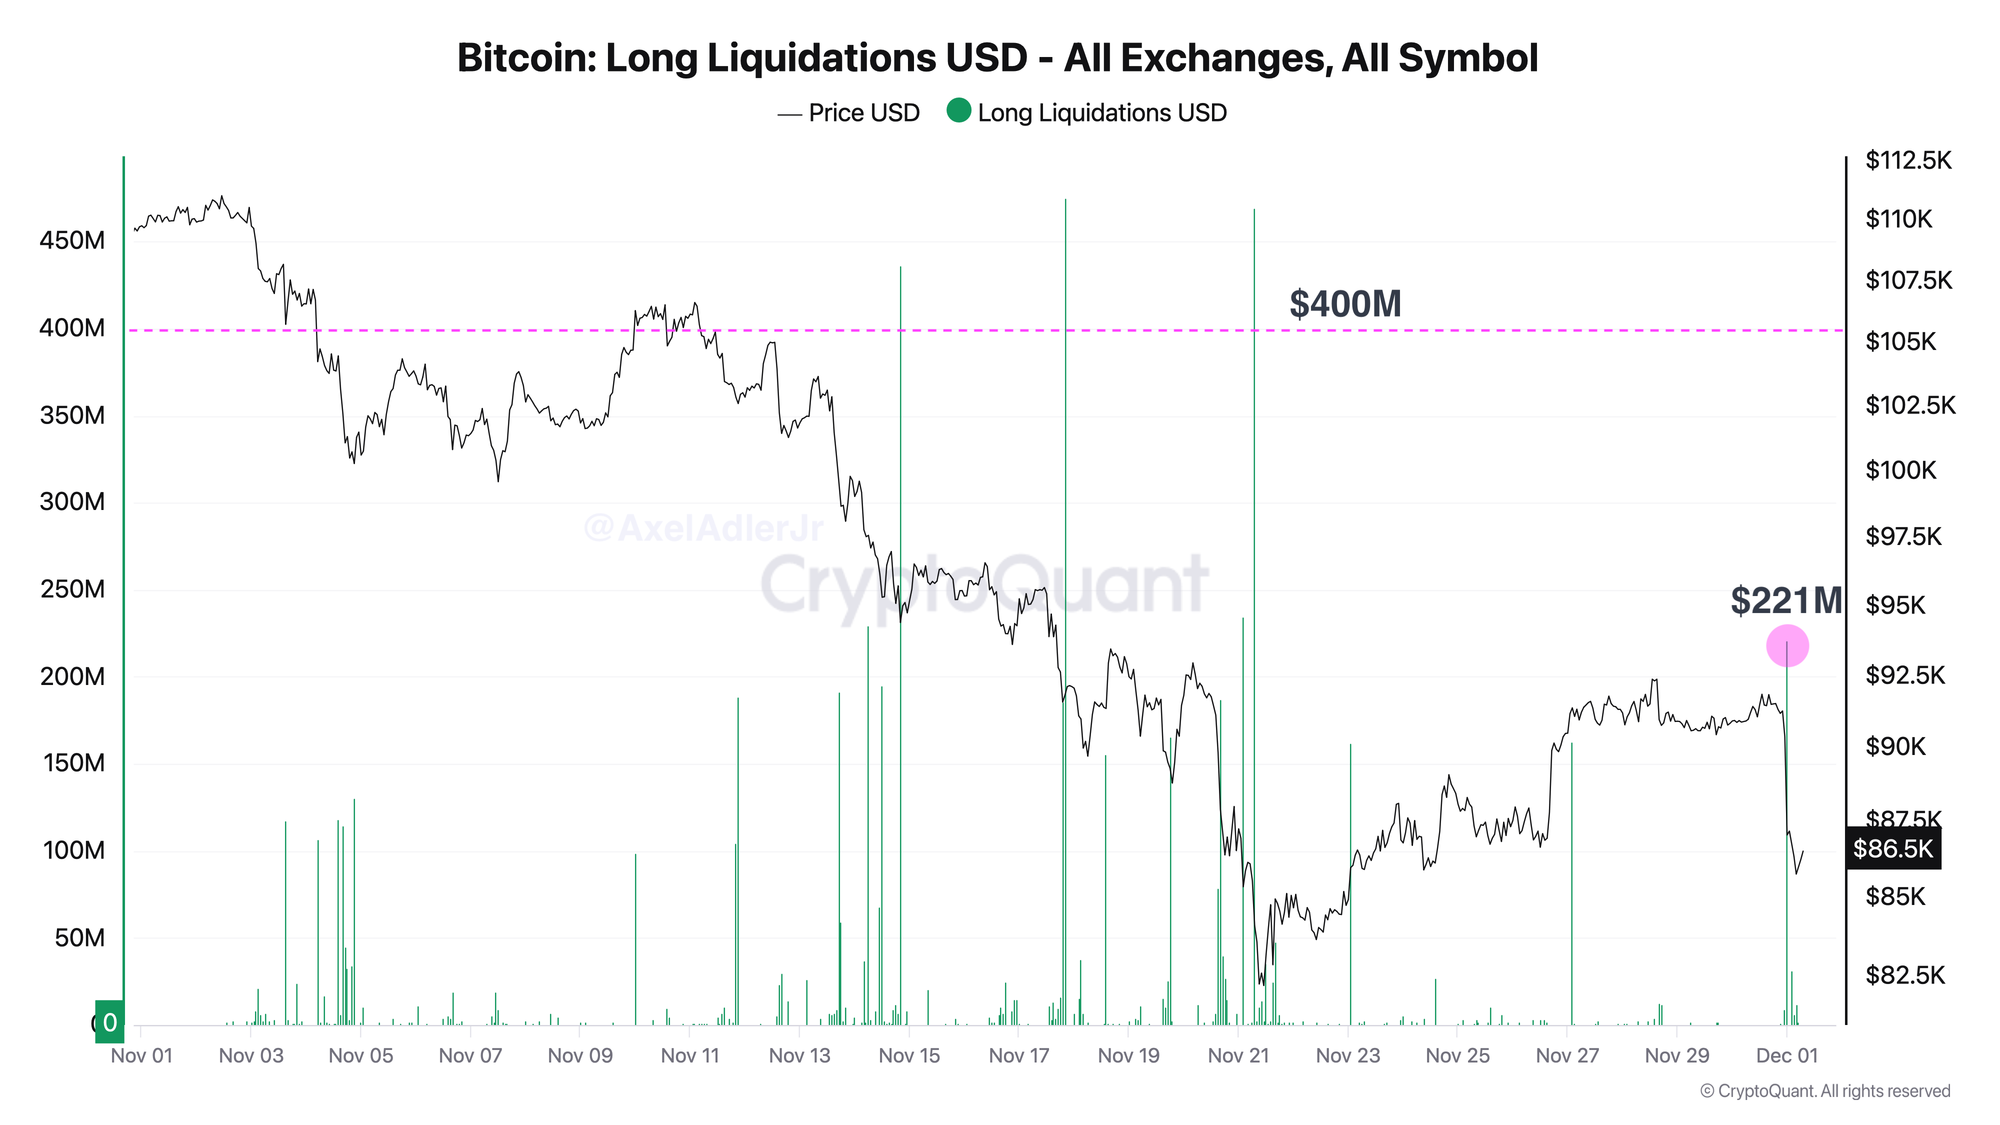
November recorded three waves exceeding $400M in bull liquidations, each coinciding with an acceleration in price decline. The current liquidation of $221M occurred during the market's attempt to recover, with the leading cryptocurrency pulling back to the $86K level, erasing most of last week's gains.

FAQ
What does the current picture on the Liquidations Dominance chart indicate?
The 32% reading shows that over the past 30 days, long liquidations have significantly outweighed short liquidations - an indicator that leveraged buyers remain under pressure.
How should the Long Liquidations chart signals be interpreted in today's context?
The $221M volume is significant but not extreme; today's wave of new liquidations is a sign of continued bearish pressure.
CONCLUSIONS
The current liquidation structure indicates that the market remains under pronounced bearish pressure. The latest $221M liquidation was accompanied by a sharp pullback in Bitcoin to the $86K level, signaling persistent risk of further local lows being tested.