
The Bitcoin market is in a phase of sustained capital outflow. Despite a positive daily net flow on December 25, the 7-day moving average remains in negative territory (−$160M) - this means that participants are collectively realizing more losses than profits. Capital is leaving the network through loss-making sales.
TL;DR
This brief confirms the continuation of a negative capital flow regime: the weekly average in negative territory indicates that loss-making sales outweigh profitable ones. Until the 7dMA reaches zero, the market remains in a risk zone.
Bitcoin Net Capital Flows
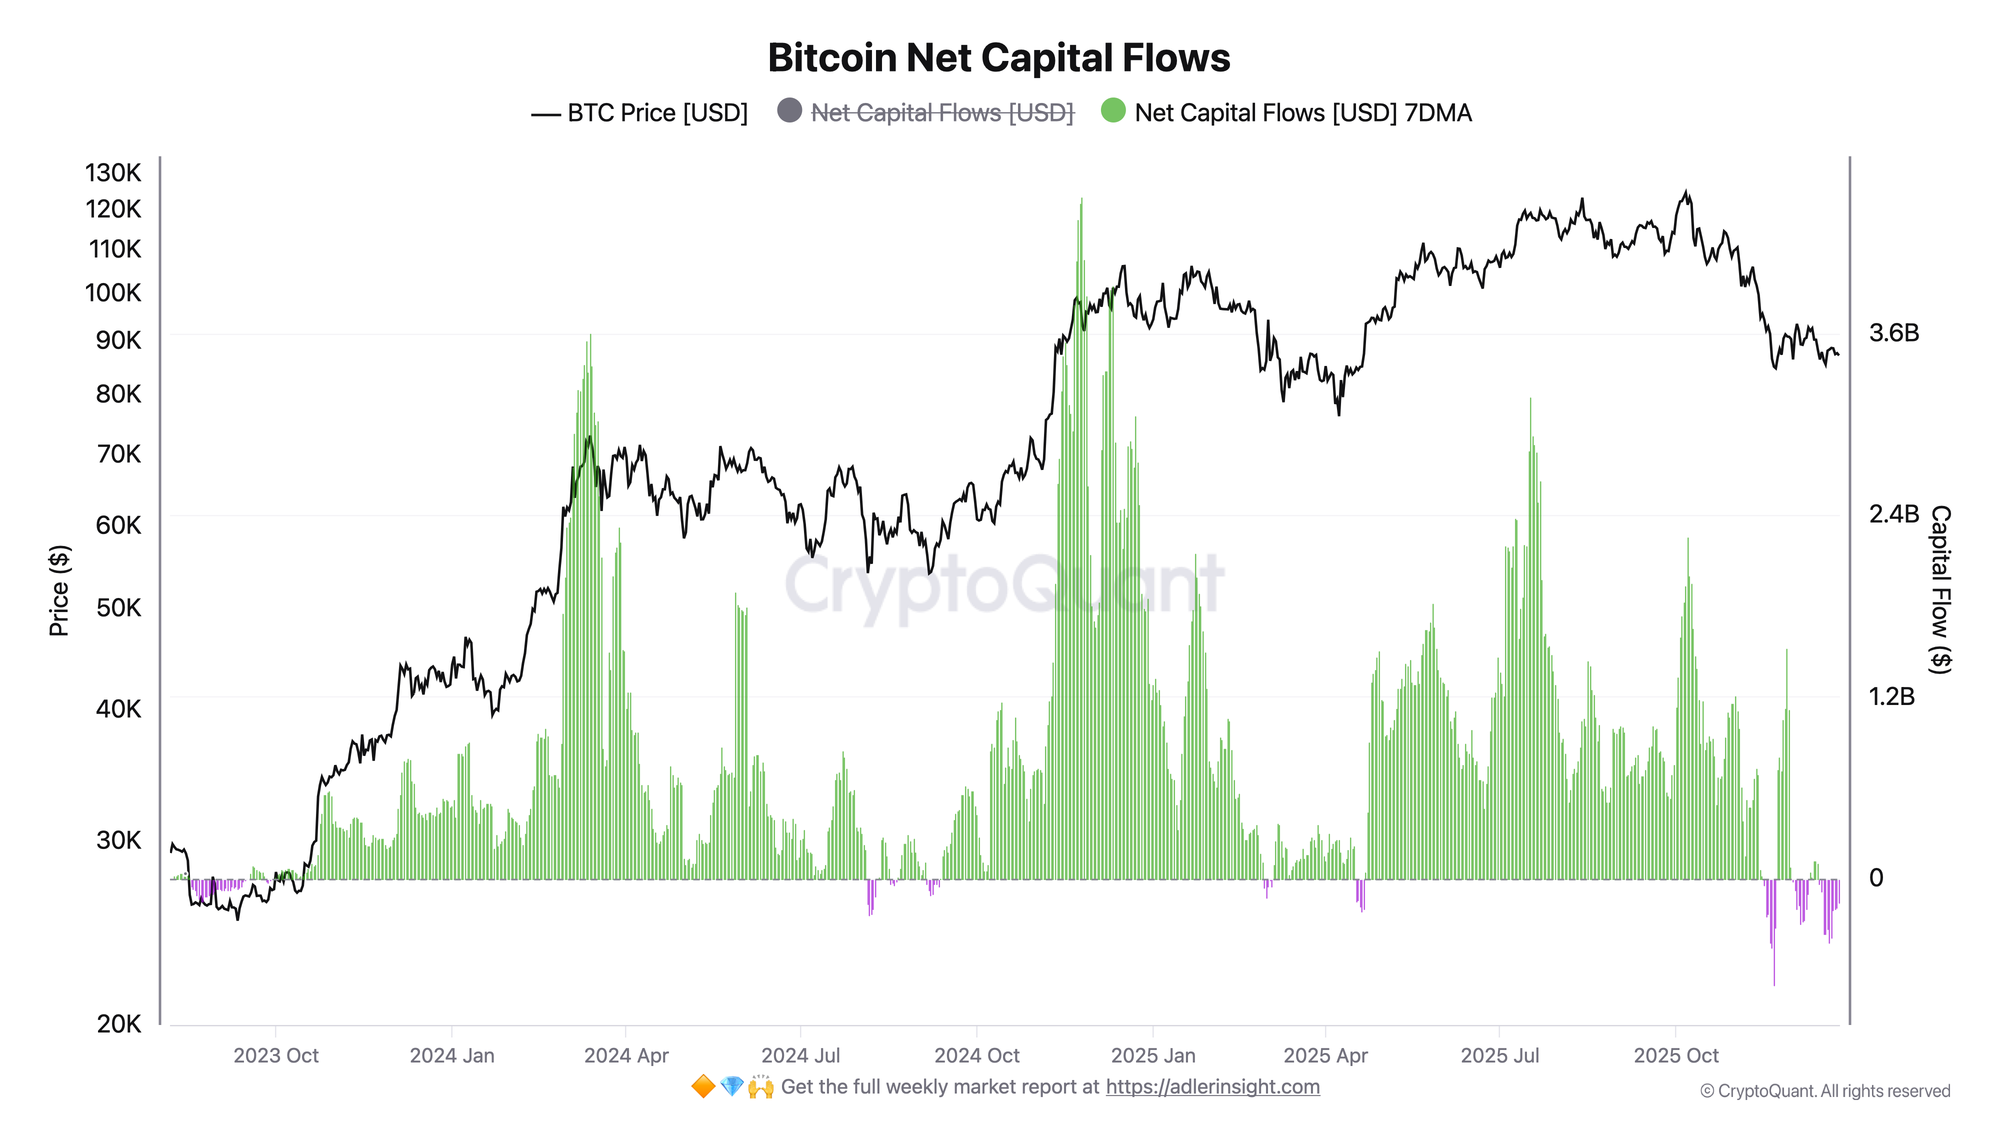
The metric reflects the difference between realized profit (capital inflows) and realized losses (capital destruction). When net flow is negative, network participants are collectively selling at a loss more than they are taking profits - capital is not flowing in, but being withdrawn through losing positions.
The current 7dMA at −$160M signals: over the past week, on average, the market lost $160M in capital per day due to loss-making sales. The period of December 17–24 was characterized by high flow volatility: large outflows on December 20 (−$655M), December 23 (−$136M), and December 24 (−$459M) alternated with positive days on December 21–22 (+$98M and +$87M). The positive flow on December 25 (+$82M) is the third positive day in the last five sessions, but this is insufficient to reverse the weekly average.
A negative 7dMA is a bearish signal. It indicates stress in positioning: participants are forced to sell at a loss, demand does not compensate for supply. Until the weekly average reaches at least zero, the regime remains risk-off. The trigger for improvement is a series of days with positive net flow without large drops between them, which would turn the 7dMA upward.
Bitcoin % Supply Active (Last 180 Days)
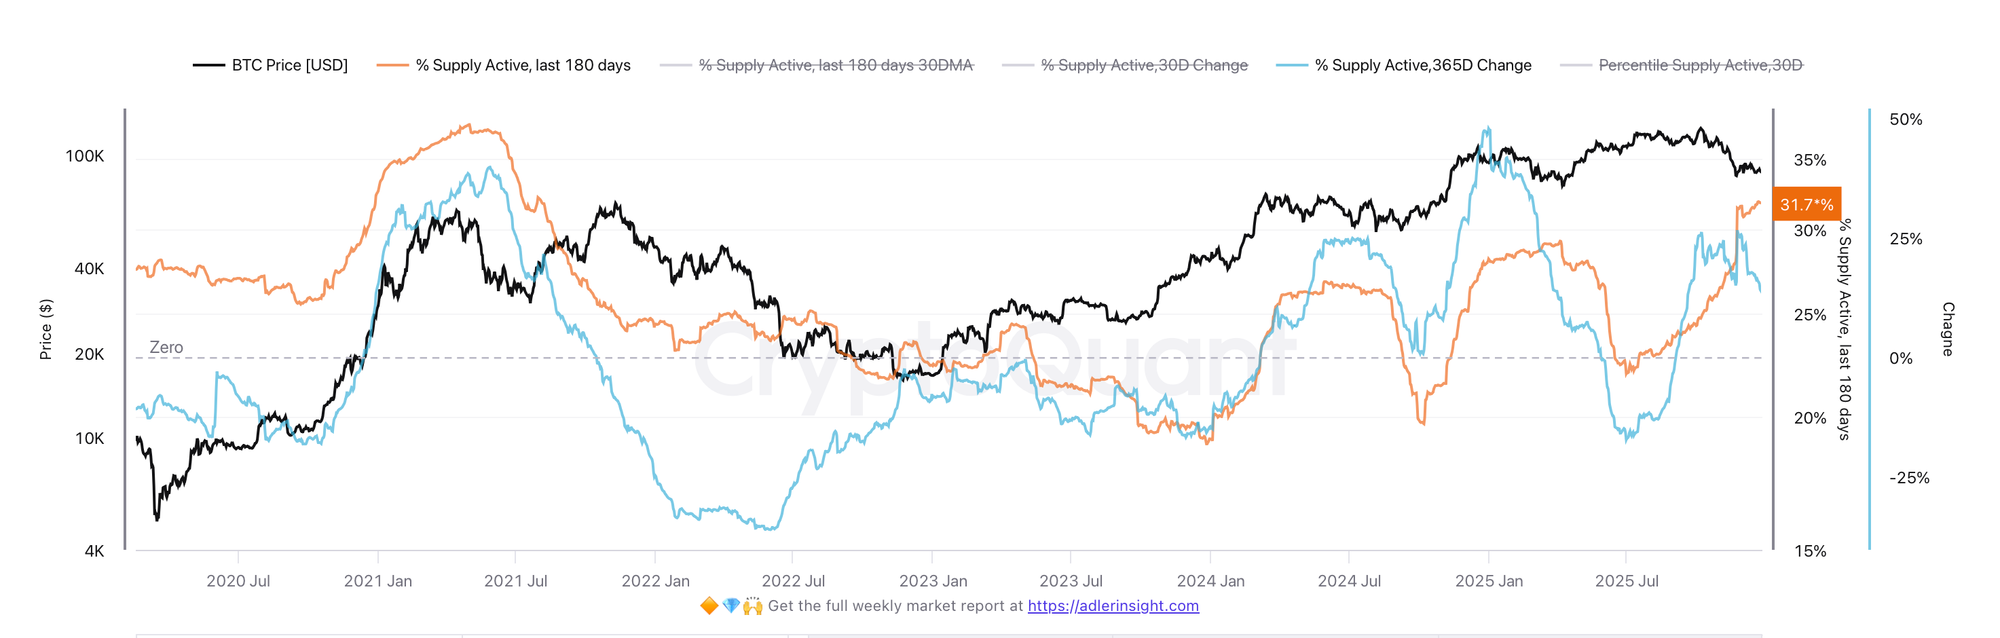
The metric shows what portion of total BTC supply has been active (moved) over the past six months. The current value is 31.79%, which is above the 30-day average (31.43%). The indicator is at the 80th percentile relative to historical data - activity remains elevated. The year-over-year increase is +14.4%, meaning coins are moving significantly more frequently compared to last year.
High activity combined with negative net capital flow is a warning signal. This means coins are actively moving, but the majority of these movements are loss-making sales. The market is not in apathy - on the contrary, active distribution is underway. Holders are exiting positions, not accumulating. A positive signal would be sustained high activity alongside a reversal of the 7dMA net flow to zero - then movements would indicate accumulation rather than capitulation.

FAQ
What does negative net capital flow mean?
It means that aggregate losses from sales exceed aggregate realized profits. Simply put, more people are selling below their purchase price and losing money. Capital is not flowing into Bitcoin but is being withdrawn through losing trades.
When will the regime shift to neutral or positive?
The minimum condition is for the 7-day average net flow to reach zero and hold above it. This would mean that profitable and loss-making sales have balanced out and selling pressure has lifted. Until then, the market remains vulnerable to continued decline.
CONCLUSIONS
The Bitcoin market is in a phase of capital outflow through loss-making sales: the 7-day average net flow remains at −$160M, indicating a sustained excess of realized losses over profits. The period of December 17–24 recorded alternating large outflows (up to −$655M) and moderate inflows, but positive days failed to compensate for the drops. High supply activity (80th percentile) under these conditions reflects not accumulation but ongoing distribution with loss realization. The current regime is risk-off. The main trigger for a regime change is the 7dMA reaching zero, the main risk is a resumption of large daily outflows, which would deepen the phase of capital stress.