
UST yields have dropped to six-month lows, gold holds at $4,362, while Bitcoin tests the $106–107K support zone.
TL;DR
Investors have shifted into defensive mode: 10-year UST yields declined to 3.95%, TIPS real yield to 1.70%, and VIX volatility surged to 25. Against this backdrop, gold hit a new all-time high, while BTC holds the critical $106–107K zone, coinciding with STH Realized Price and 200D SMA. Financial flows are shifting toward safe-haven assets.
#Bitcoin #Gold #UST #TIPS #VIX
US 10-Year Treasury Yield

The yield has fallen to April lows - a clear sign of a shift to defensive mode.
Investors are moving into Treasuries, pushing yields down, which reflects growing demand for safety and expectations of an imminent Fed rate cut.
10-Year TIPS Yield (Real Yield)
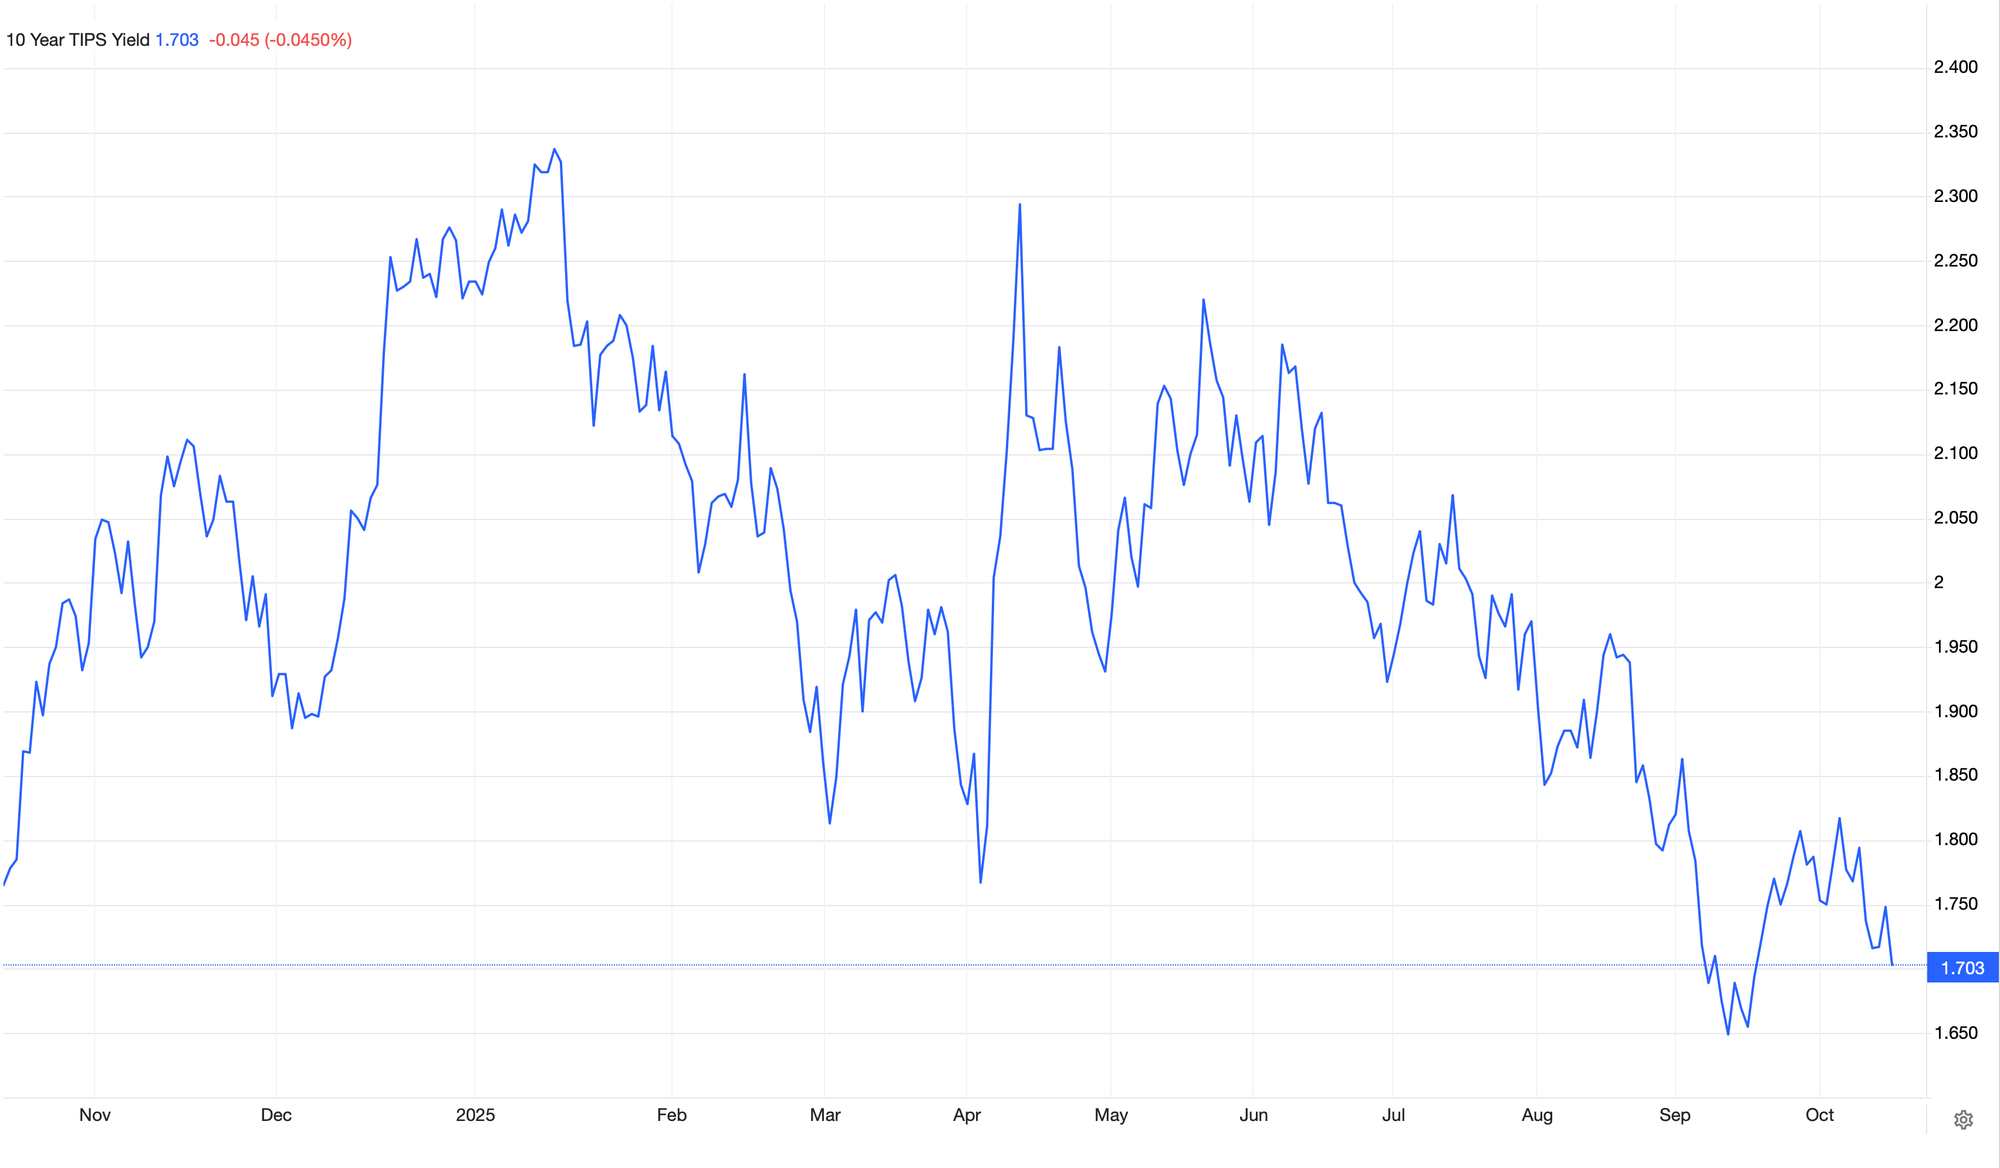
Real yield - the primary indicator of capital cost has dropped below 1.8% for the first time since May.
This is liquidity-positive: declining real yields reduce the discount rate for risk assets and support gold and growth stocks. However, with VIX >20 the signal remains mixed - short-term risk-off outweighs the effect of low rates.
GOLD
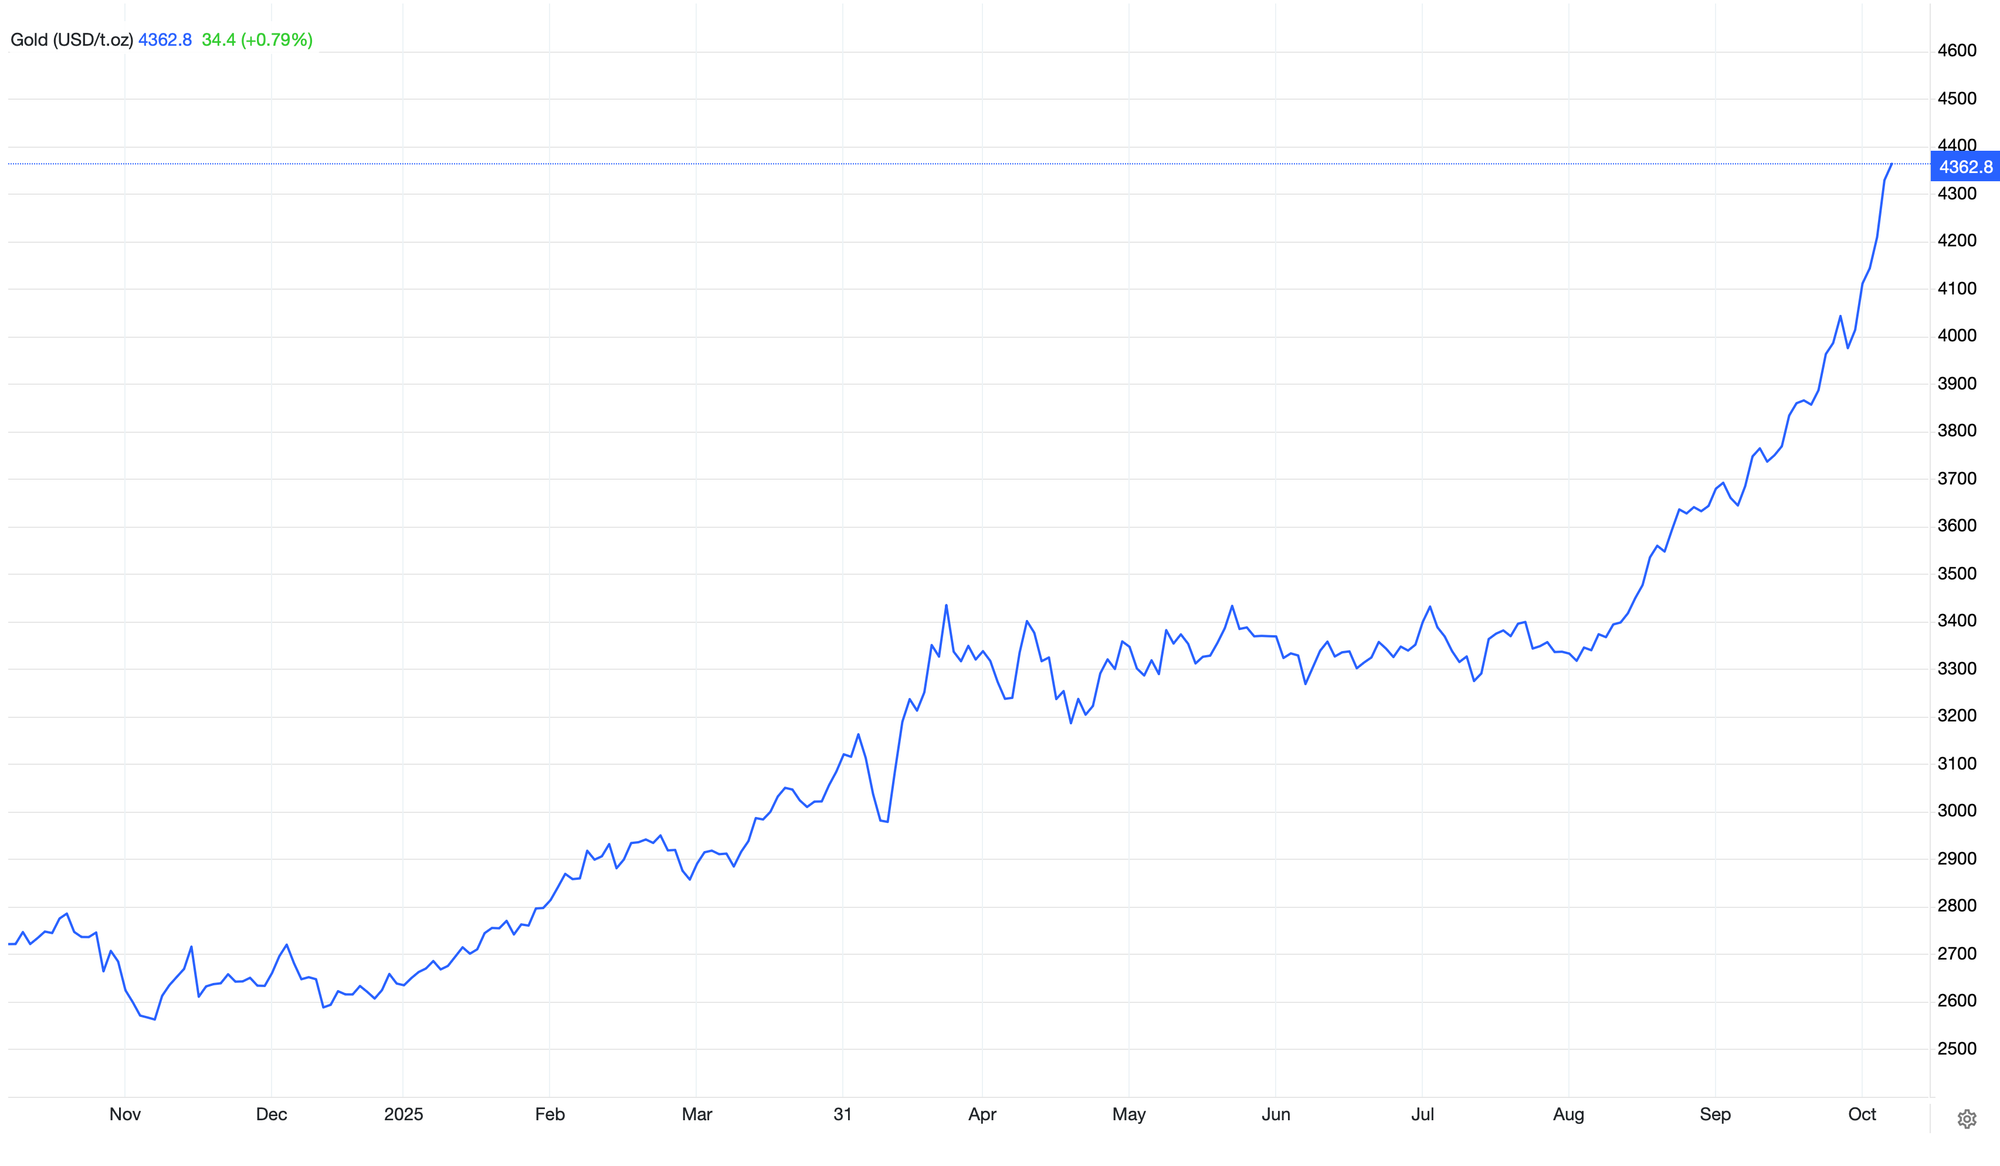
Gold has consolidated at $4,362, posting its strongest weekly gain in nine weeks.
The rally is driven by renewed trade tensions between the US and China. Against the backdrop of a weakening dollar and falling yields, gold is gaining strong momentum as a key safe-haven asset.
Volatility Index (VIX)
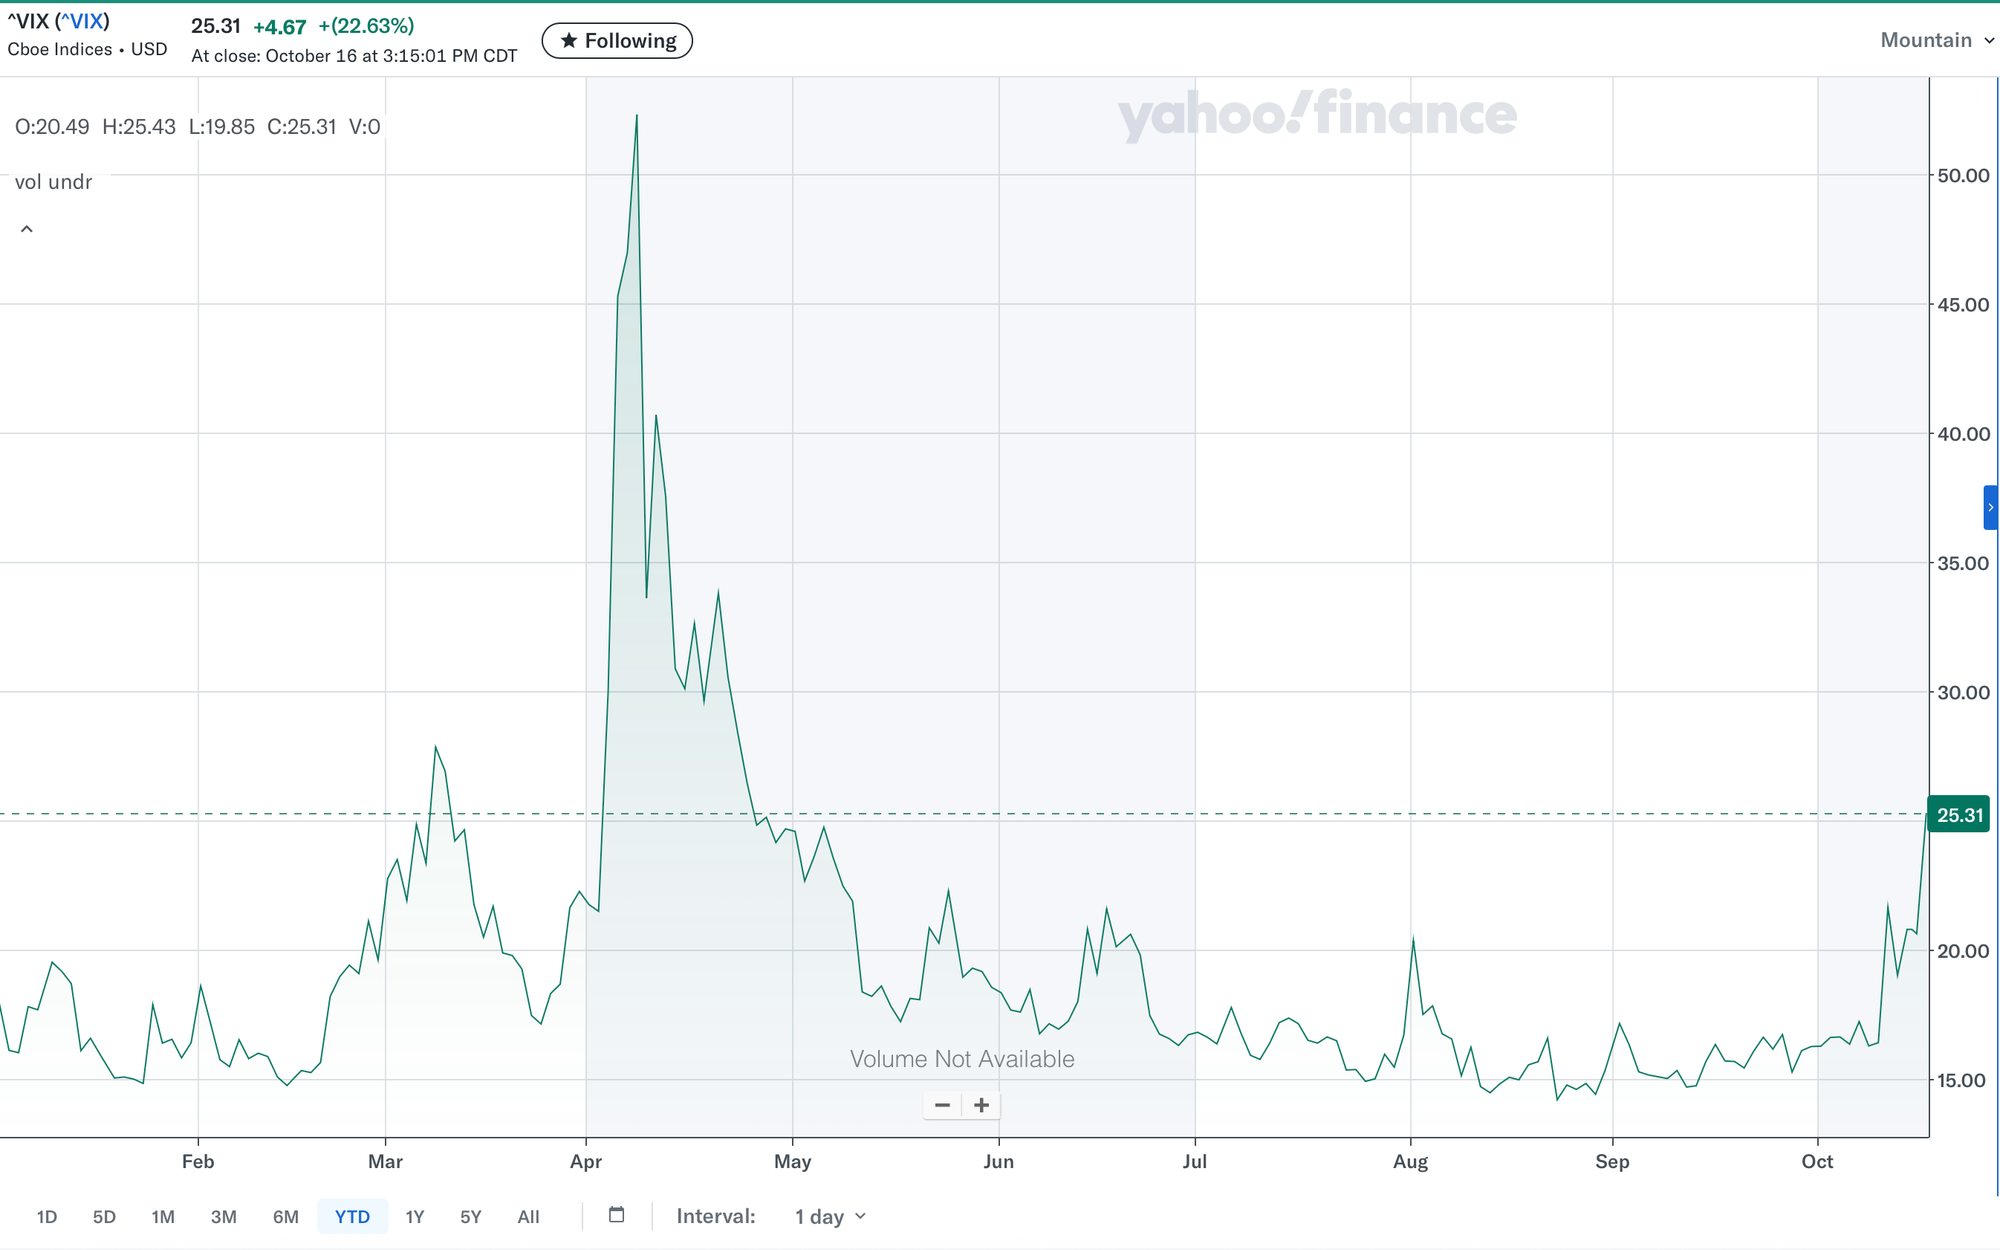
Volatility surged by 22% in one day and settled above 25 - a clear alarm signal in the market. Investors are seeking to protect their capital and rotating into safer assets such as gold and bonds.
Bitcoin Support and Resistance

Bitcoin is holding the $107K support zone, where STH 3M–6M RP and 200D SMA converge - a key level forming short-term support. Holding above $107K would confirm the preservation of bullish structure, while a break below $106K would open the path to $100K (365D SMA) - a strategic support level. Under current macro conditions, BTC remains influenced by overall volatility.

FAQ
Why is gold rising as yields fall?
Falling UST yields reduce the opportunity cost of holding zero-yield safe-haven assets, intensifying demand for gold as protection against macro risks and potential rate cuts.
Why is VIX rising and what does it mean for BTC?
VIX above 20 indicates rising fear and temporary capital rotation out of risk. For BTC, this is a short-term pressure factor, but subsequent volatility decline typically opens a window for recovery.
Conclusions
The market has entered a defensive liquidity rotation phase: yields are falling, volatility is rising.
Gold is leading the rally, BTC is holding its structural base. A phase shift for BTC requires confirmation through liquidity and declining market fear.