
The BTC market is in the upper part of the Regime Score neutral zone, which has historically shown positive expected returns. The current liquidation structure in the futures market indicates a predominance of short position closures, creating additional mechanical pressure in favor of buyers.
TL;DR
Market analysis suggests tactical upside potential for BTC through the lens of regime indicator and liquidation structure. Logic: the score's transition into the +15–30 zone has historically delivered positive returns, while current short liquidation dominance amplifies the asymmetry in favor of bulls.
Bitcoin Regime Score

The composite indicator combines taker imbalance, OI pressure, funding, ETF flows, exchange flows, and price trend into a single scale from −100 to +100.
Regime Score stands at +16.3, corresponding to the upper part of the neutral zone (+15 to +30). Backtesting for 2025 shows this subzone historically delivered average returns of +3.8% over 30 days, unlike the −15 to 0 subzone where expected returns were negative (−1.5% over 7d). Visually, the indicator has emerged from a recent bearish phase (score dropped to −27 a week ago) and is showing recovery.
The indicator's current position is constructive. An important nuance from backtesting: transition into the formal Bull regime (+30 and above) historically coincided with local tops and delivered negative average returns of −3.3% over 7 days. This means the current +15–30 zone may be optimal for tactical positions, while aggressive accumulation upon breaking +30 carries elevated risk.
Bitcoin Futures Long Short Liquidations Dominance
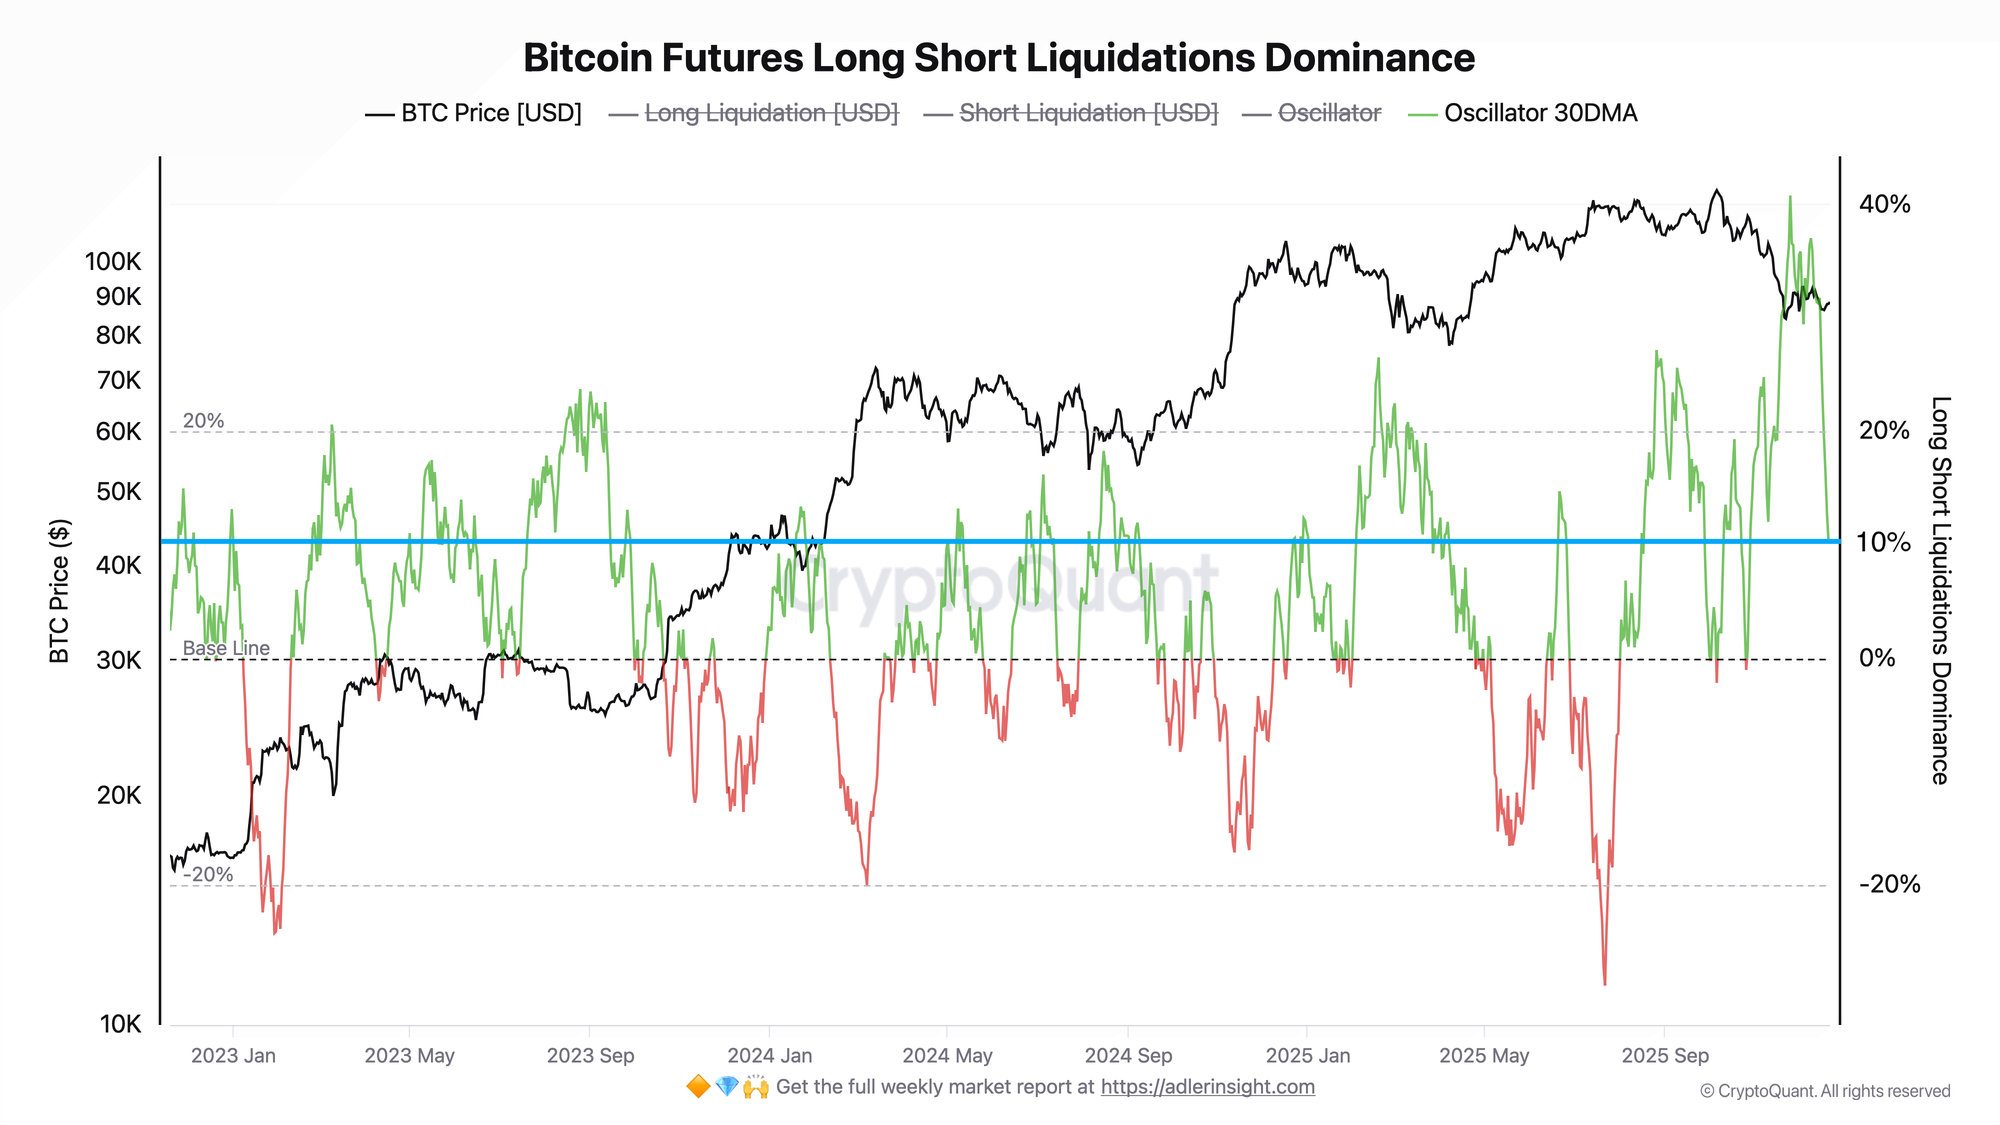
The oscillator shows the difference between long and short position liquidation volumes: negative values indicate predominance of short closures.
The oscillator's current value has dropped into negative territory (−11%), while the 30-day moving average (shown on the chart) remains positive (+10%). This divergence points to a recent surge in forced short position closures. Long Liquidation Dominance stands at 44%, below the 50% baseline, confirming the predominance of short liquidations.
The predominance of short liquidations creates tactical fuel for upside. This chart reinforces the positive signal from Regime Score: the market has not only entered a zone with historically positive expected returns but is also receiving additional support from derivatives structure.

FAQ
Why is the +15–30 zone better than the formal Bull (+30)?
Backtesting for 2025 showed this result: the Bull regime (score above +30) delivered average returns of −3.3% over 7 days, as signals arrived at local tops before corrections. The +15–30 zone, conversely, demonstrated positive expected returns of +0.7% over 7d and +3.8% over 30d. This suggests the current level may be optimal for tactical positions.
What would need to happen for the picture to deteriorate?
A return of Regime Score below zero accompanied by a reversal of the liquidation oscillator into positive territory (rising long liquidations) would signal exhaustion of the current impulse. Historically, the −15 to 0 subzone delivered negative expected returns of −1.5% over 7 days.
CONCLUSIONS
The BTC market is in a "bullish neutrality" zone with Regime Score at +16.3. Backtesting for 2025 shows this subzone (+15 to +30) historically delivered positive returns of approximately +0.7% per week and +3.8% per month. Derivatives structure reinforces the constructive signal: the liquidation oscillator in negative territory indicates predominance of short closures, creating buyer pressure. Important nuance: transition of the score into the formal Bull regime (+30) historically coincided with local tops, so aggressive position building upon breaking this level carries elevated risk.