
🎧 Morning Brief #109 - audio debate on today’s market setup
The last 7 days reveal a growing gap between the institutional demand narrative and the actual flow picture. The ETF impulse remains unstable, while exchange netflow has held firmly in positive territory - coins continue arriving at exchanges rather than leaving them.
TL;DR
Institutional demand via ETFs shows no sign of confident accumulation: over the past 7 days, total netflow came in at −11,042 BTC, with only two positive sessions out of seven. Meanwhile, exchange netflow has remained positive throughout February - spot market supply pressure persists.
Bitcoin US Spot ETF Flows & Liquidity Impulse
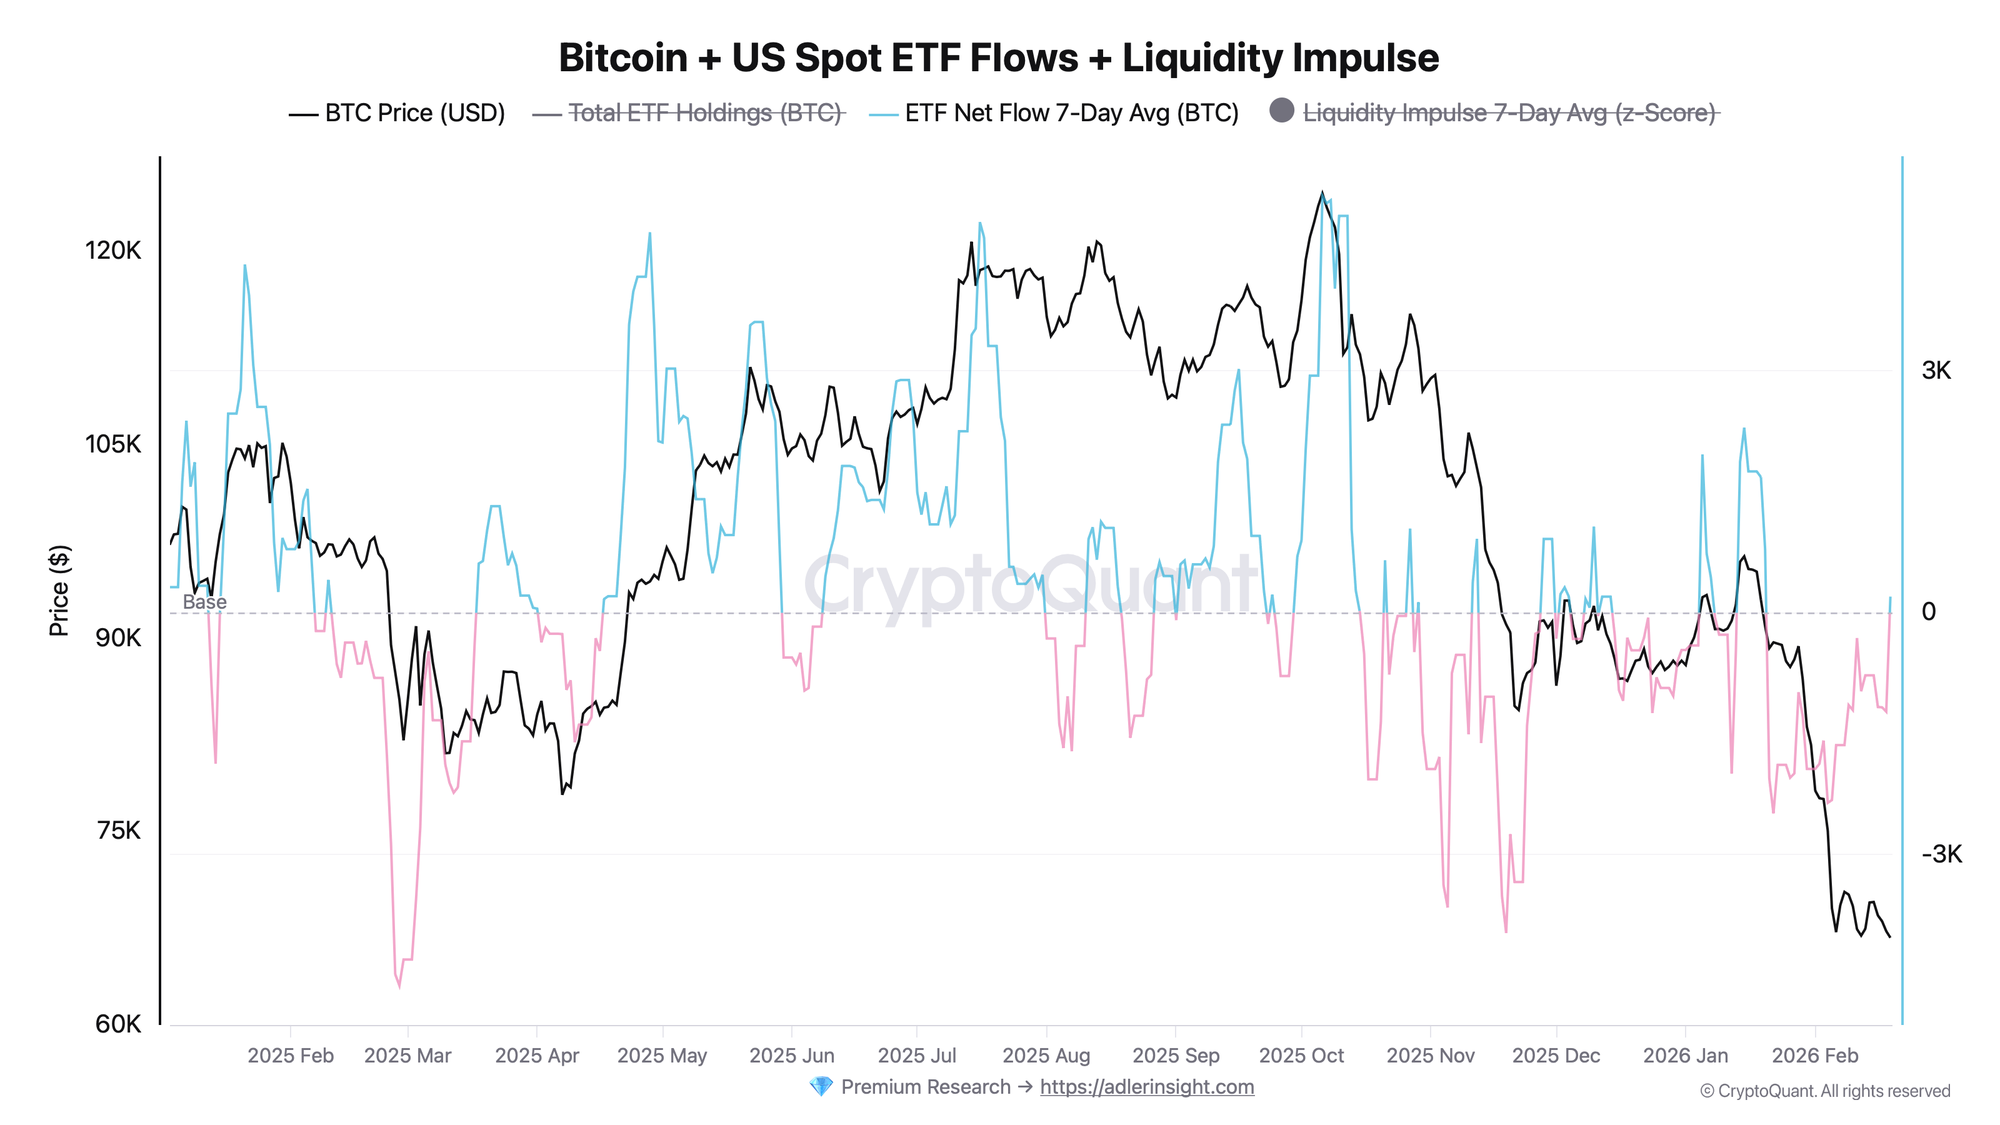
Metric: daily flows into US spot Bitcoin ETFs in BTC, alongside a normalized AUM-weighted liquidity impulse z-score.
Over the past 7 trading days, ETF flows show a pronounced bias toward outflows: total netflow reached −11,042 BTC, with only two positive sessions out of seven. The largest single-day outflow occurred on February 12: −6,120 BTC (approximately −$416M). February 18 saw another outflow of −1,980 BTC, indicating no sustained reversal has taken hold. The only meaningful positive session - February 6 (+5,900 BTC) - came at the start of the period and has not been repeated since.
The signal is unambiguously negative: the two most recent trading days (February 17 and 18) both printed outflows −1,520 and −1,980 BTC respectively. A confirmed reversal toward accumulation requires at least 3 consecutive days of positive netflow. Until that threshold is met, the ETF channel remains a source of pressure, not demand.
Bitcoin Exchange Netflow (Total) - All Exchanges
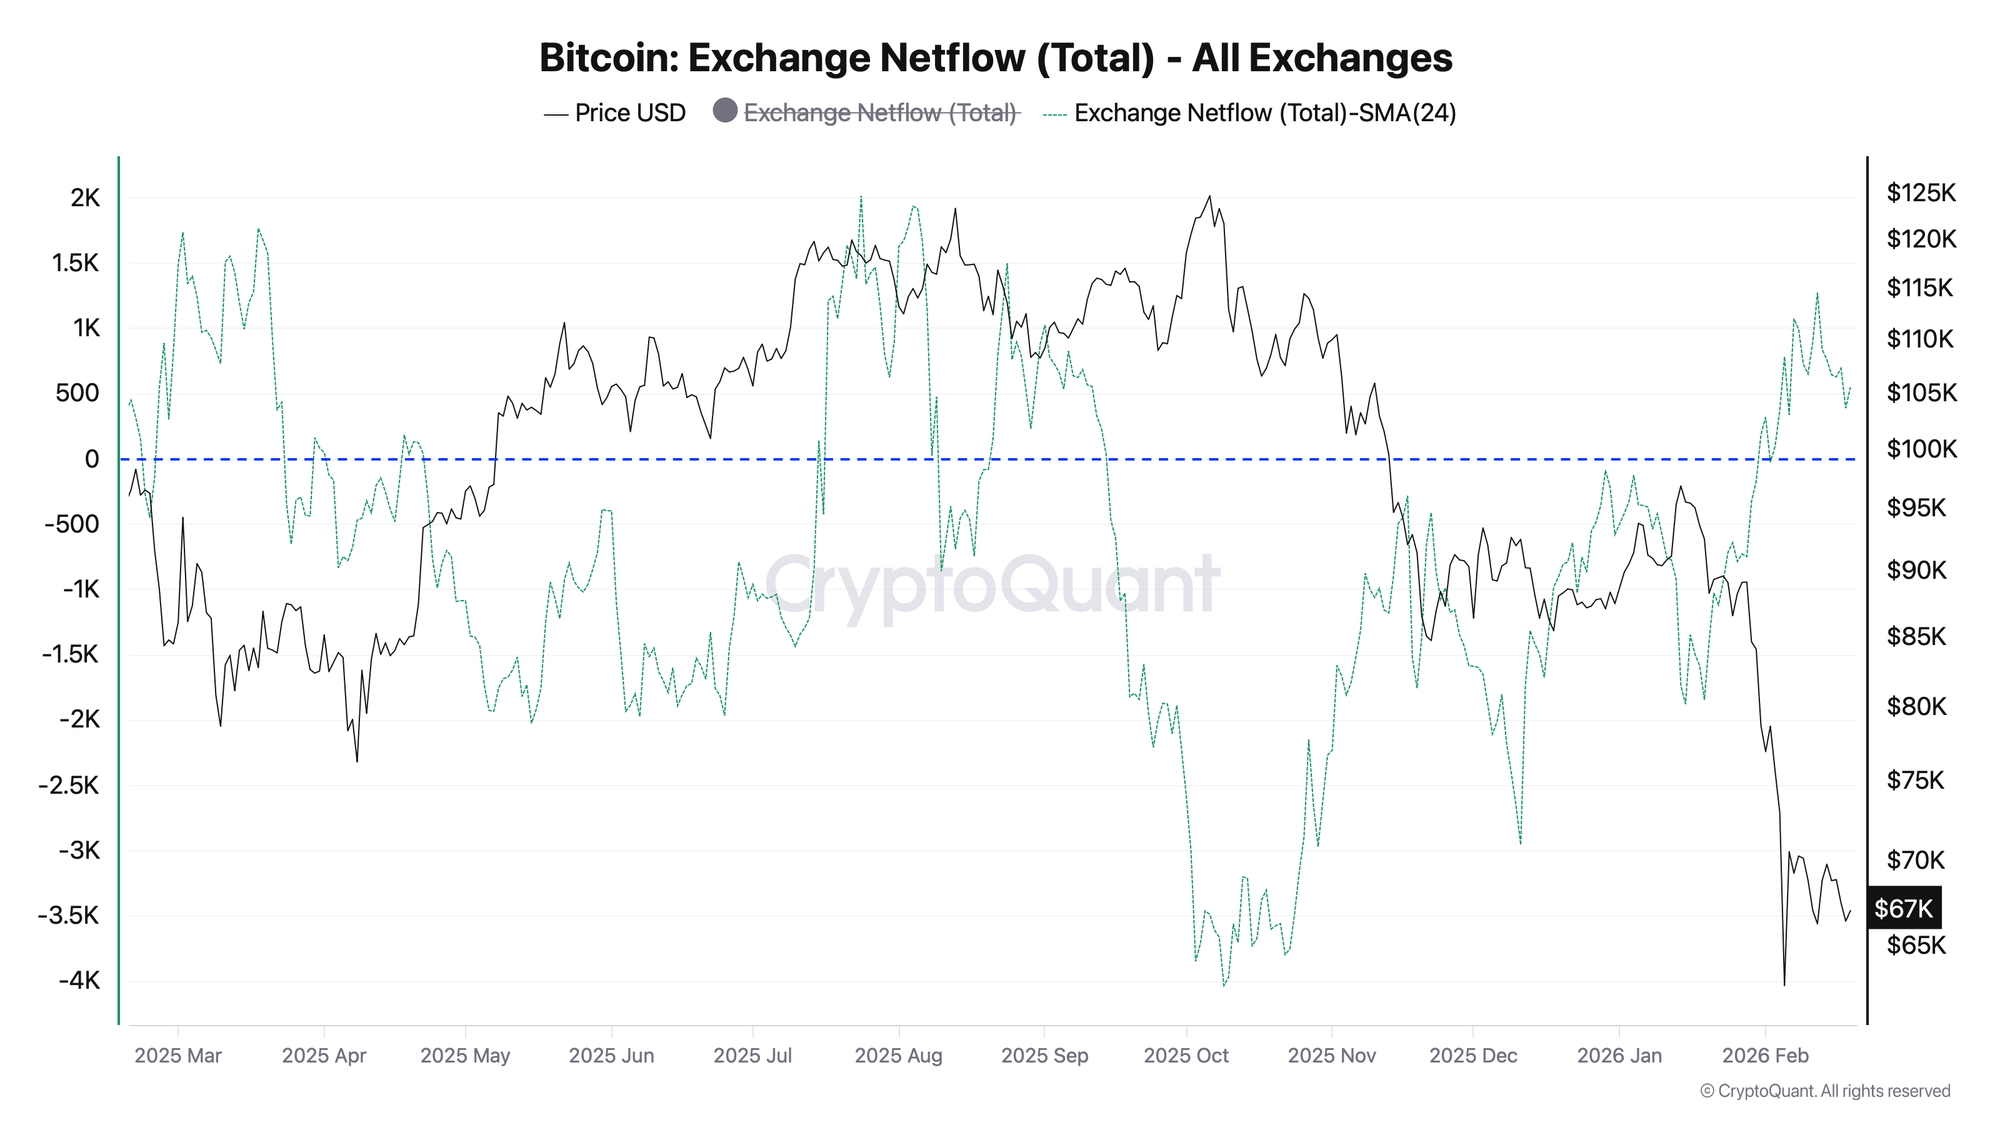
Metric: total Bitcoin netflow across all exchanges, smoothed by a 24-hour simple moving average (SMA-24), denominated in BTC.
Exchange netflow has held in positive territory since the start of February 2026: values over the past 7 days ranged from +391 BTC to +841 BTC. This stands in sharp contrast to January, when netflow was consistently negative - coins were leaving exchanges - reaching −1,876 BTC in mid-month. The reversal occurred around February 3–4 and has not been interrupted since. Today's reading of +553 BTC is consistent with the regime of the past two weeks.
Positive exchange netflow signals rising available supply on spot venues. This increases downside price risk whenever buyer demand softens. The key trigger for a regime shift is a sustained reversal into negative territory - indicating renewed accumulation and coin withdrawal from exchanges.
Both indicators point in the same direction: the ETF channel bled −11,042 BTC over the past week while exchange supply continued to grow. Institutional demand is not only failing to absorb the incoming supply - it has itself become an additional source of selling pressure. The key resolution lies in the direction of ETF flows over the next 3–5 trading days.
💡 Invest in Bitcoin without emotional decisions - Start free. Deterministic signals built to remove fear, FOMO, and panic selling.
FAQ
Does the −11,042 BTC weekly outflow signal the start of a prolonged sell-off?
The weekly outflow is a meaningful signal, but not a definitive verdict. What matters is the pattern: negative sessions dominate (4 out of 7), and the last two consecutive days both printed outflows. If this trend continues next week without offsetting inflows, it will represent a structural signal rather than an isolated spike.
Under what conditions does the picture turn bullish?
Two conditions must be met simultaneously: ETF netflow must return to a sustained positive (3+ consecutive days), and exchange netflow must reverse into negative territory - signaling coin withdrawal from venues. Currently, both indicators are working against that scenario.
CONCLUSIONS
The current flow picture does not support the institutional accumulation narrative. Over the past 7 trading days, ETFs recorded a cumulative outflow of −11,042 BTC with negative sessions dominating, while exchange netflow has remained positive throughout February - coins are moving onto the market, not into cold storage. The aggregate signal is risk-off: supply is pressing from both sides simultaneously. The primary risk is a continuation of ETF outflows against a backdrop of growing exchange supply with no offsetting demand; the key reversal trigger is a synchronized shift of both indicators back into accumulation mode.