
The indicator reflecting short-term holder sales dropped below 1.00, signaling weak risk appetite in this cohort.
TL;DR
The market is balancing after volatility, short-term profits are declining and loss-making sales are beginning to dominate. If STH SOPR consolidates >1.00 and P/L rises above 50, a growth restart is likely; otherwise the market risks getting stuck in a range with increased chance of testing the lower support zone.
#BTC #STH-SOPR #Profit-Loss
Bitcoin Short-Term Holder SOPR
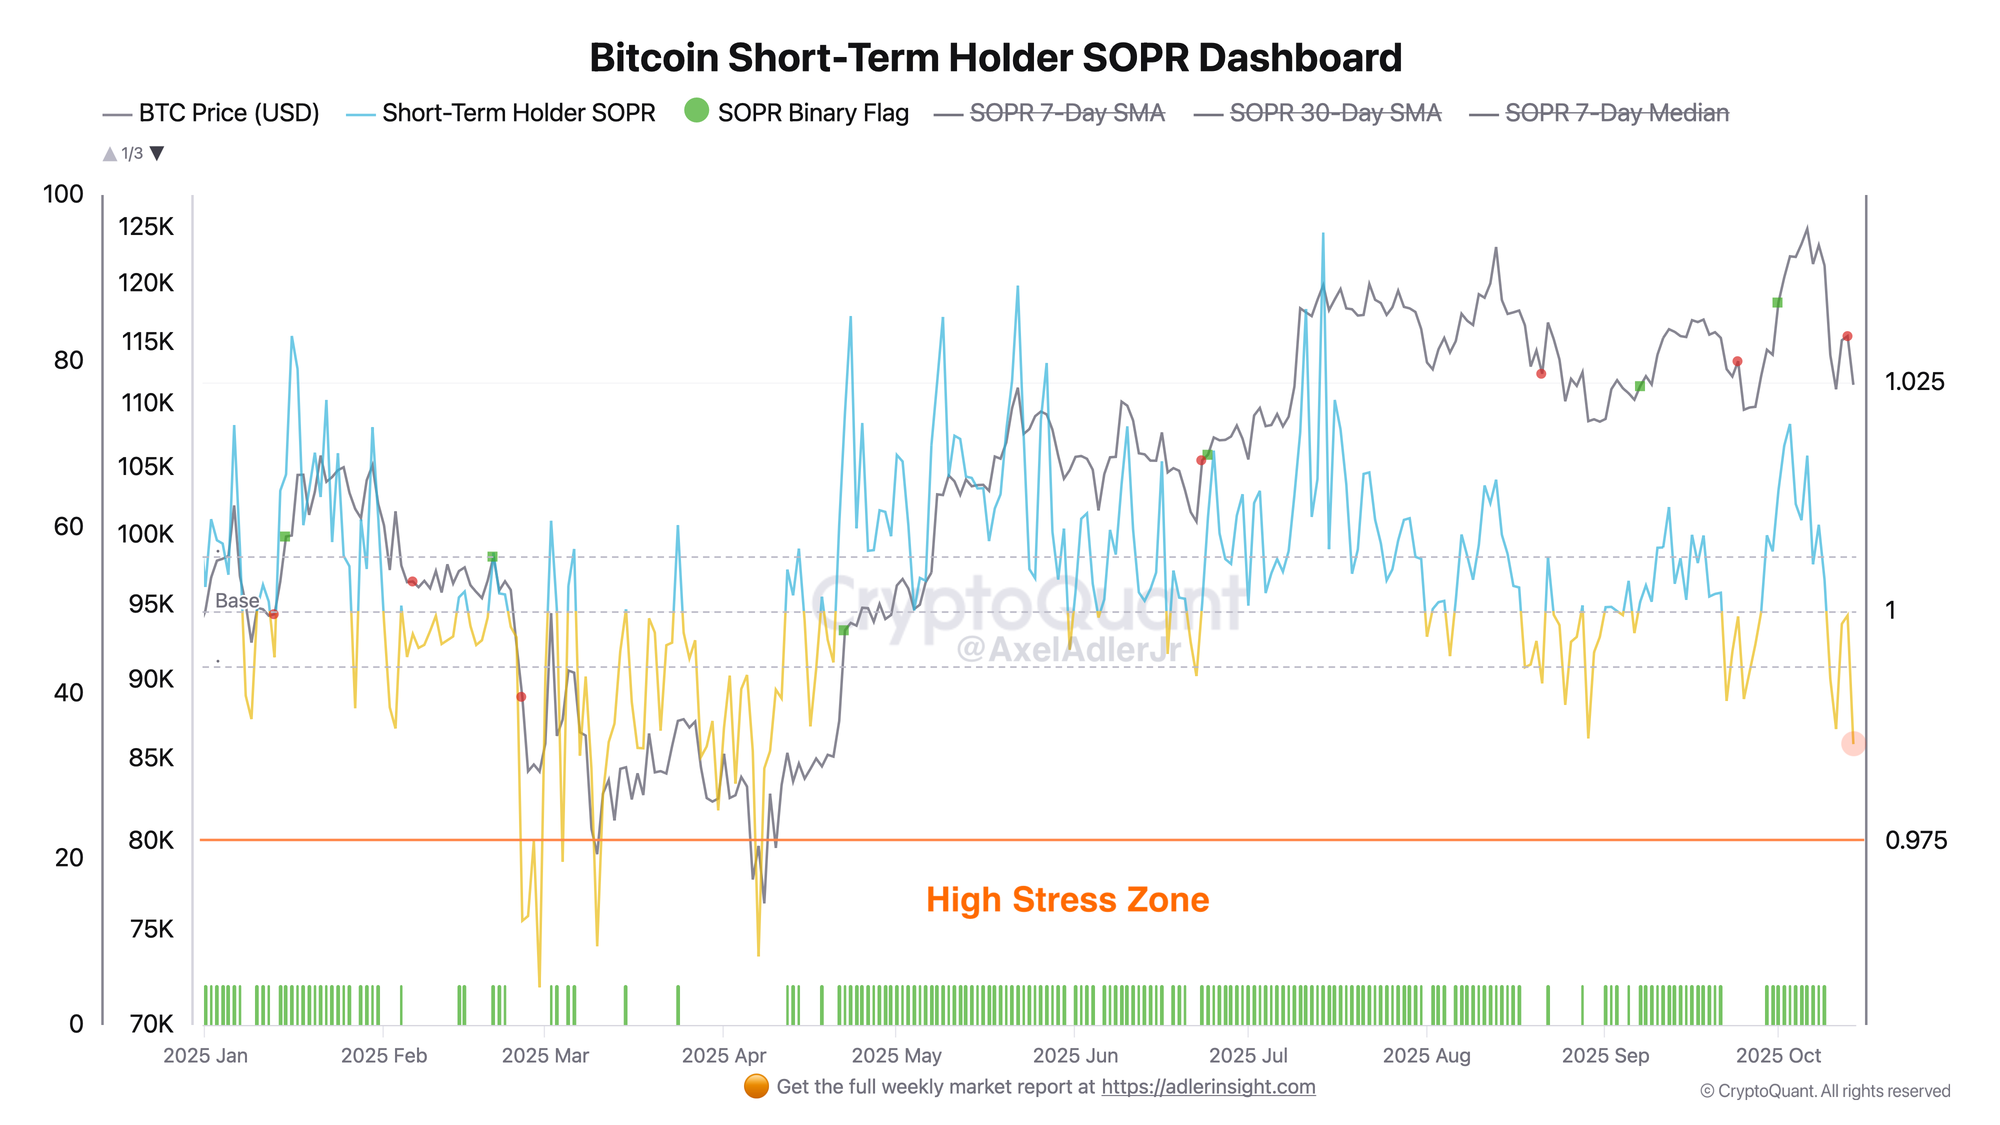
The indicator shows whether short-term holders are selling at a profit or loss. The current value <1.00 indicates loss realization and short-term demand weakness. Seven-day smoothed values fluctuate slightly below 1.00, which is characteristic of consolidation phases or post-stress periods. SOPR consolidation >1.00 for 3–5 sessions opens a window for recovery; holding or declining indicator increases the risk of unprofitable supply pressure.
Bitcoin P/L Block
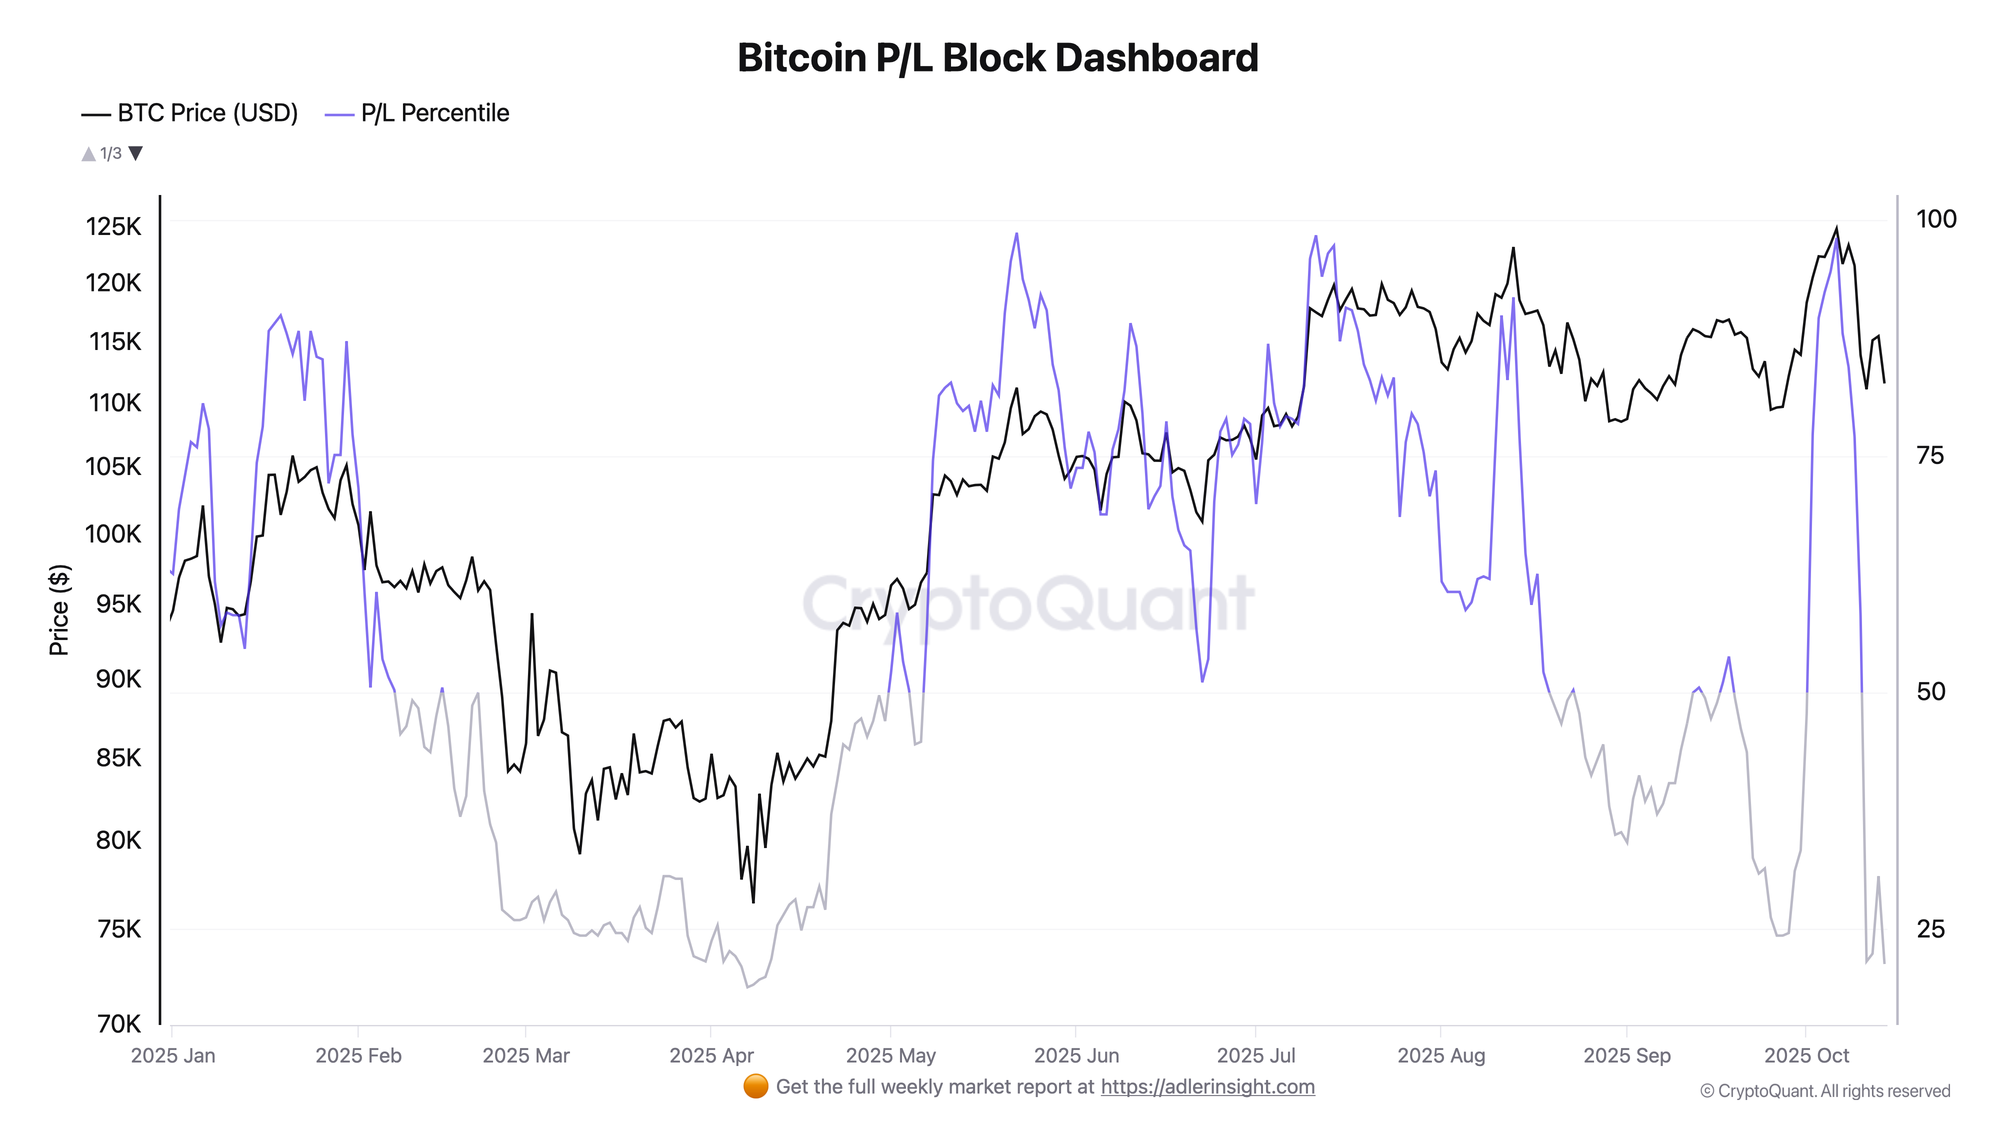
he indicator is built on profit and loss data within each block, then the data is converted into Percentile relative to history. Currently the percentile is <25, indicating dominance of unprofitable movements. The sharp pullback from the peak signals a sentiment change. Sustainable market reversal occurred when the percentile rose >50 and held for several consecutive sessions. When the metric drops below 20, there is a risk of deeper correction, as the share of unprofitable blocks consistently exceeds profitable ones.

FAQ
Why does STH SOPR value below 1.00 signal a loss distribution phase?
When STH SOPR <1.00, coins moved by short-term holders are sold below their last acquisition price. This means loss-taking that pressures the market.
How to interpret low P/L?
P/L value <25 indicates that the share of profitable positions is low relative to history, suppressing risk appetite. For sustainable recovery, the metric needs to rise toward >50.
Conclusions
The current market picture is characterized by pronounced short-term demand weakness and dominance of loss-making sales. STH SOPR falling below 1.00 indicates that short-term holders are selling positions at a loss. In parallel, the P/L Percentile collapse from peak values to below 25 confirms a change in market participant sentiment. The share of profitable blocks has fallen to minimums, signaling local stress. For a sustainable trend reversal, a synchronized exit of both metrics from the current weak zone is necessary.