
Futures Bulls Are Back: Positioning Index Above 3 for the First Time Since October
Smoothed positioning has moved into a sustained bullish zone for the first time in three months. Sentiment confirms the local regime shift.

Positioning Index SMA-30d rose to 3.5 - the first breakout above the 3 level since October 2025. Simultaneously, the Advanced Sentiment Index reached a peak of 93%, confirming the transition of both futures market models into bullish territory.
TL;DR
Smoothed positioning has moved into a sustained bullish zone for the first time in three months. Sentiment confirms the local regime shift.
- 3.5
- Positioning Index, 30-day average
- 93%
- Advanced Sentiment Index peak
- 70%
- Sentiment after the pullback
Bitcoin Positioning Index
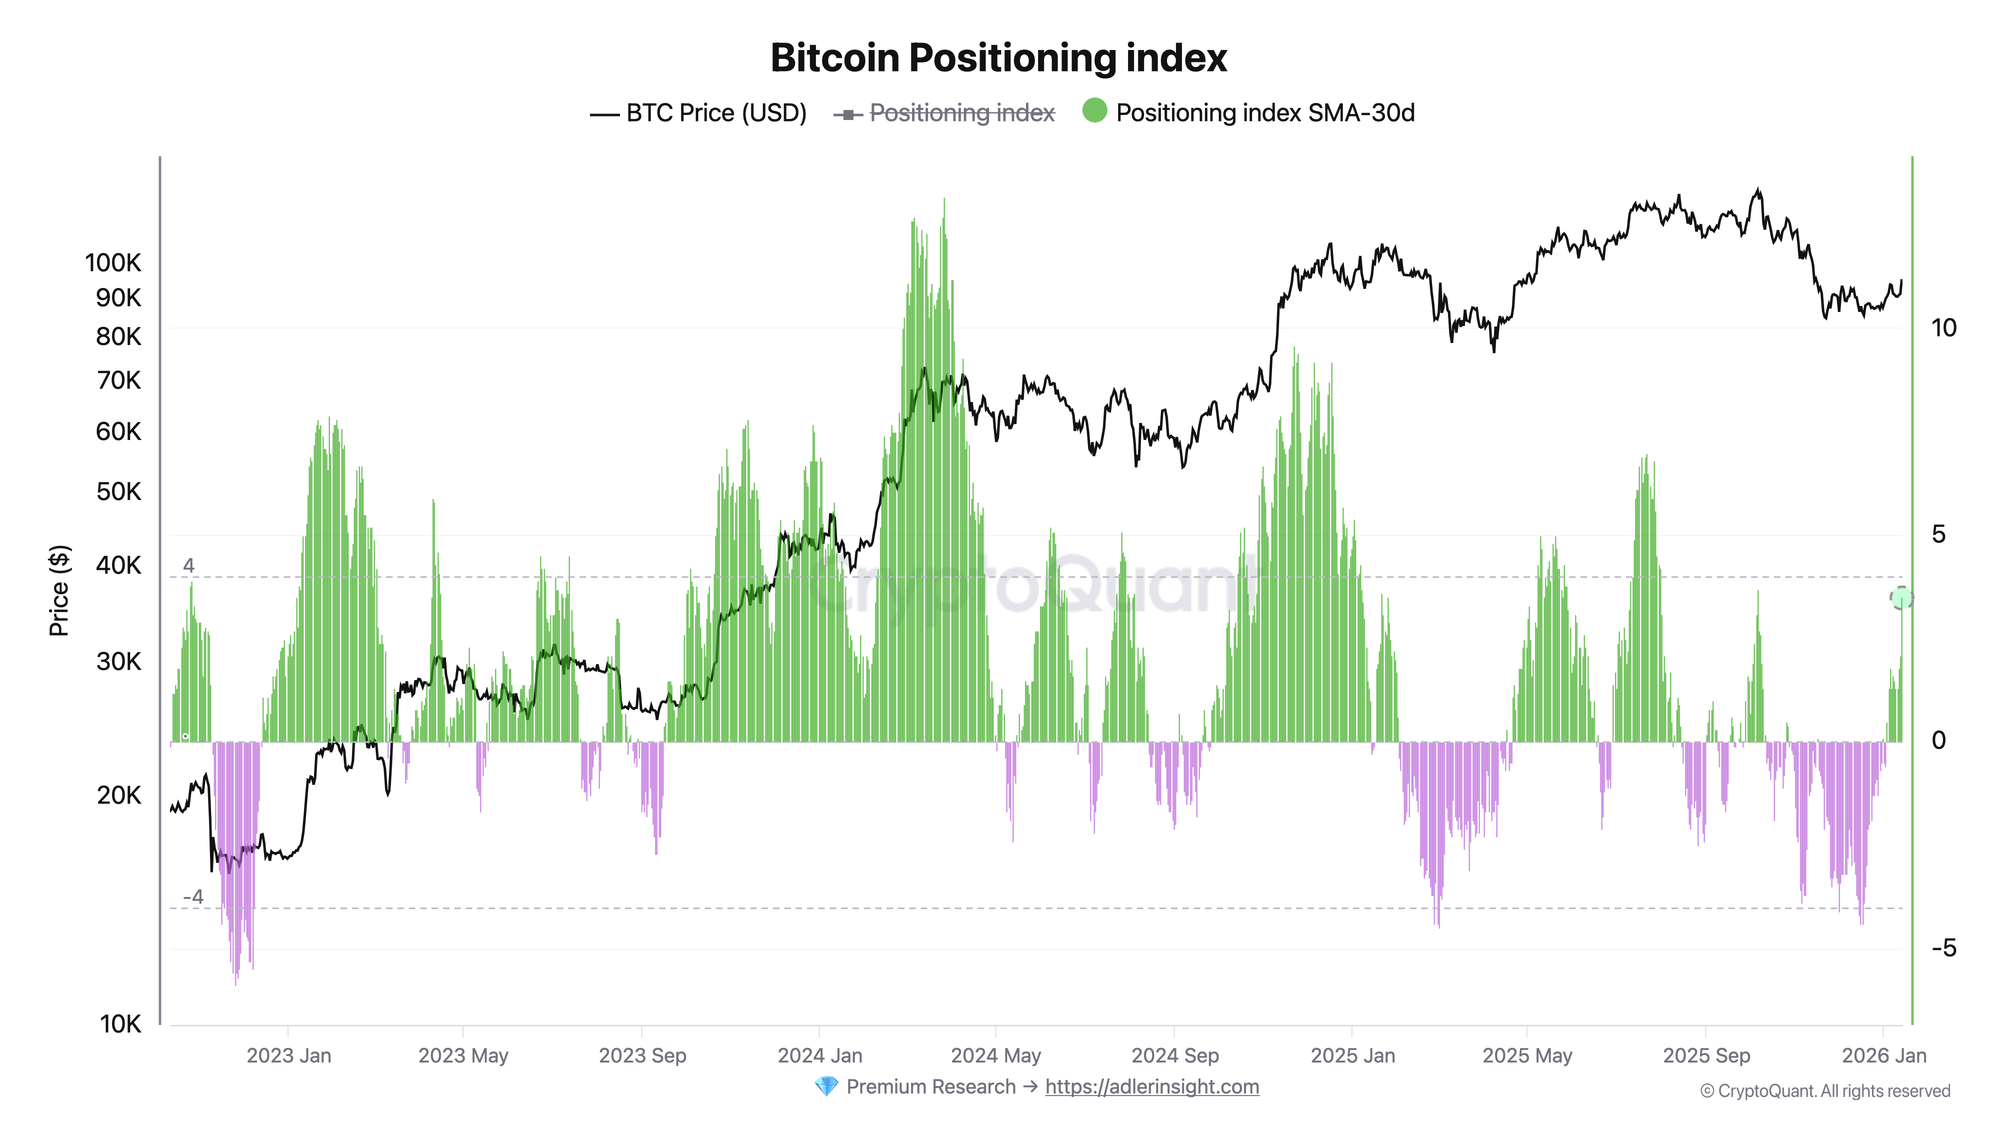
A composite positioning index that accounts for open interest dynamics, funding rate, and long/short opening ratios across major cryptocurrency exchanges. Scale: -100 to +100. Thresholds: > 20 BULLISH, > 50 EXTREME BULLISH, < -20 BEARISH, < -50 EXTREME BEARISH.
Positioning Index SMA-30d rose from 2.1 to 3.5 - the first breakout above 3 since October 6, 2025, when the value reached 3.7 during the rally to $125K. The daily index reached 24 (BULLISH zone) amid an influx of aggressive long positions: OI growth of 1.89% with positive taker delta and funding at 0.0045. Price rose 4.58% to $95,358, open interest increased to $12.18B.
The SMA breakout above 3 after three months in the 0 ± 2 range signals a local shift in positioning on the Bitcoin futures market. Continuation trigger: SMA holding above 2 for one week.
Bitcoin: Advanced Sentiment Index
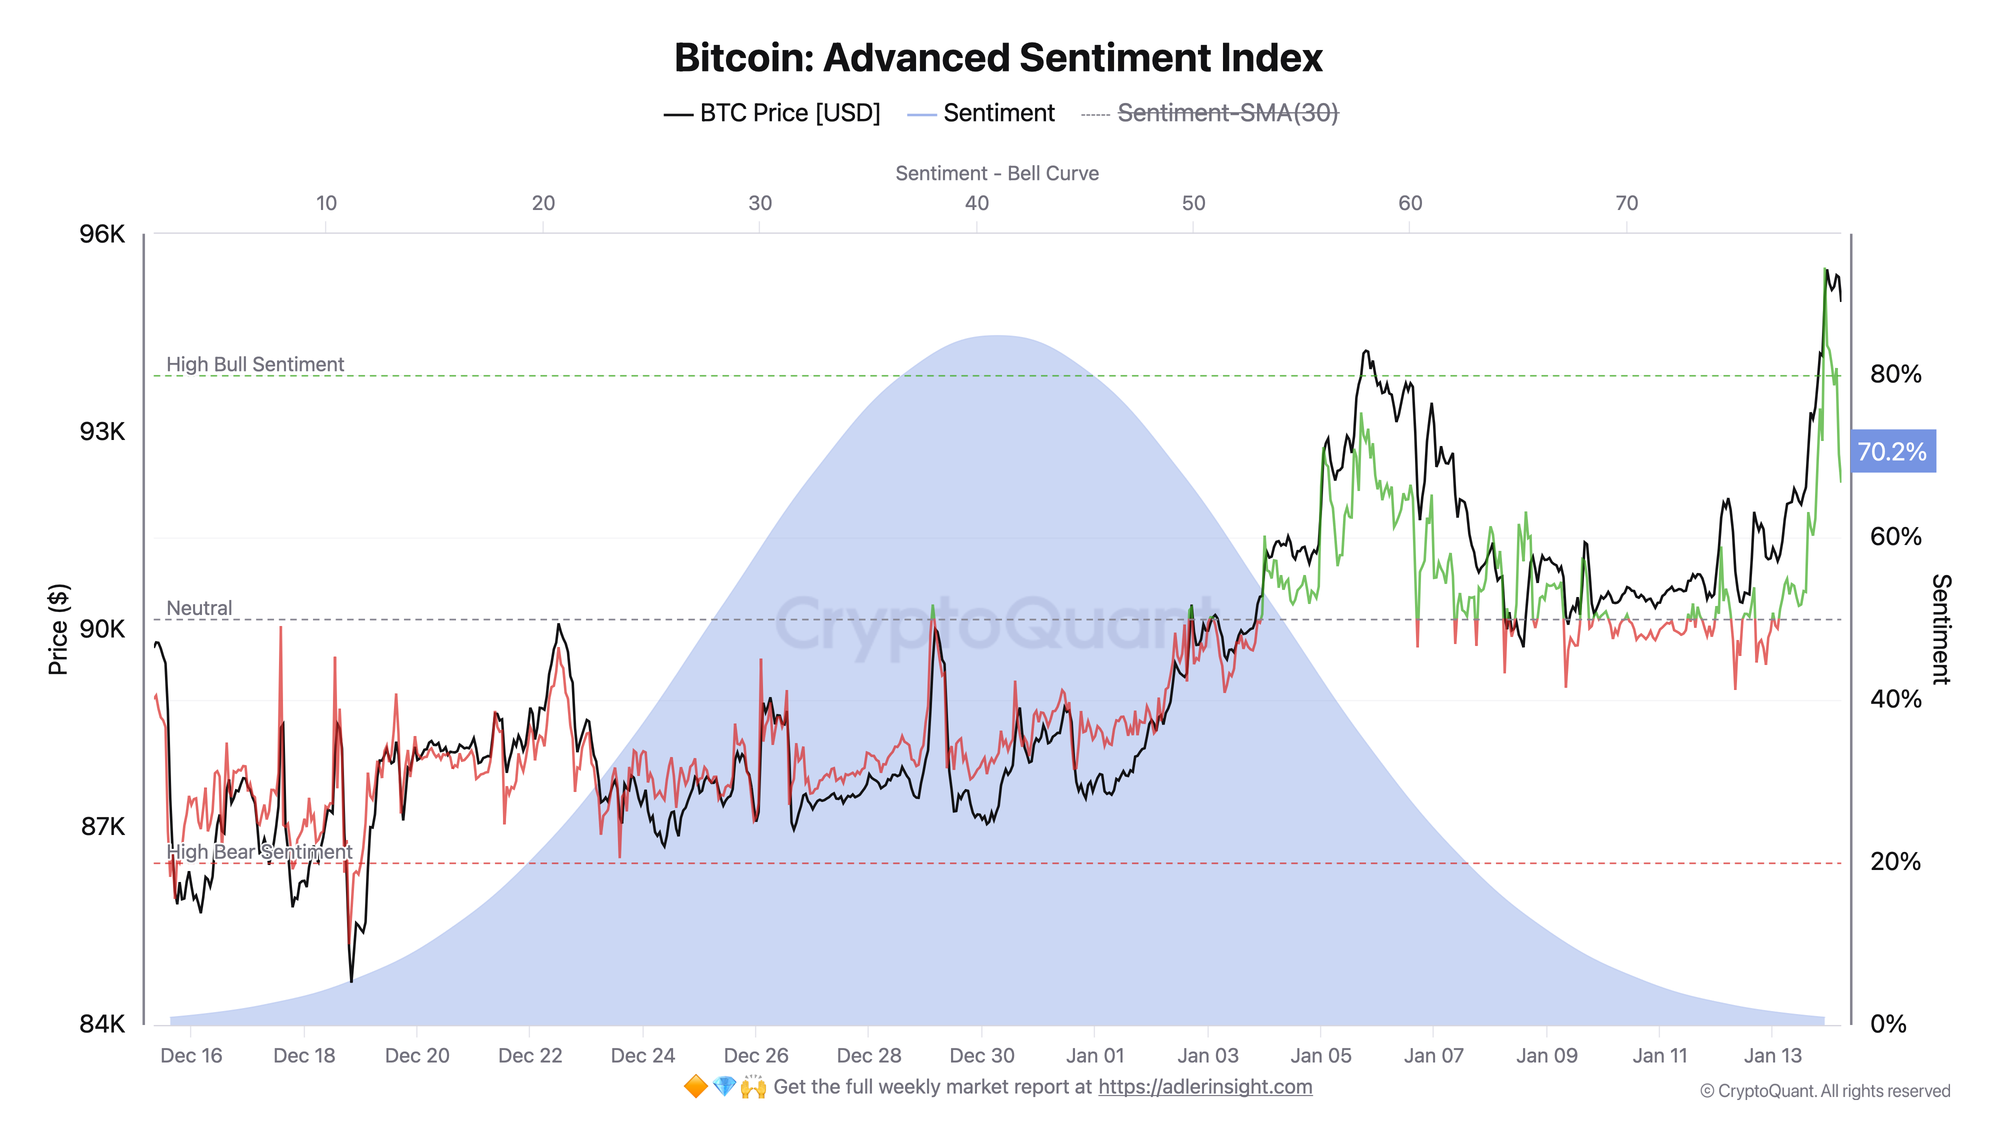
A composite sentiment index for the futures market ranging from 0% to 100%. Thresholds: 80% - High Bull Sentiment, 50% - Neutral, 20% - High Bear Sentiment.
Sentiment reached a local peak of 93.15% yesterday evening at a price of $95,061, then pulled back to the current 70%. The index remains well above the neutral threshold of 50% and above the SMA-30d (62.9%). For comparison: in mid-December, sentiment dropped to extreme lows of 10-15% during the correction to $85K - that was a real bearish extreme.
The 23 pp pullback while price holds above $94K is interpreted as a release of overheating. However, this is a qualitative assessment, not a formal model signal. Deterioration trigger: drop below 50% with simultaneous price decline under $92K. Continuation trigger: holding above 60% during 24-48 hours of consolidation.
FAQ
Why is SMA-30d important rather than the daily Positioning Index value?
The daily Positioning Index is volatile and can produce false signals due to one-off activity spikes. The SMA-30d smooths out noise and shows the sustained positioning trend. The SMA breakout above 3 after three months in the 0 ± 2 range means bullish positioning accumulated not over a single day but formed systematically. The last time this level was observed was in October 2025 before the move to $125K.
Is the sentiment pullback from 93% to 70% a reversal or a correction?Formally, the model does not provide a definitive answer - the current value of 70% is above the 50% threshold (neutral) but below 80% (High Bull). Qualitatively: the 93% level was in the zone of extreme optimism, from which pullbacks are statistically likely. The current 70% remains above the SMA-30d (62.9%), indicating the preservation of a bullish bias. For comparison: in December, sentiment fell to 10-15% - that was a structural breakdown, not a correction.
CONCLUSIONS
Against the backdrop of yesterday's market compression, two models with different methodologies but the same data class (futures market) synchronously indicate a regime shift. Positioning Index SMA-30d broke above 3 for the first time since October 2025, signaling accumulation of bullish positions. Advanced Sentiment Index reached a peak of 93% and pulled back to 70% - interpreted as a release of overheating while maintaining bullish structure. Risk-on regime in derivatives. Main continuation trigger - Positioning SMA holding above 2 and sentiment above 60% during price consolidation in the $93-96K range. Main risk - sentiment dropping below 50% with Positioning SMA returning to the zone below 1, which would indicate exhaustion of momentum.
Live Charts
Explore the metrics behind this brief with live, auto-updating charts:
Derivatives - All funding, open-interest, and leverage charts in one view.
Open Interest (BTC) - Total futures positioning and 7-day BTC-denominated change.
Funding Rates - Perpetual futures funding to track long-side or short-side leverage pressure.
SOPR - Spent Output Profit Ratio shows whether moved coins realize profit or loss.
Your call is in. See how the on-chain data reads it every Monday →