
Synchronous growth of price and OI strengthens the uptrend, but sustainability depends on fresh demand for longs.
TL;DR
The market has entered a phase of managed growth: price and open interest are growing together, correlation remains positive, and momentum is supported by net long additions without short covering dominance. The cycle extremes index indicates a compression phase.
#FUTURES #OPEN-INTEREST #CYCLE
Bitcoin Open Interest
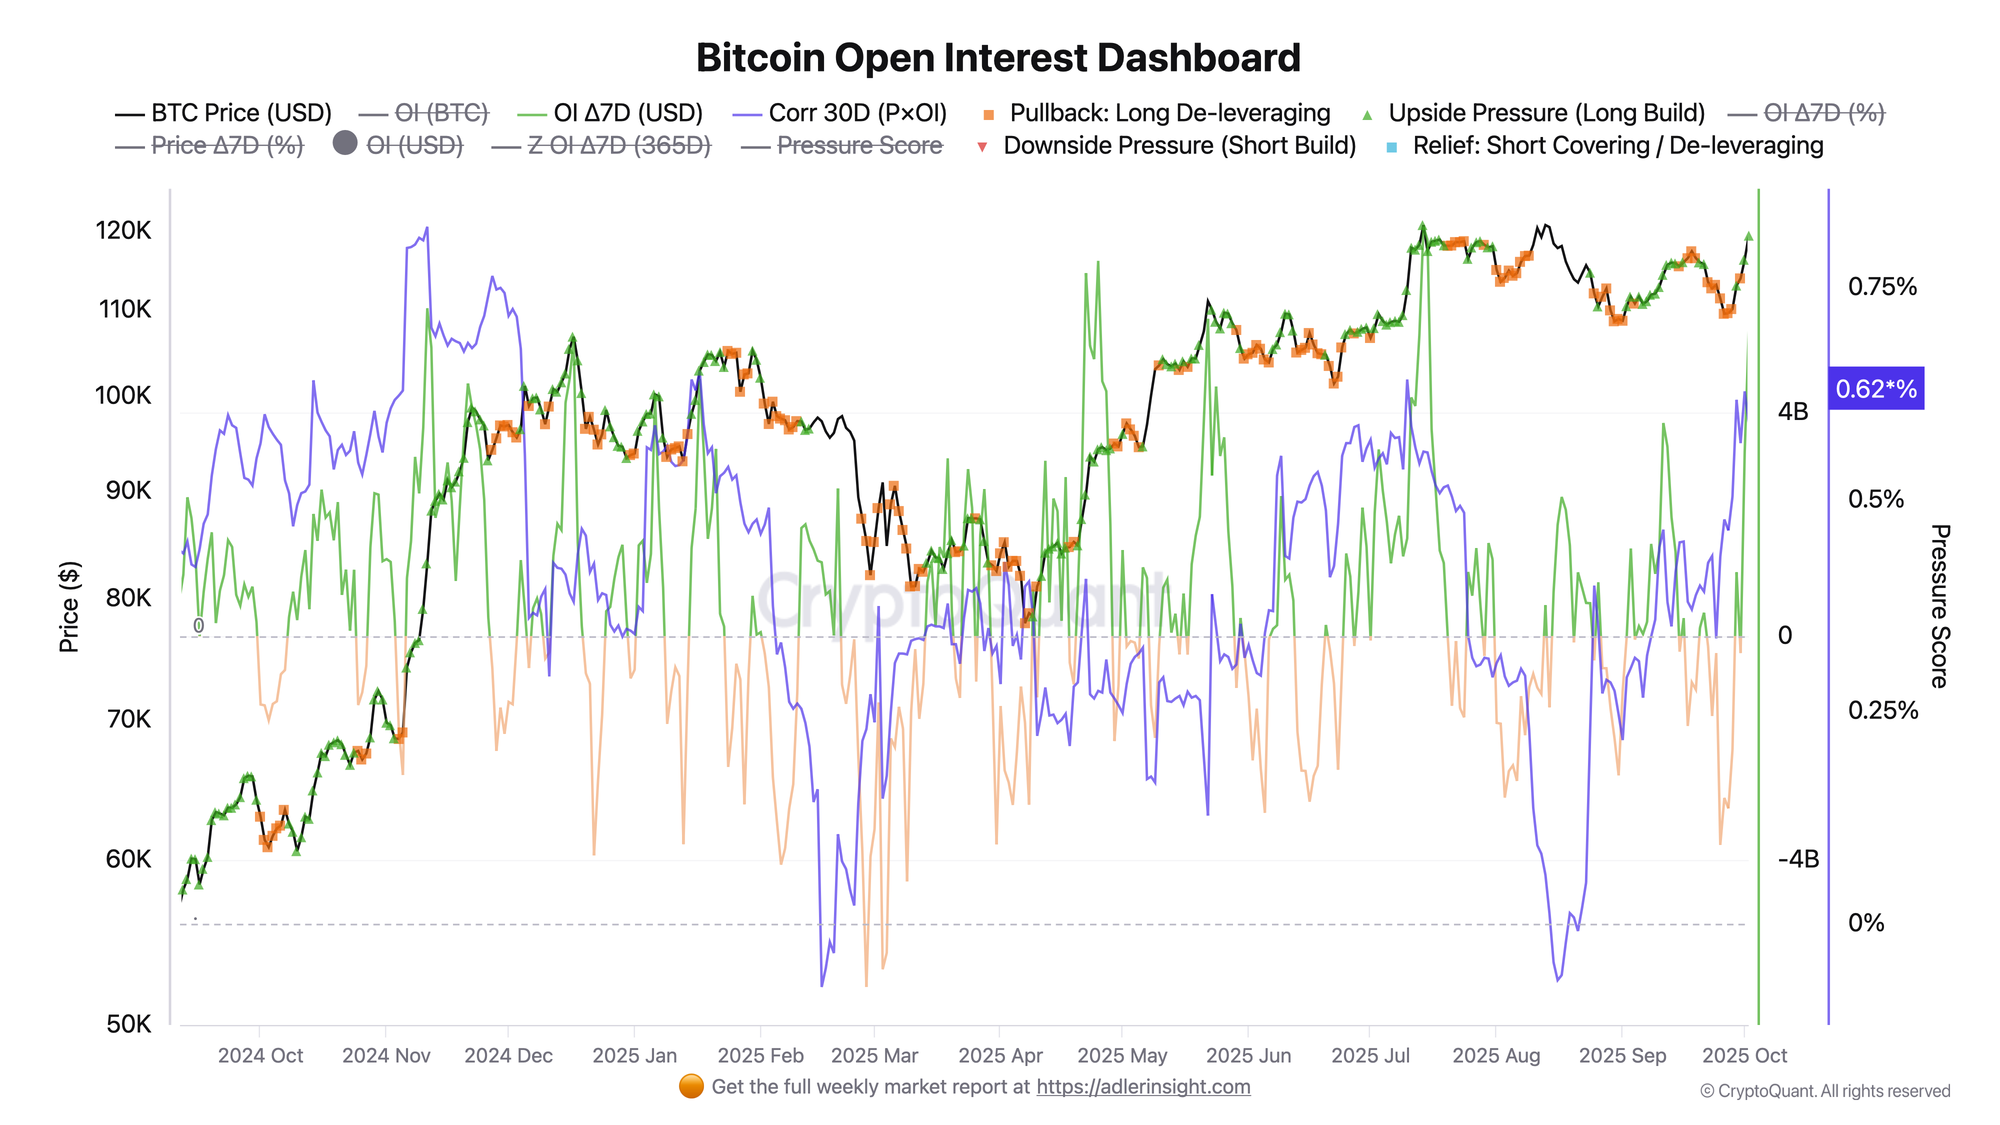
Momentum in open interest has strengthened: the 7-day OI delta in money terms has turned into strongly positive territory at +$5.4B and is moving up together with price. This looks like pro-trend leverage building, leverage growth is happening on rises, not on drops in volatility. As long as OI expands without visible resets, momentum remains sustainable and fuels the move.
The 30-day moving correlation between price and OI has risen and holds at +0.62. In this mode, leverage growth quickly translates into quotes, as additional longs are fuel for the uptrend. Rising correlation after autumn turbulence is a sign of the market's transition to a more directional trend segment.
Upside Pressure (Long Build) flags have been triggered consistently, confirming that the rise is being driven precisely by net long additions, not relief through short covering. There are almost no Short Covering clusters nearby - meaning there are few short positions to continue momentum, and further upside depends on fresh demand for long leverage.
What to watch next:
Sustainability of OI momentum (OI delta remains >0 on 7-day horizon), maintaining positive price and OI correlation above 0.5, and the nature of price consolidation in the upper range with moderately growing OI. If we see acceleration in OI growth while price stagnates, the probability of overload increases; conversely, soft OI stabilization after a surge without price collapse is a healthy scenario for trend continuation.
Bitcoin Cycle Extremes Index
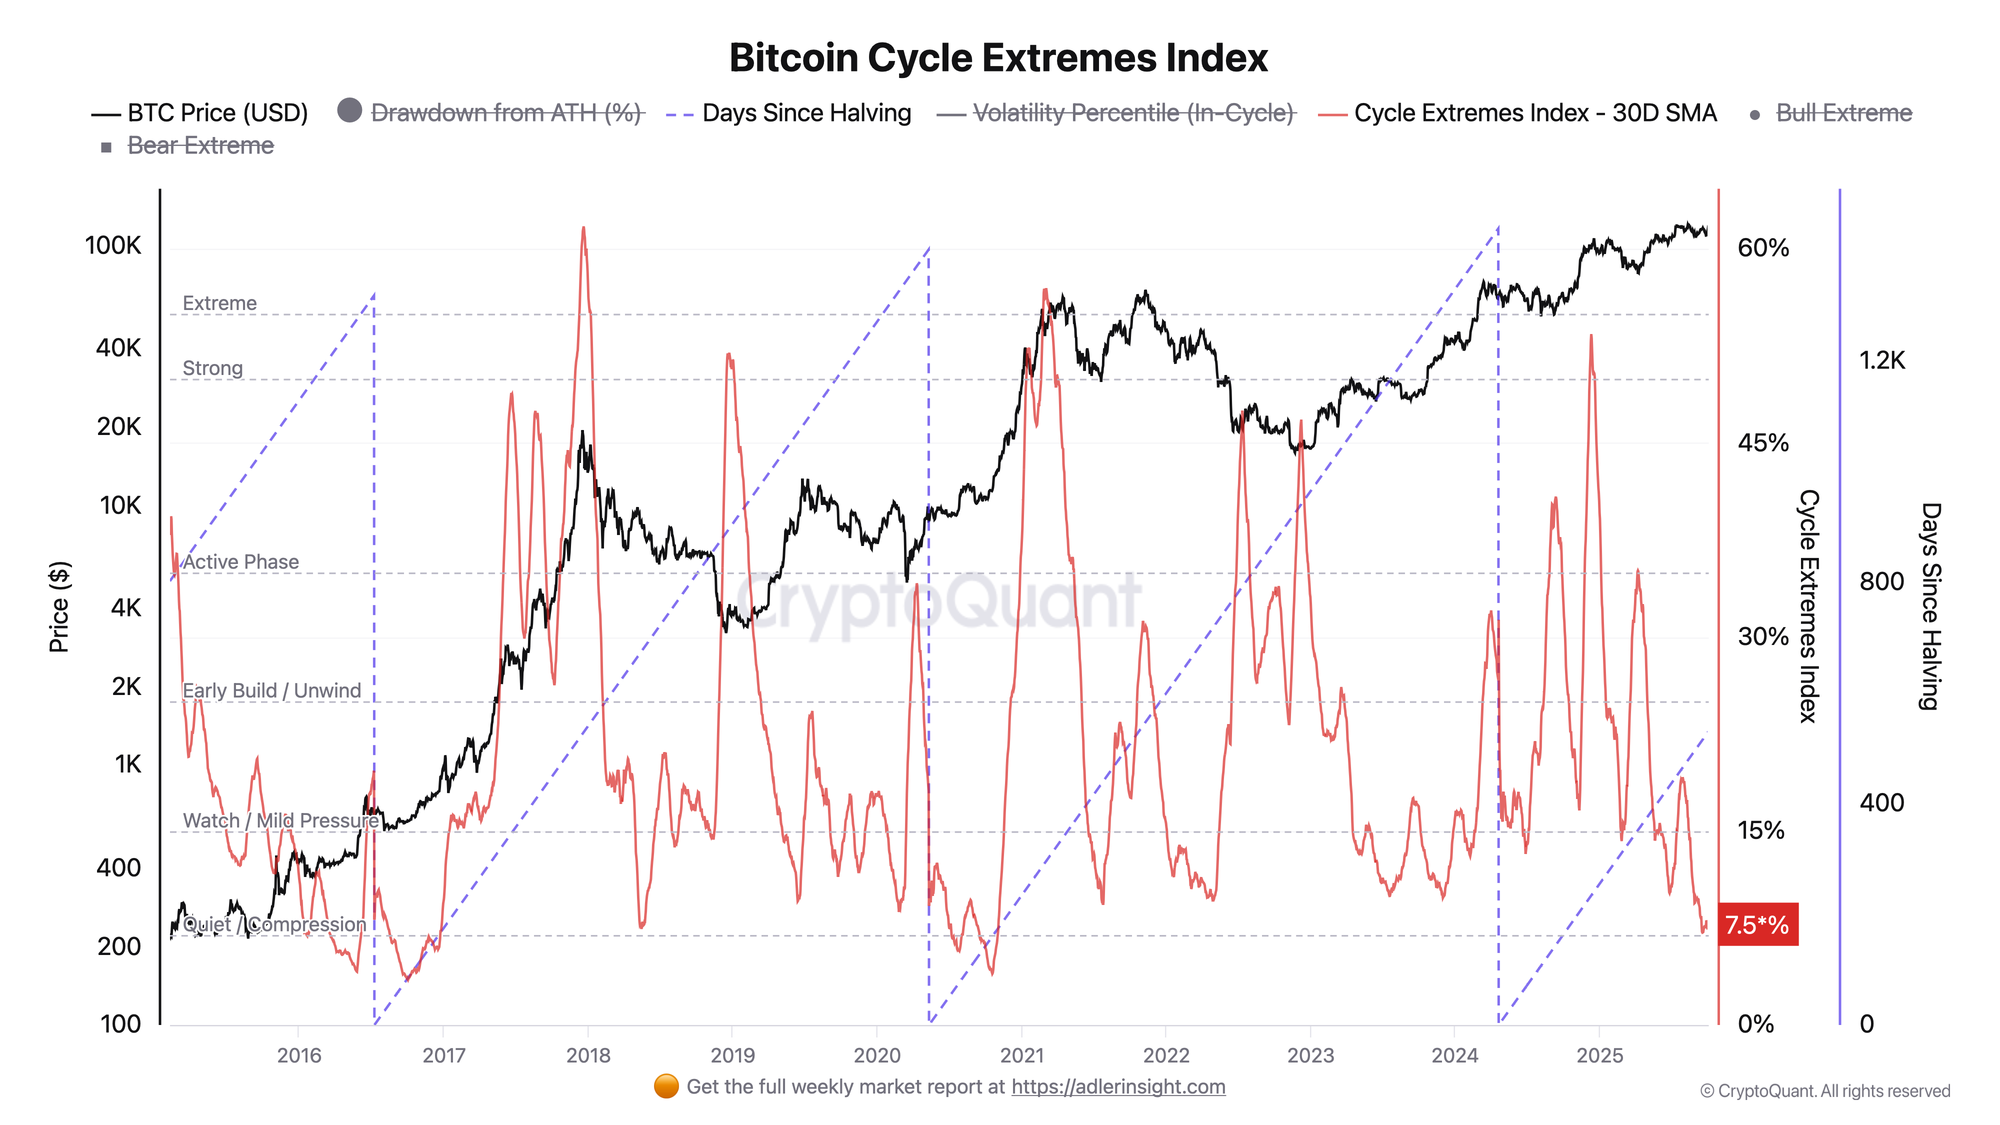
The cycle extremes index has dropped to the 7.5% zone on the 30-day SMA, meaning the market is in compression mode, not in a state of overbought or panic. Meanwhile, price is trading close to historical highs, which emphasizes the managed nature of the trend: momentum is supported more by fundamental demand and absence of aggressive unwinds than by euphoria spikes. In terms of cycle structure, we are in the middle post-halving stretch: volatility is within intra-cycle norms, the drawdown from ATH is small and doesn't pull the composite up.
The composite itself is built as a mix of ASOPR/MVRV/NUPL/NVT deviations from their medians within the current cycle, weighted according to the 30-day volatility percentile. A low value means that short-term holder profitability, valuation multiples, and network behavioral signals are not deviating from the norm, and the velocity of flow turnover remains moderate. Such compression phases precede the next momentum leg of the trend: first calm, then volatility breaks out of the squeeze and accelerates.

FAQ
How does Bitcoin Open Interest growth together with price affect market trend?
Open Interest is the sum of open derivative contracts. When the 7-day OI delta grows alongside rising price (as now, +$5.4B), it means net long building and capital inflow. Such "Long Build" adds liquid leverage and strengthens the uptrend until signs of overload appear.
Why is 30D correlation between price and OI above 0.5 considered a bullish signal?
Positive correlation (currently +0.62) shows that changes in positioning directly translate into price: inflows into longs support momentum. If correlation drops toward zero/negative while OI grows, the market becomes fragile and the risk of de-leveraging increases.
What exactly do the Upside Pressure (Long Build) flags signal on the OI chart?
The flag captures consecutive long position additions without dominant short covering. This is "clean" trend fuel: demand comes from new longs, not forced closures. A shift to Pullback: Long De-leveraging will be an early signal of momentum weakening.
How to interpret the low Bitcoin Cycle Extremes Index value (7.5%)?
A low composite and low volatility percentile indicate a post-halving compression phase: the market is not overheated and moves in a "managed" manner. Such regimes often transition into acceleration, but a sharp jump in the index to 30–60% without price progress means a warning signal.
Conclusions
The Bitcoin market maintains its bullish character thanks to synchronous growth of price and open interest, confirming net capital inflow into long positions. Price and OI correlation remains consistently high, indicating the pro-trend nature of leverage building. Meanwhile, the cycle extremes index is in a low compression zone, reflecting a managed trend without overheating and mass unwinds.