
Long-Term Holders conducted the largest profit-taking of the entire cycle, reducing positions by 1.57M BTC over the quarter amid price decline toward $80K.
TL;DR
LTH are conducting massive profit-taking, reducing Supply to early 2023 lows. The 30-day Net Position Change shows one of the deepest sell-offs of the entire bull cycle.
#Bitcoin #OnChain #LTH
Bitcoin Long-Term Holders Supply
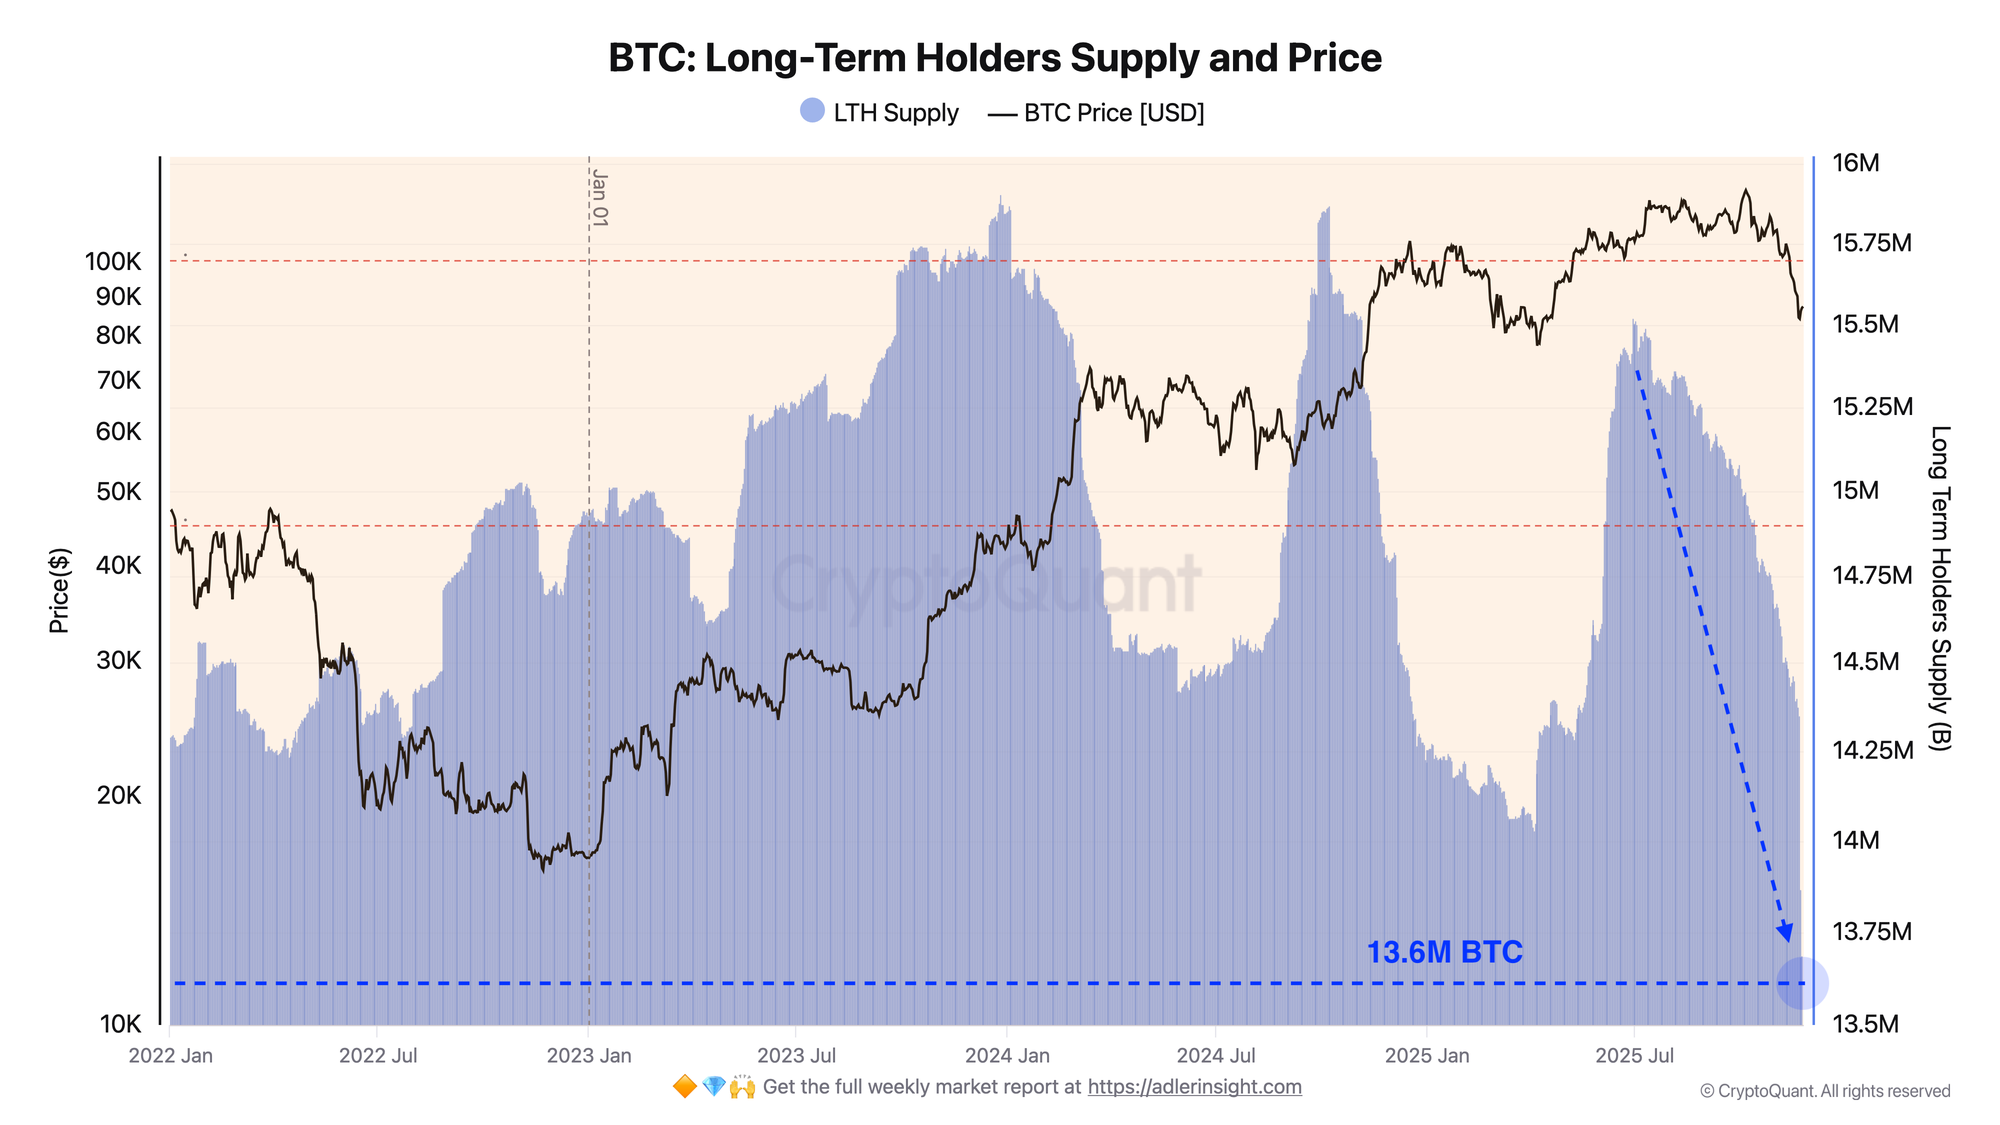
Long-Term Holders' supply fell from a peak of 15.75M BTC to current 13.6M BTC—the lowest since the beginning of the bull cycle. This is essentially a classic smart money distribution pattern at tops: LTH aggressively reduced positions, and over the last 2 weeks (November 11-25), 803,399 BTC were sold (-5.54%), averaging 53,560 BTC/day.
Bitcoin Long-Term Holders 30-day Net Position Change
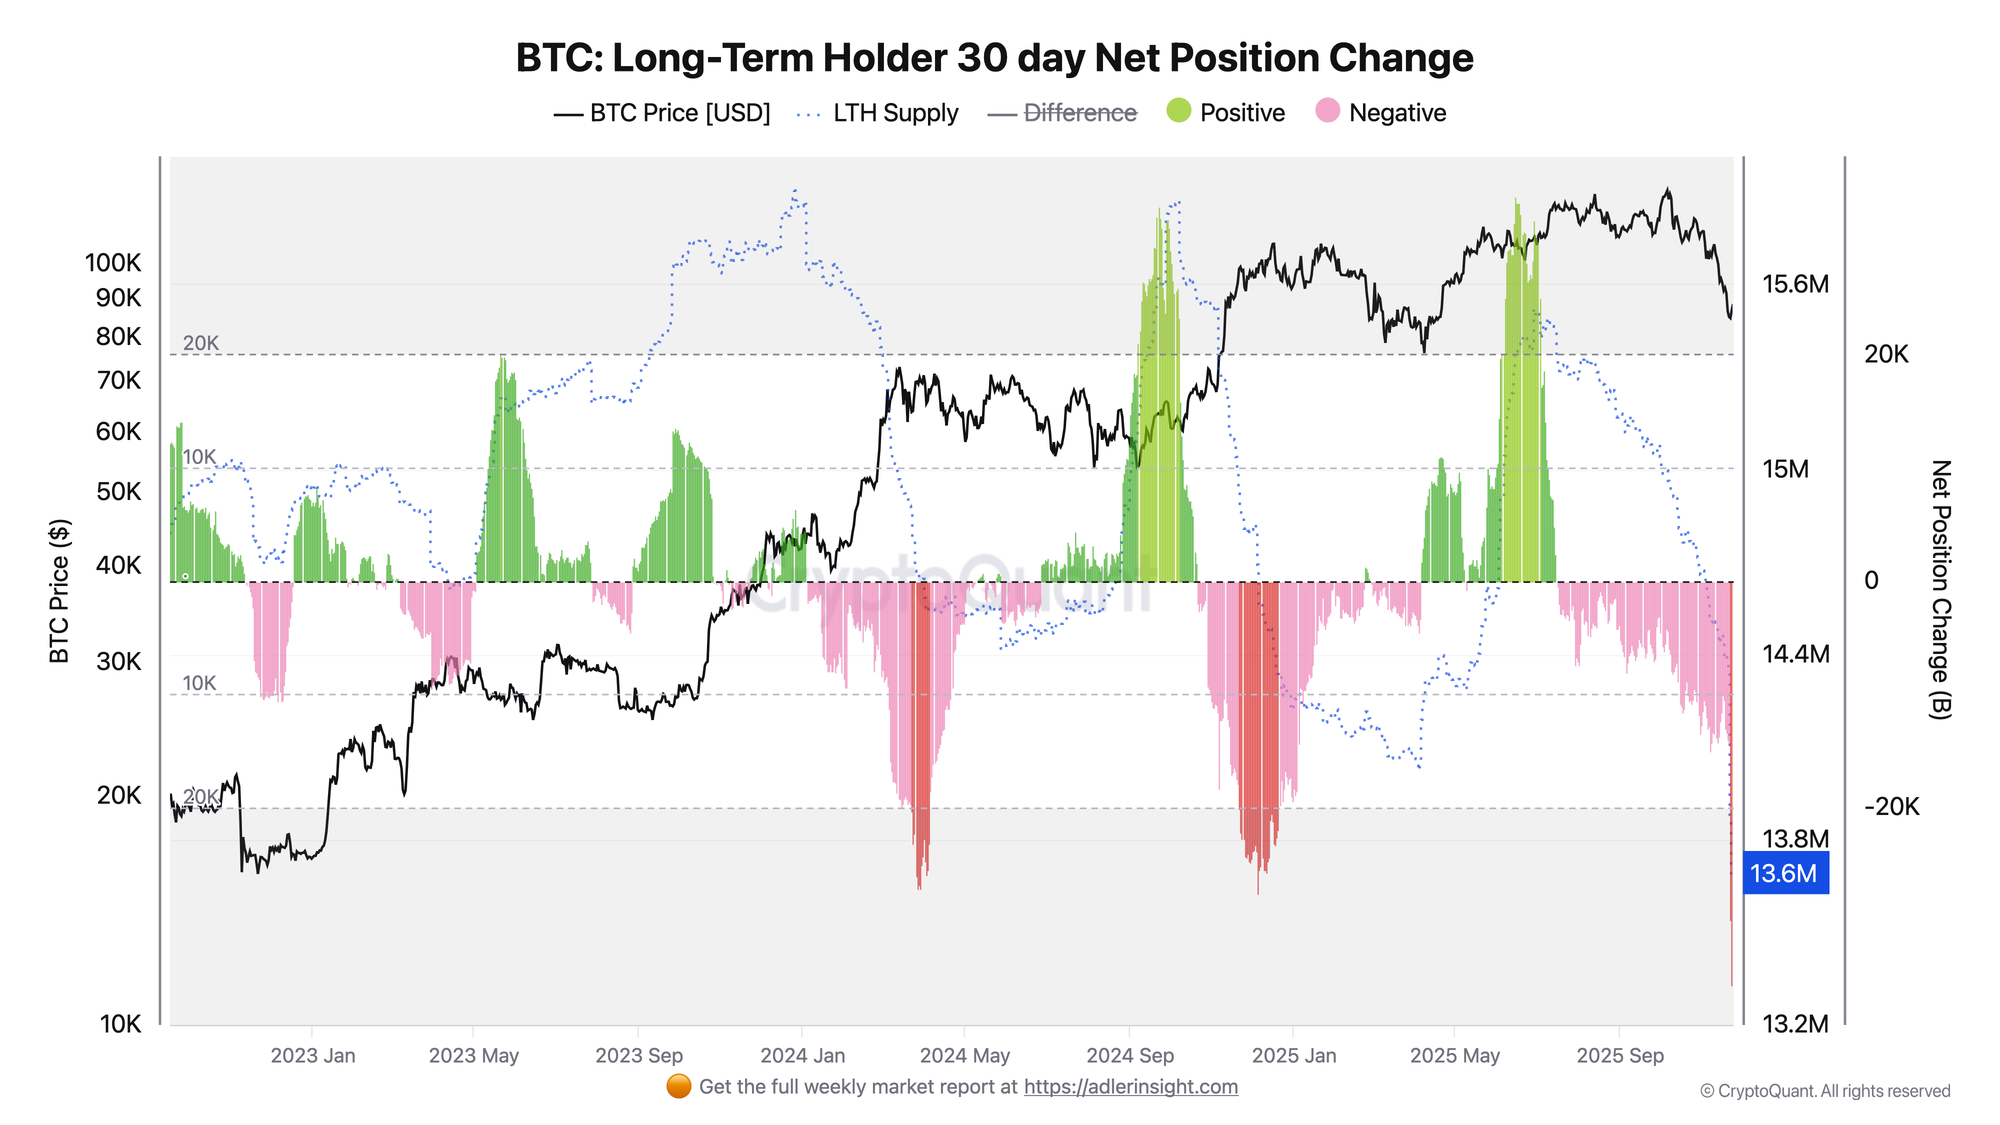
The 30-day Net Position Change of Long-Term Holders has gone deeply negative, comparable only to March 2024 (sell-off after $73K ATH) and October 2024 (ATH→$85K). The current phase shows aggressive coin dumping, with red bars reaching peak depth while price simultaneously declined from the October peak.

FAQ
What does the current LTH Supply chart picture mean?
LTH reached minimum Supply since the beginning of the bull cycle (13.6M), with experienced players actively selling coins over the last 3 months.
How to interpret chart B signals in today's context?
The extreme depth of red bars indicates peak distribution intensity. A reversal of the histogram toward the green zone will reduce selling pressure. While red bars dominate, seller pressure persists.
CONCLUSIONS
LTH are conducting the largest coin sell-off, reducing approximately 10% of reserves over the quarter.
Supply reached critical support at 13.6M BTC, while the 30-day Net Position Change records some of the deepest negative values of the bull cycle.