
Bitcoin trades below key support levels - STH Cost Basis and moving averages. Both charts confirm: short-term holders are at a loss, and the current bounce lacks structural confirmation.
TL;DR
The brief analyzes the vulnerability of the current recovery through the lens of short-term cost basis and STH MVRV. As long as both indicators point to short-term holder losses, the risk of continued correction remains elevated.
Bitcoin Short-Term Analysis and Risk Evaluation
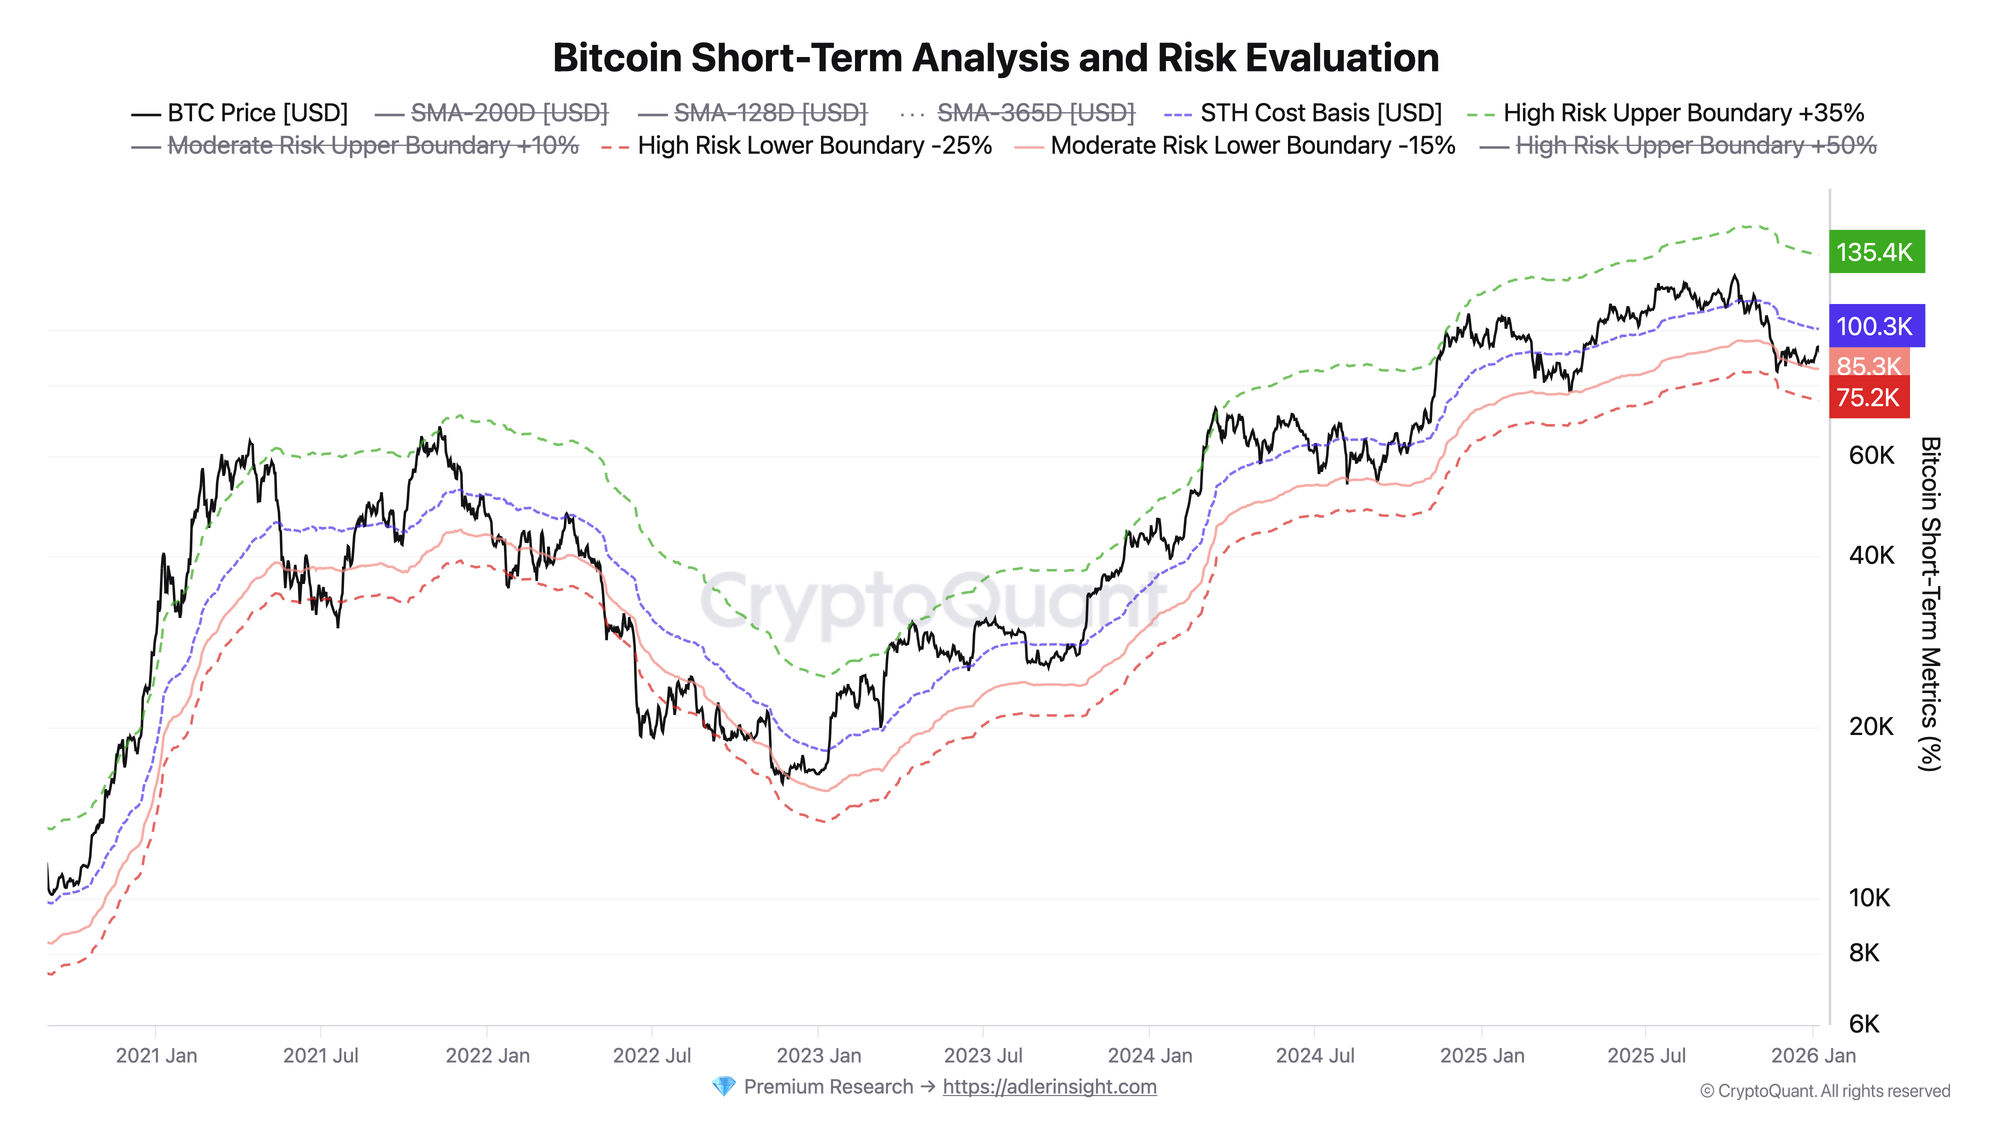
The metric shows BTC price position relative to STH Cost Basis and risk boundaries (+10%, -15%, -25%, +35%, +50%). Price is below STH Cost Basis (~$100.2K) and below all key moving averages (SMA 128D, SMA 200D, SMA 365D). The current level of ~$91K sits in the moderate risk zone, between the -15% lower boundary and Cost Basis. A return above STH Cost Basis will be the first structural confirmation of reversal. Until then, any rally remains a technical bounce within a downward structure. A break of the moderate risk lower boundary (-15% from Cost Basis) will intensify selling pressure.
Bitcoin ATH Price Tracking Euphoria Zone and STH MVRV
The metric displays the ratio of market price to short-term holders' realized price (STH MVRV) and euphoria zones at ATH updates.
STH MVRV stands at ~0.92, below the mean value (~1.09) and significantly below one. This means the average short-term holder is at approximately 8% loss. Historically, values below 1.0 were accompanied by either capitulation or prolonged consolidation. The last euphoria zone (orange vertical) was recorded at the ATH update in October 2025.
As long as STH MVRV remains below 1.0, short-term holders are motivated to sell at any bounce toward breakeven. This creates structural resistance near STH Cost Basis and confirms the signal from the first chart: the ~$100K zone is the key level that must be reclaimed for a regime change.
No time for deep analysis?
Adler Insight Light is a compact weekly Bitcoin dashboard.
Only what actually drives decisions.
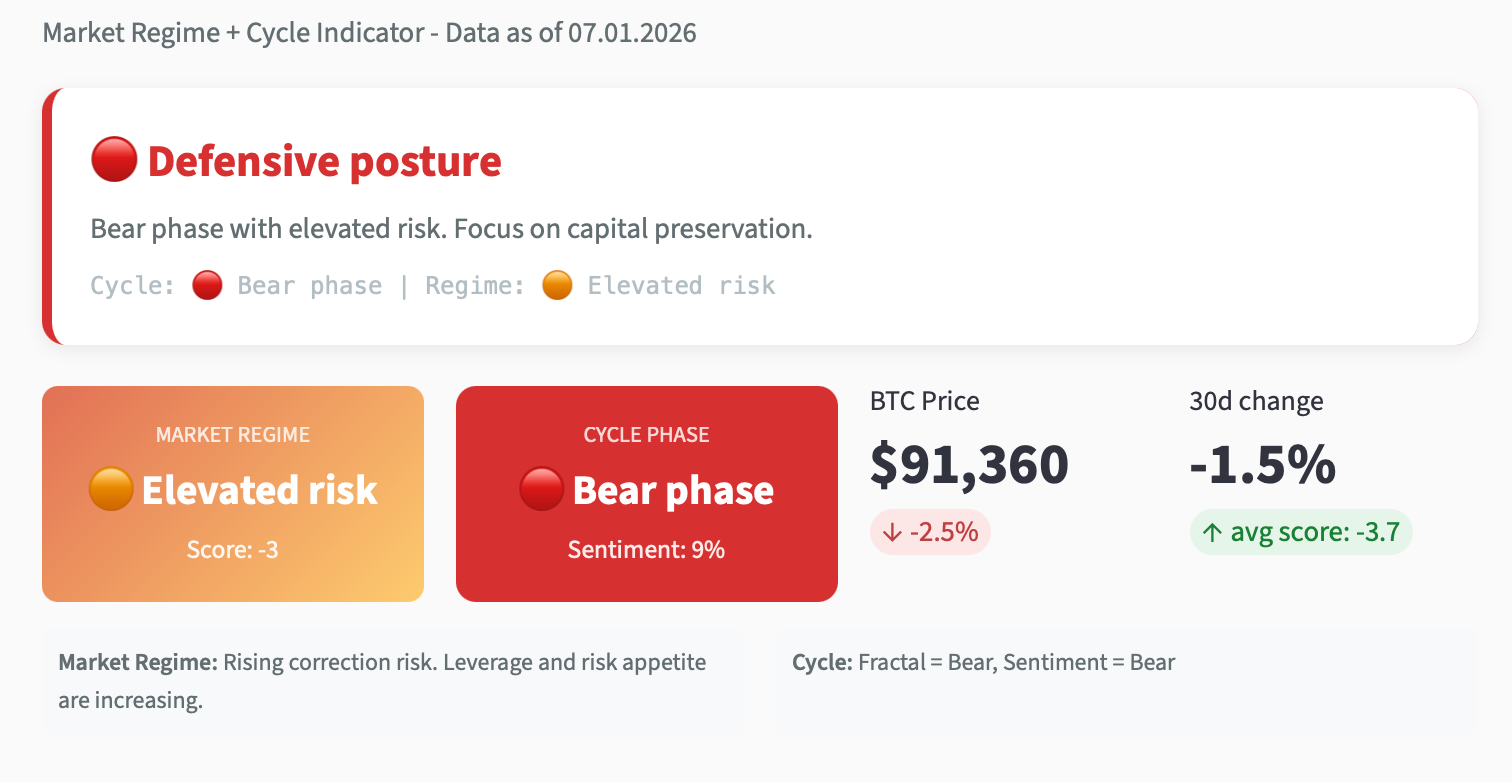
Market Regime – current market regime and structural risk
(on-chain + derivatives, consolidated into a single index).
Cycle Phase – the current market cycle phase and its practical context.
One screen. Once a week.
For traders and investors who value clarity.
→ Adler Insight Light | User Guide
FAQ
Why is STH MVRV below 1.0 important?
When STH MVRV drops below one, it means short-term holders are on average at a loss. Historically, such periods are accompanied by elevated selling pressure, as participants seek to exit at breakeven on any bounce. Sustainable growth is only possible after the indicator returns above 1.0.
What level will confirm a regime change?
A price return above STH Cost Basis (~$100K) with simultaneous STH MVRV holding above 1.0 will be the first structural signal of transition to a bullish phase. Until then, the market remains in elevated risk mode, where bounces are opportunities for loss-taking rather than the start of a new impulse.
CONCLUSIONS
Both charts point to the same picture: the market is attempting to recover, but structural conditions remain unfavorable. Price trades below STH Cost Basis, STH MVRV is below one - short-term holders are at a loss and will sell on approaches to breakeven. The regime remains risk-off until a return above $100K with confirmation via STH MVRV > 1.0. The main risk is a break of the moderate risk lower boundary, which would open the path to the high risk zone (-25%) and intensify capitulation.