
🎧 Morning Brief #104 - audio debate on today’s market setup
Two liquidity indicators confirm market weakness. SSR Oscillator has returned to negative territory after a brief move into positive in January - BTC continues to underperform relative to stablecoin dynamics. Meanwhile, the 30-day change in USDT market cap has dropped to -$2.87B, signaling liquidity outflows from the ecosystem.
TL;DR
SSR Oscillator is negative again after January's attempted recovery. USDT liquidity outflows confirm: the rebound has failed.
Bitcoin: Stablecoin Supply Ratio (SSR) 90D Oscillator
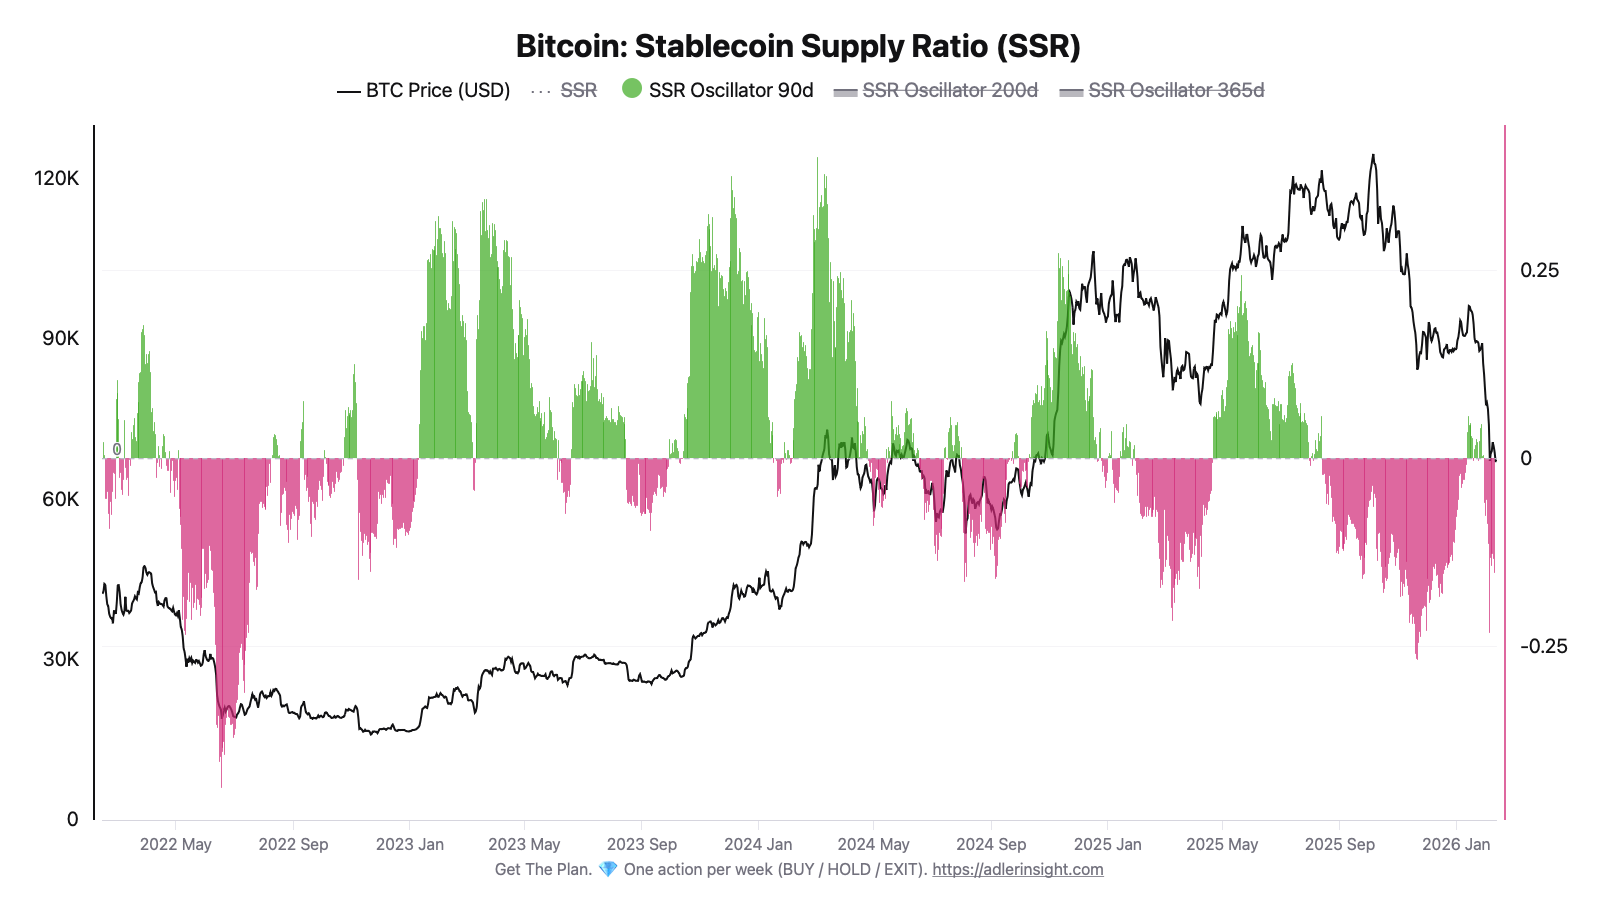
SSR Oscillator measures the deviation of current SSR from its 90-day average. Positive values (green zone) historically coincide with BTC price appreciation, while negative values (pink zone) align with periods of weakness and decline.
Since August 2025, the oscillator has predominantly remained in negative territory. In mid-January, a brief move into positive occurred - the oscillator reached +0.057, accompanied by a local price rally above $95K. However, the bounce failed to hold: by February, the oscillator returned to -0.15, and price pulled back to $67K.
Six months of pink zone dominance indicates sustained BTC weakness relative to stablecoins. The regime change trigger is a return above zero and holding in the green zone for at least 2-3 weeks. Until then, the market context remains risk-off.
Bitcoin vs USDT Market Capitalization (30D Change)
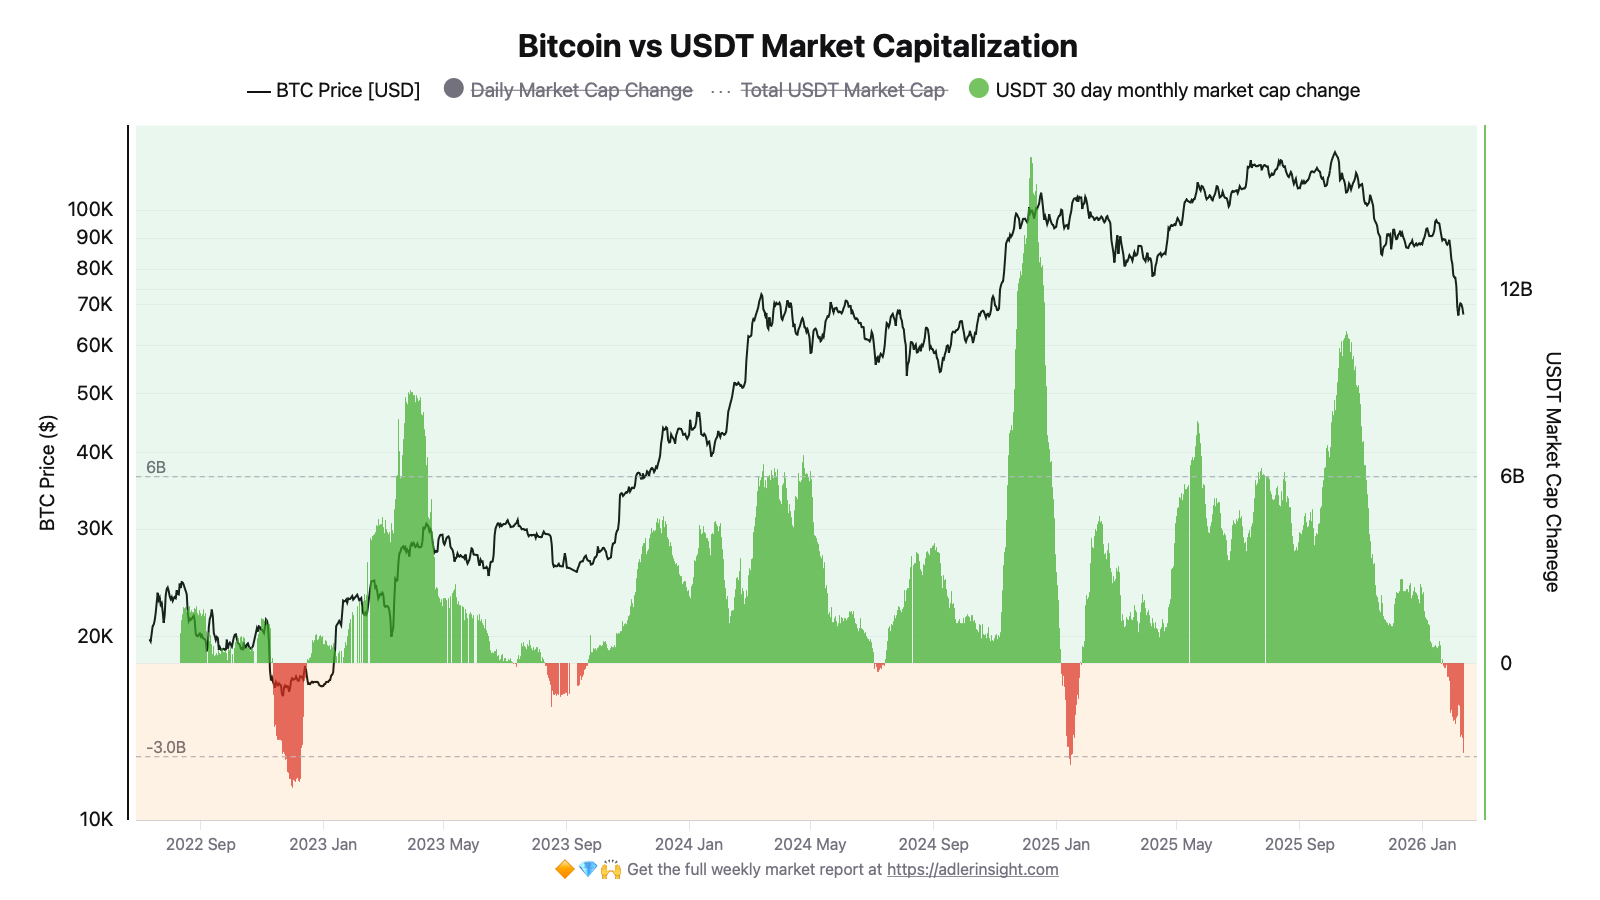
The 30-day change in USDT market cap is a directional liquidity flow indicator. Positive values signal fresh dollar inflows, negative values signal capital leaving the ecosystem.
January showed signs of recovery: 30D change moved into positive territory, reaching +$1.4B in the first week of the month. This inflow coincided with the SSR Oscillator's attempt to break into the green zone. However, the trend reversed from late January. The current reading of -$2.87B confirms renewed outflows.
The synchronicity of these two indicators is not coincidental. January's liquidity inflow supported the short-term rise in SSR and price. The return to outflows accompanied the failed recovery. As long as 30D change remains negative, a sustained SSR reversal is unlikely.
Both indicators point to the same conclusion: January was an attempted recovery, February is its failure. SSR Oscillator briefly entered the green zone amid USDT liquidity inflows, but neither signal held. The market has returned to a regime of weakness.
Headlines don’t tell you what to do.
The market is noisy and contradictory. Our system converts raw data into a clear weekly action - BUY, HOLD, REDUCE, or EXIT. → Start 7-day free access
FAQ
What does the relationship between SSR Oscillator and price show?
Historically, green bars (oscillator > 0) coincide with BTC appreciation periods, pink bars (oscillator < 0) with drawdowns or sideways action. This is a coincident indicator: it reflects the current balance of power between BTC and stablecoins, not a prediction of the future. Sustained positioning in one zone confirms the dominant market regime.
What conditions are needed for a reversal?
Two signals must align: a return of 30D USDT change to sustained positive territory (liquidity inflows) and SSR Oscillator breaking above zero and holding for at least 2-3 weeks. January demonstrated that a brief move into positive without follow-through does not change the regime - both indicators must confirm the reversal in sync.

CONCLUSIONS
SSR Oscillator has been in negative territory since August 2025; January's attempt to break into positive (+0.057) has failed - current reading is -0.15. Meanwhile, the 30-day USDT market cap change has returned to -$2.87B after January's +$1.4B inflow. The regime remains risk-off: both indicators synchronously point to weakness. The key trigger for a shift to risk-on is sustained liquidity inflows (30D USDT > 0) combined with SSR Oscillator holding in the green zone. The main risk is that continued liquidity outflows will increase price pressure and keep the oscillator in the red zone.