
Profit/loss and local stress indicators simultaneously point to market tension, but price remains above $100K.
TL;DR
The Bitcoin market is going through a second wave of extreme stress with a drop from $113K to $104K, but holds above $100K.
#Bitcoin #OnChain #Risk
Bitcoin P/L Block
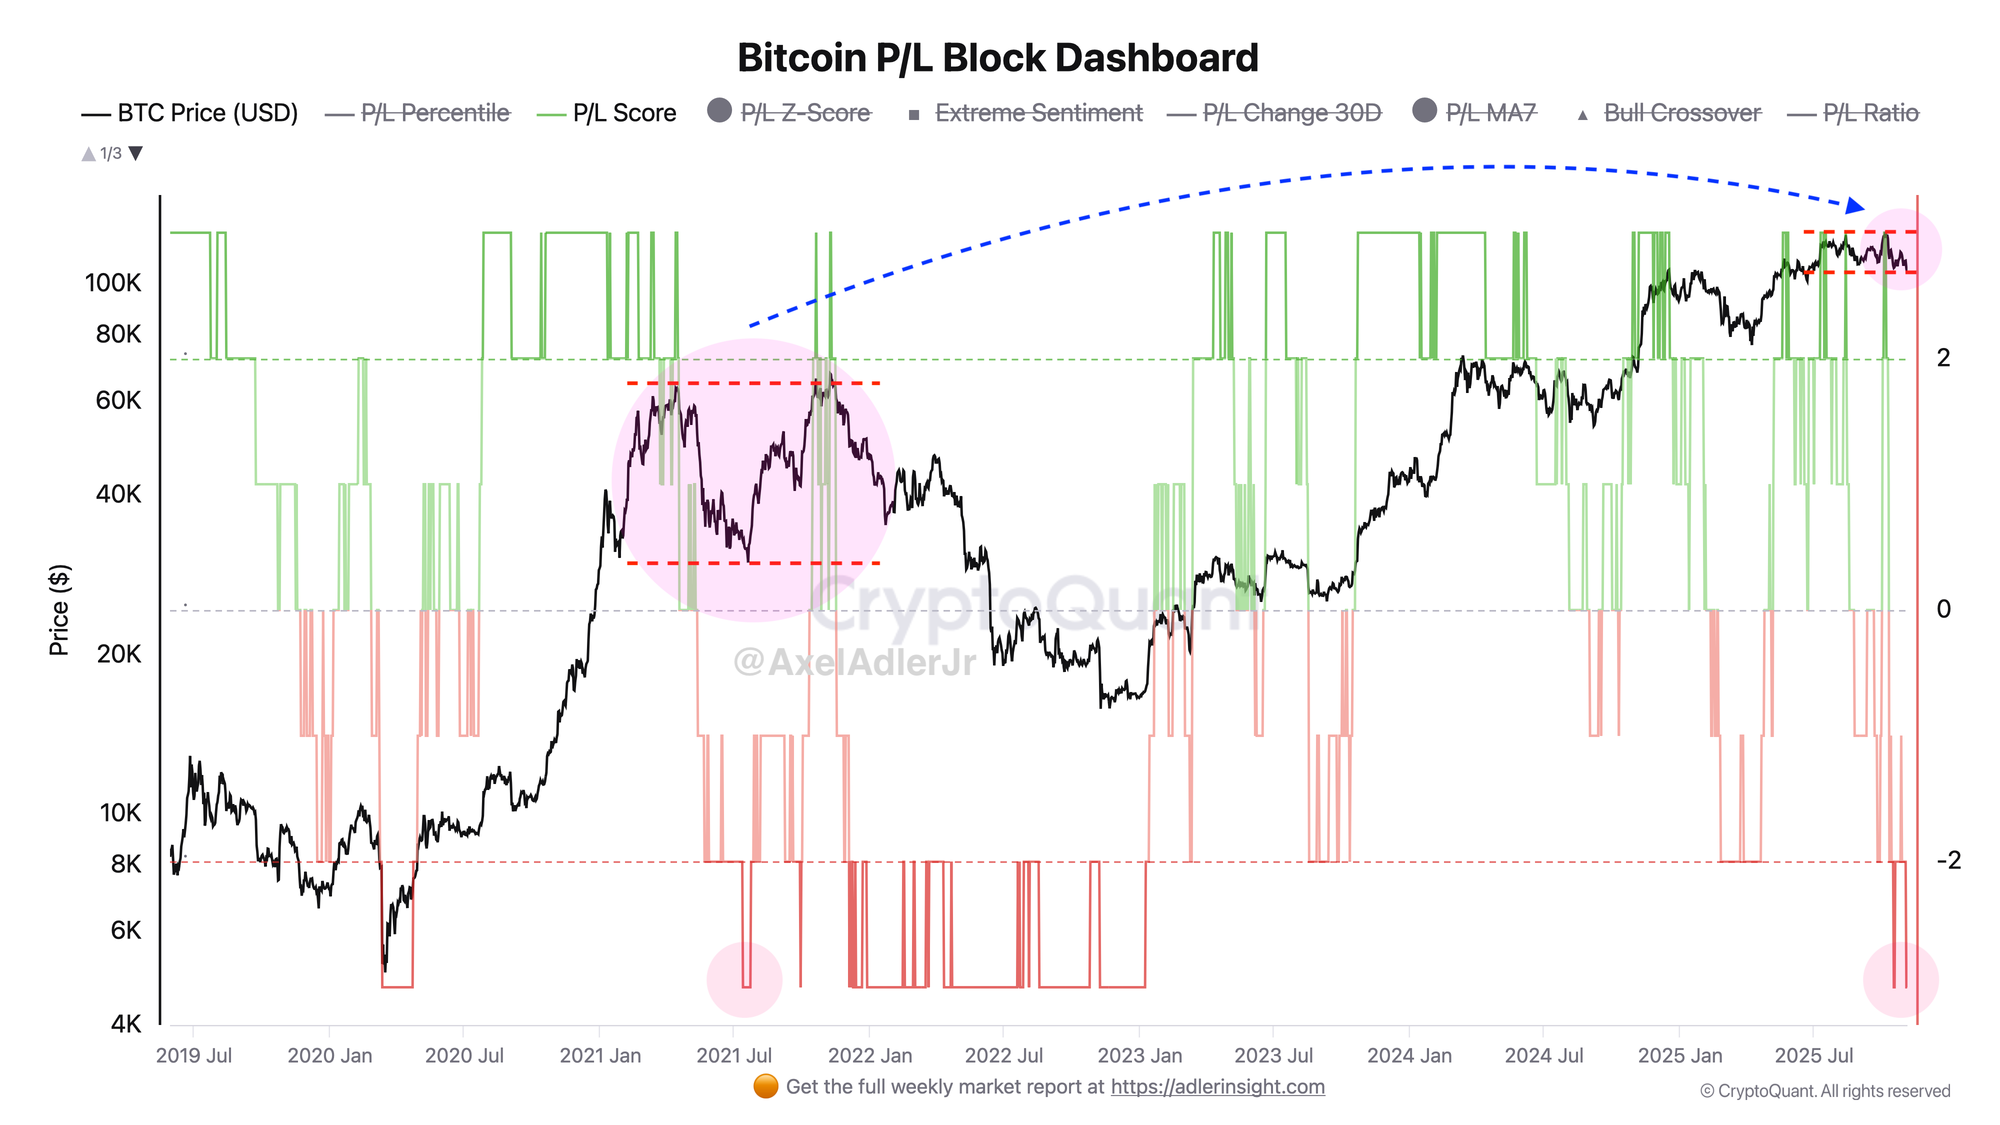
The P/L Block metric has once again reached extreme stress levels - for the second time this cycle. Unlike 2021, when similar stress led to Bitcoin's price falling from $63K to $30K (-52%), the market is now demonstrating notably greater resilience: with similar indicators, the price holds above $100K. A regime change upward will require weakening of extremes and price stabilization above the medium-term range.
Bitcoin Local Stress Index
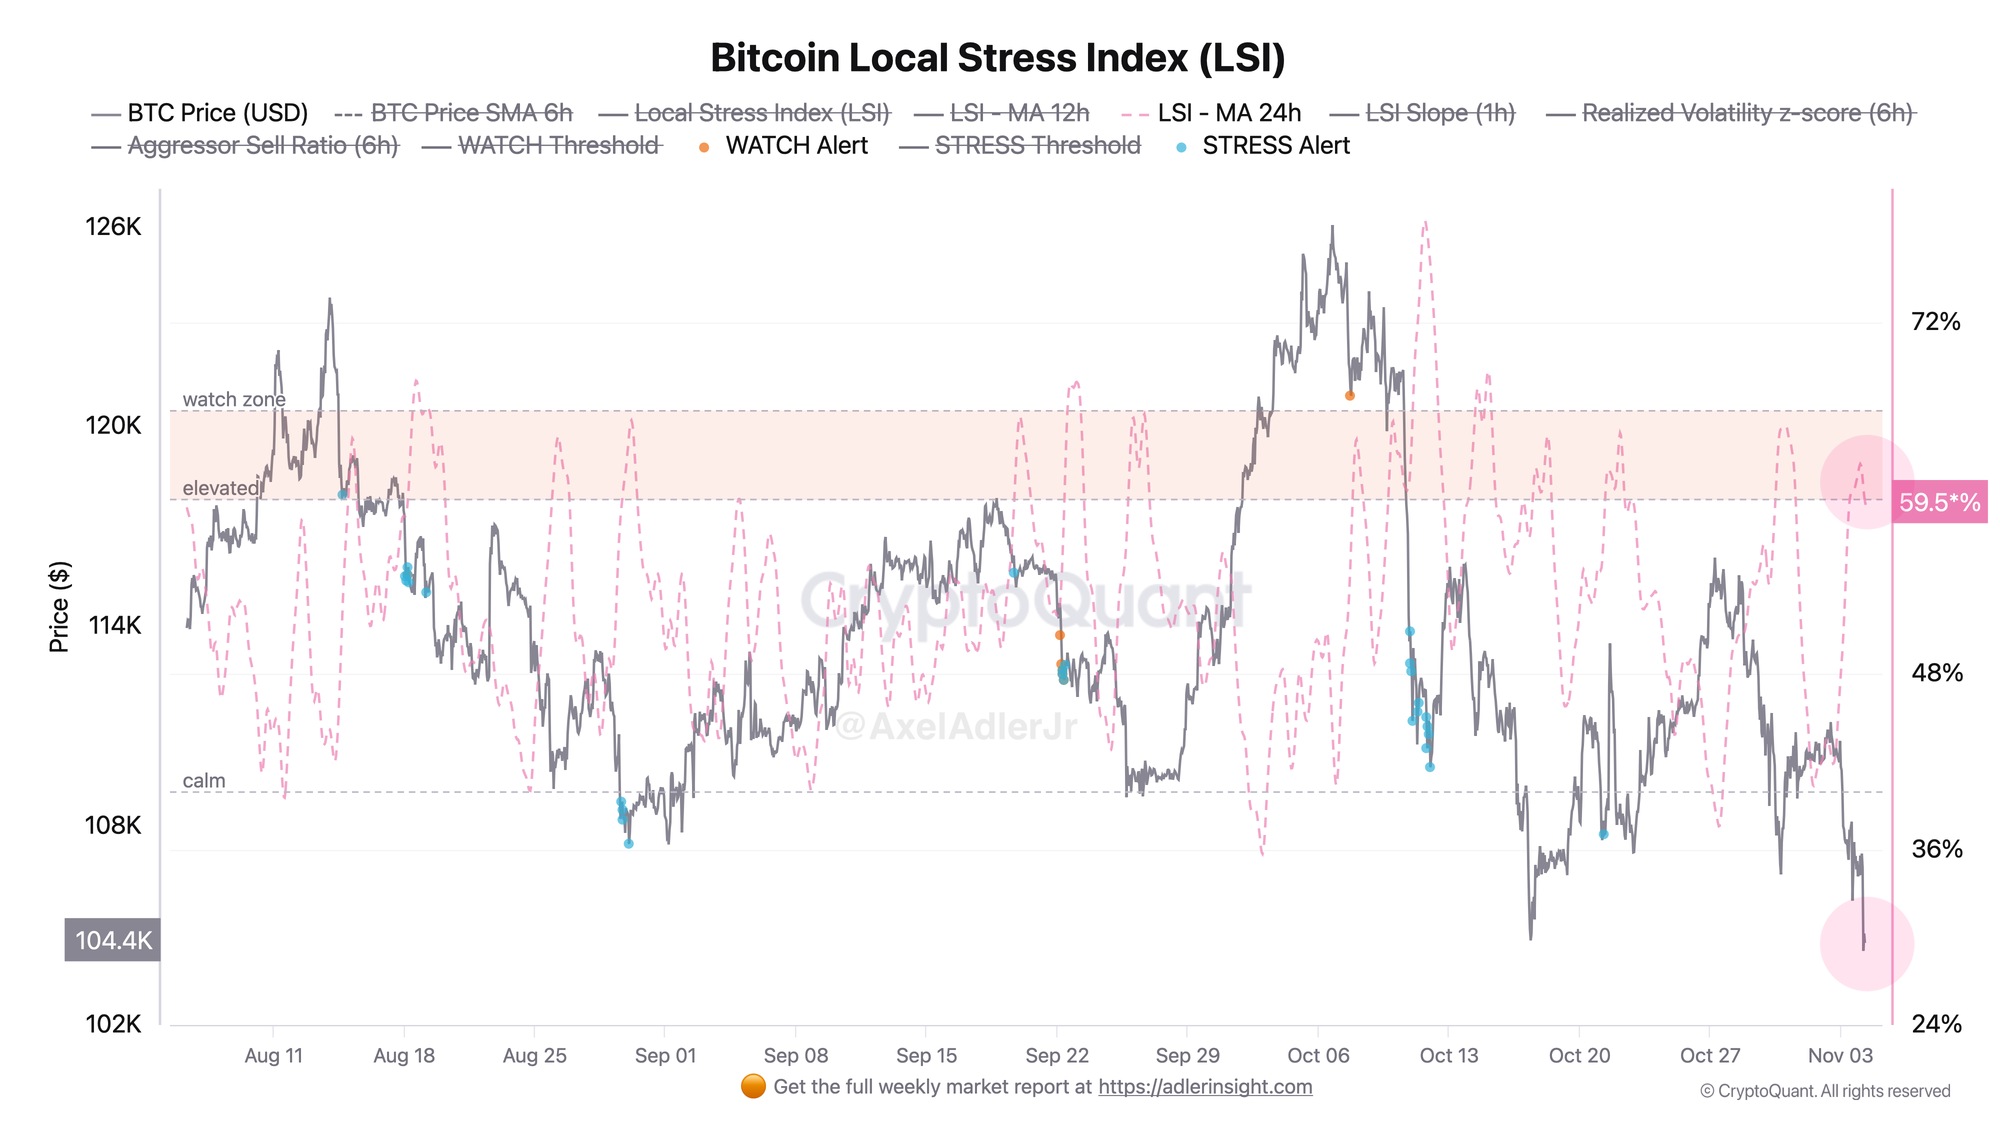
Over the past week, the Bitcoin market experienced two distinct periods of heightened stress. The first wave occurred on October 28-30, when LSI reached extreme values of 74-75% amid a price drop from $113K to $106K, accompanied by high realized volatility and aggressive selling (ASR >0.52). Short-term relief came on October 31 - November 1, when the index dropped to 30-40% and price recovered to $110K, however this proved to be merely a respite before a new wave of selling. The second stress wave began on November 2 and continues to the present. LSI again rose to critical 67-73% amid strengthening bearish signals: price trades below the 6-hour SMA, realized volatility remains elevated (RV z-score >5), and the aggressive sell ratio stays above 0.51.
As of 8:00 UTC November 4, LSI stands at 58.6% (ELEVATED state), price has dropped to $104K. The market demonstrates structural weakness with growing leverage and negative liquidity flow, indicating sustained seller pressure.

FAQ
What does the current picture on the Bitcoin P/L Block chart mean?
Repeat of P/L extreme without deep price capitulation - the market is redistributing risk but not breaking structure above $100K.
How to interpret the Bitcoin Local Stress Index chart signals in today's context?
LSI around 59.5% - elevated stress. Below 48% - window for bounce, above 72% - risk of accelerated decline.
CONCLUSIONS
Base scenario: attempt to stabilize above $100K conditional on LSI declining to 36–48% and weakening of P/L extremes, which will open path to test $110–112K. Invalidation - LSI grows toward 72% and price consolidates below $100K with expanding volatility.