
Bitcoin experienced a shock. The market structure index fell into negative territory
TL;DR
The bullish structure is damaged, the market structure index fell to −8%. If the index rises above zero in the next 3-5 days and stress decreases, a recovery scenario opens up. However, if stress rises again and selling intensifies, the base scenario is sideways movement with downward bias and risk of retesting recent lows.
#BULL #BEAR #BTC
Bitcoin Bull–Bear Structure Index
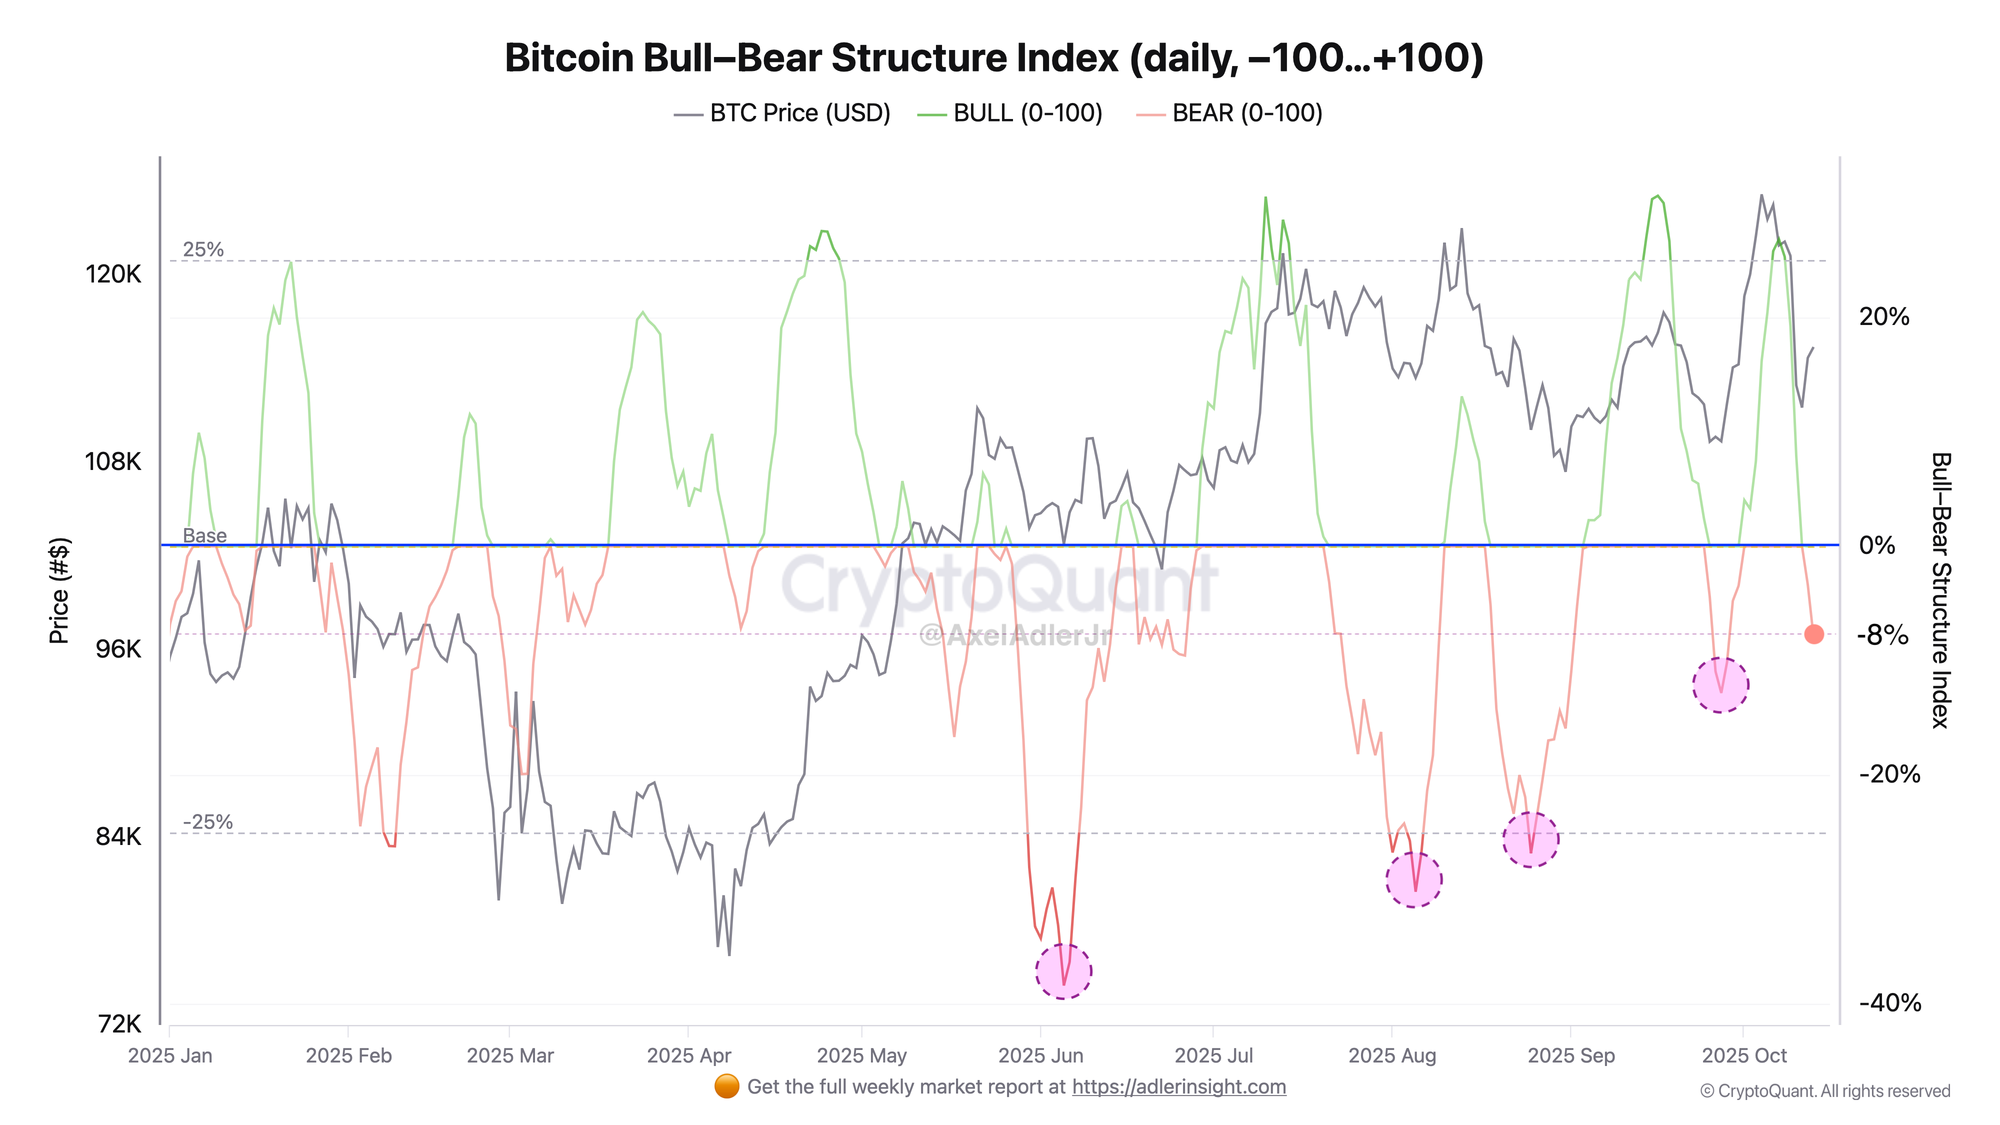
Market structure has switched to "bearish" mode. Bull–Bear Structure dropped into negative territory to −8% as the market experiences dominance of spot selling and derivative deleveraging after the crash. However, the depth of the drop is noticeably less than previous lows and stress spikes in August-September, meaning we're seeing structure damage, not a complete cycle breakdown.
If the index holds above zero for 3-5 days in a row amid derivative neutralization and spot inflows, growth may resume. If the indicator drops lower, a continuation of bearish mode with downward bias emerges along with the risk of retesting new lows.
Bitcoin Local Stress Index
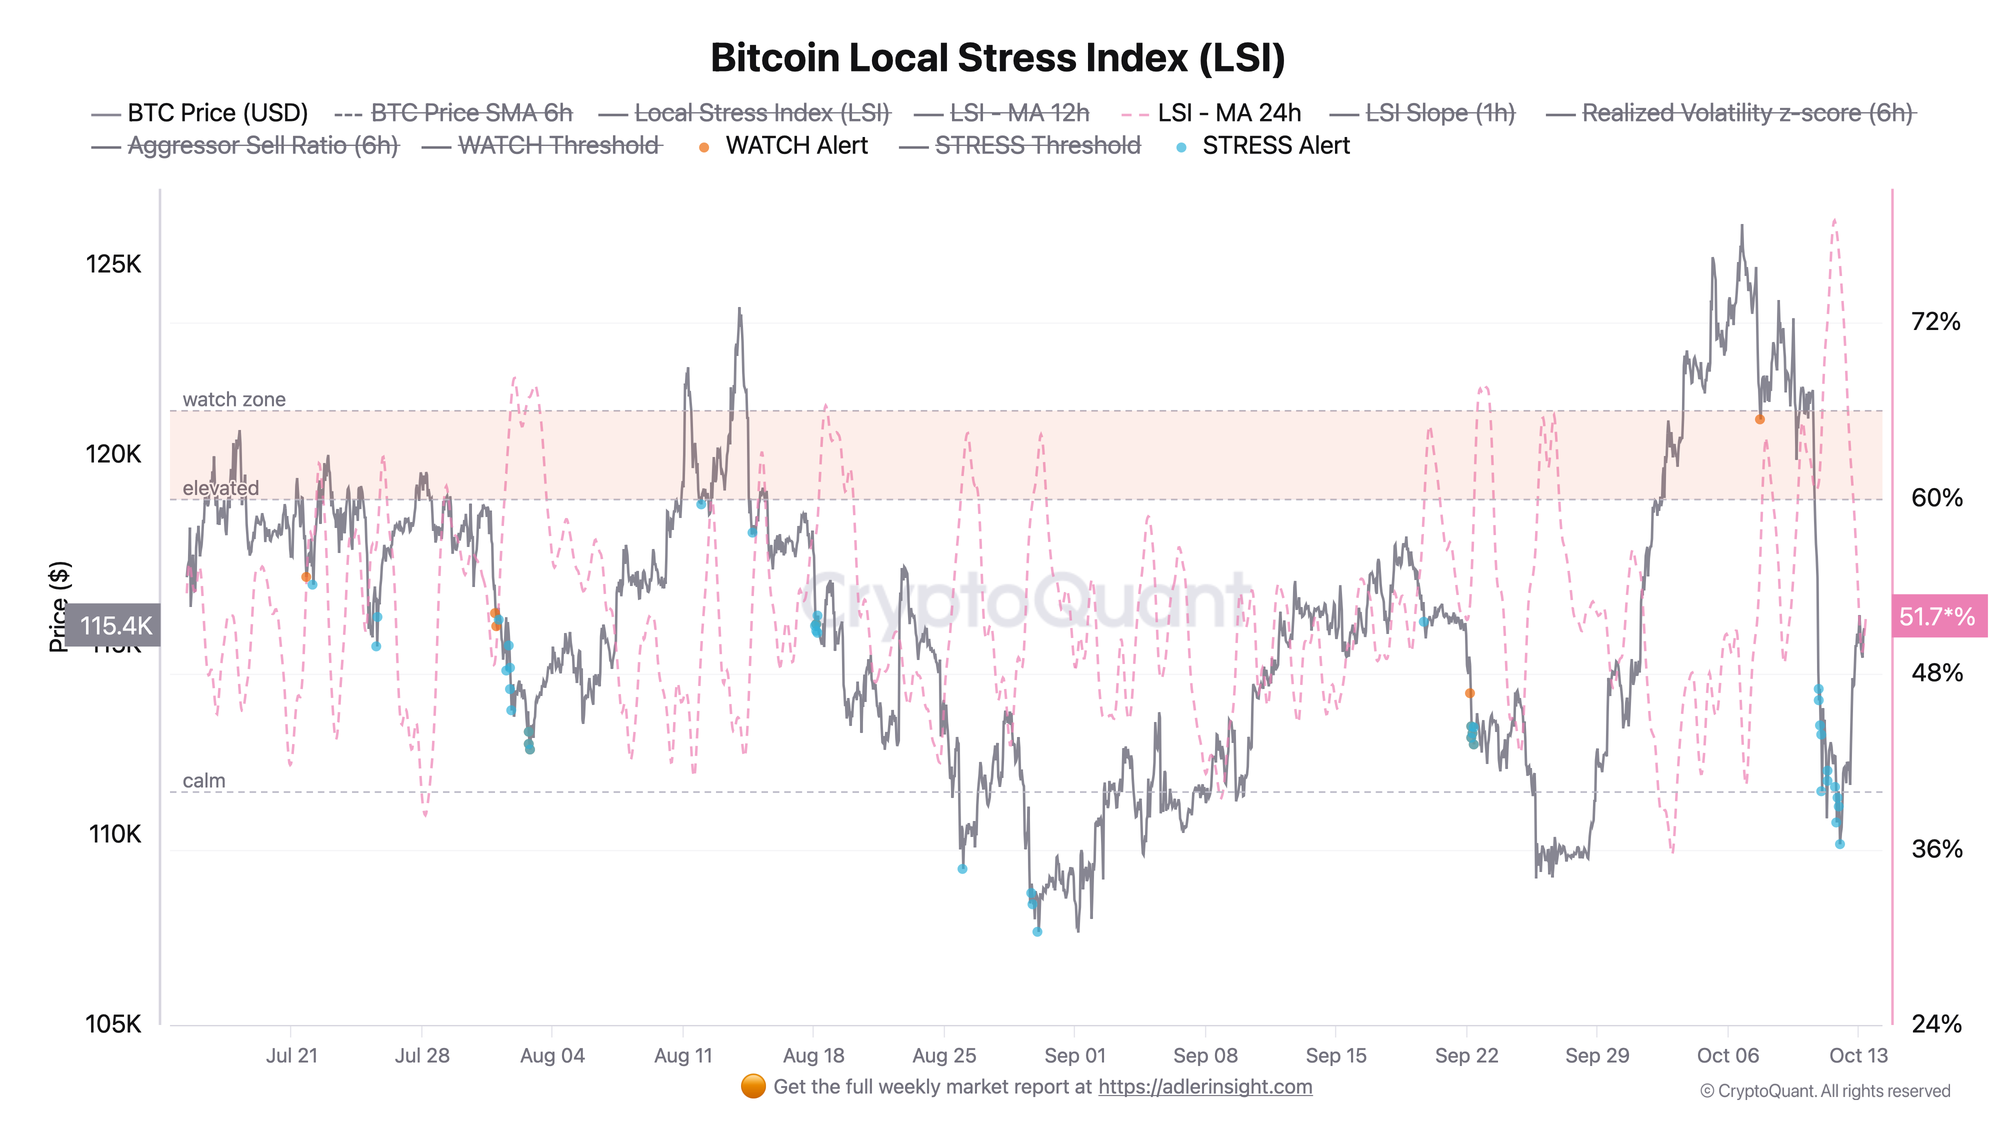
The 24-hour smoothed curve shows how the shock from Friday's selloff affected the market: the risk spike has passed and the curve now holds in the middle zone around 52%, below the dynamic watch threshold of 60%. Volatility remains elevated, but seller momentum is not intensifying.
Going forward, the key marker is the metric's slope relative to the 60% watch threshold. Consolidation >60% and curve growth together with intensifying aggressive selling will increase the risk of a second wave down. If the metric reverses and moves toward the 45% range with fading volatility, the scenario shifts toward gradual structure recovery.

FAQ
What does the market structure drop to −8% mean?
The metric registers seller dominance and deleveraging, but this is milder than June/September drops. More "structure damage" than cycle breakdown.
When does the Local Stress Index warn of a second wave of decline?
Currently the metric is below the dynamic threshold. Risk of a second wave grows when rising above 60%.
Conclusions
Friday's shock changed the regime to moderately bearish: the market structure metric dropped into negative territory at 52%. The nearest fork: market structure index consolidation >0 with declining local stress will confirm a chance for recovery. A repeated index decline to the −20% zone together with rising stress will indicate continued bear dominance with risk of testing local lows.