
🎧 Morning Brief #0092 - audio debate on today’s market setup
Market Pressure Index hit a new 30-day low, dropping to 30.54, below the extremes of January 21 and 25. Yet price remained stable around $88.3K. Price structure confirms the critical zone: BTC trades in the lower 17% of the Donchian channel near $86.4K support.
TL;DR
New 30-day pressure low, but price held. Buyers absorbing supply at key support.
Bitcoin Price Structure
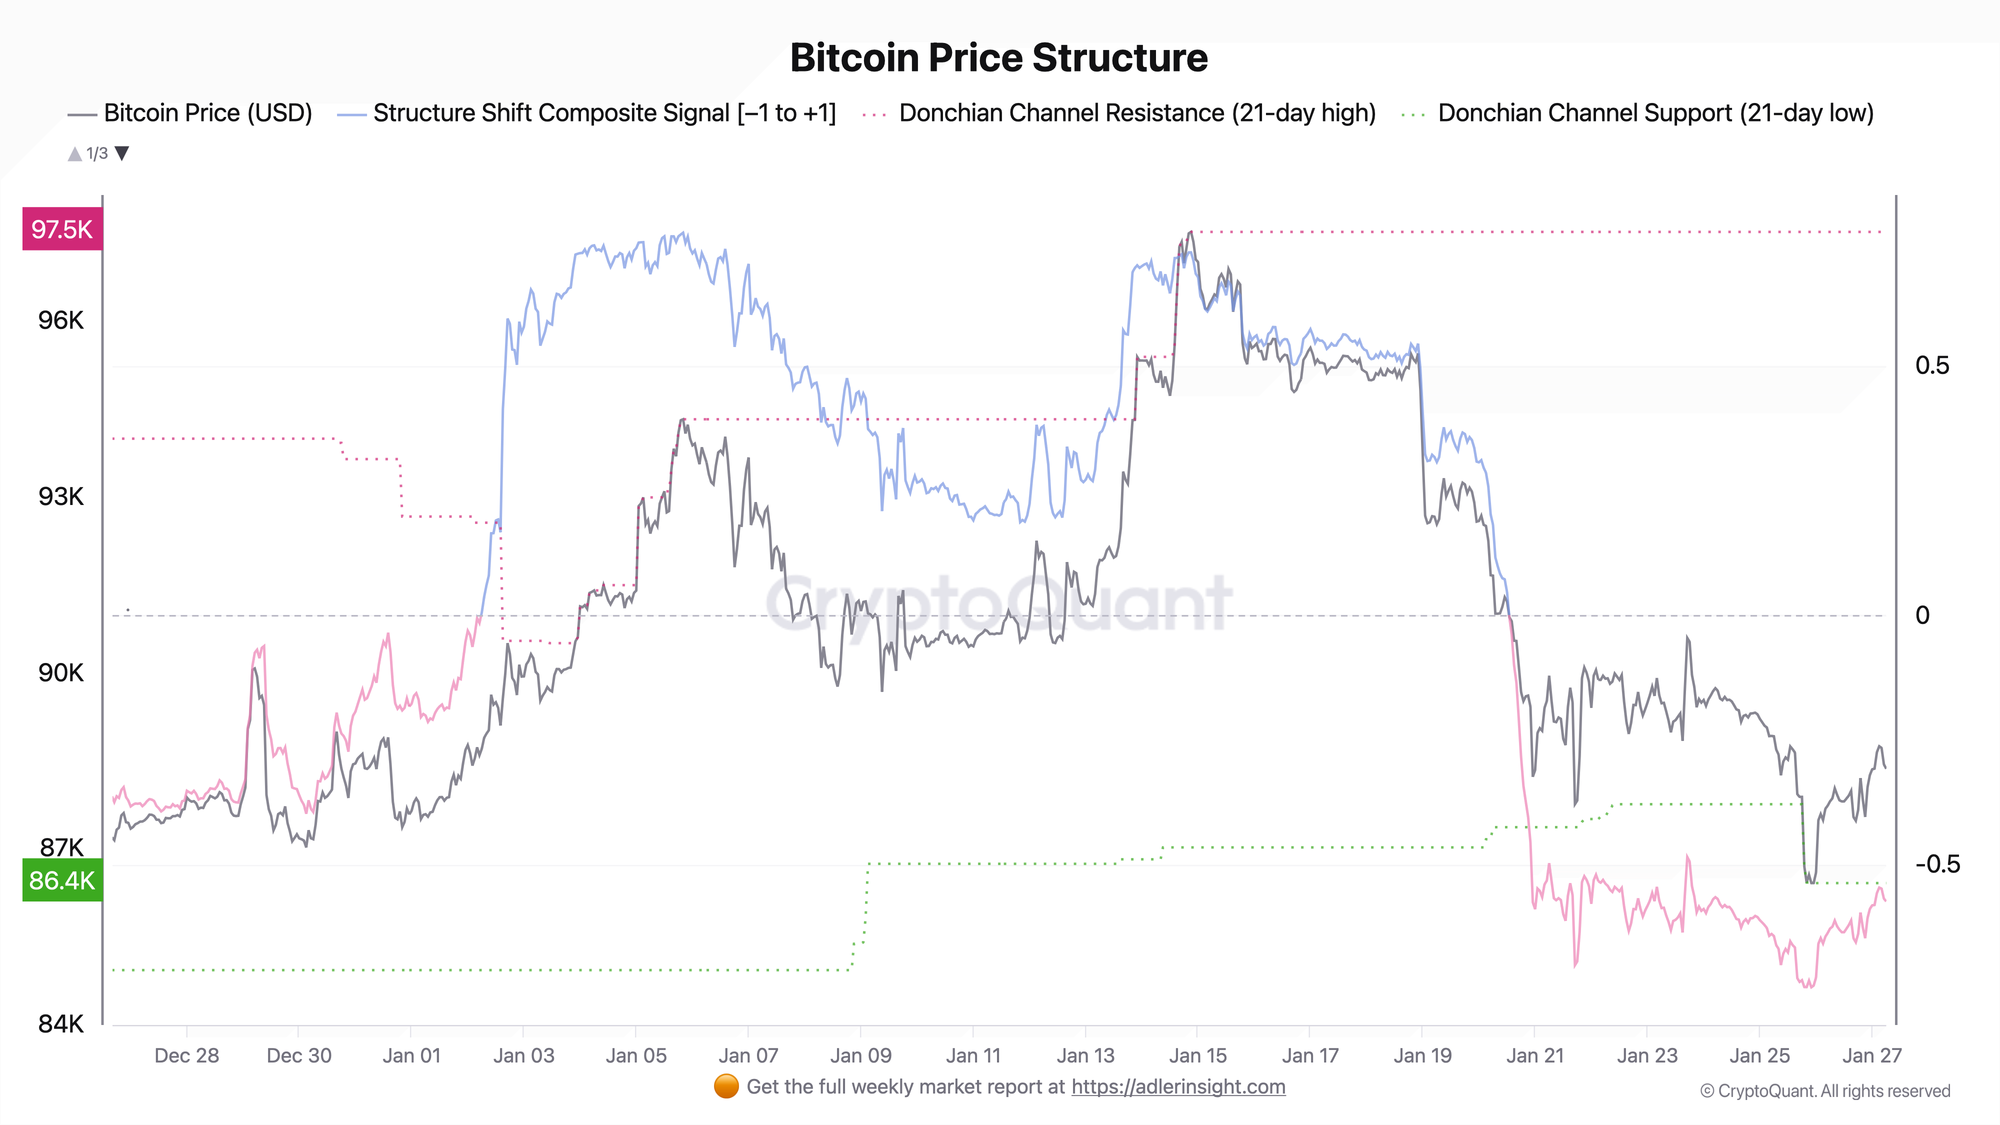
Price Structure is a composite model combining price position within the 21-day Donchian channel, EMA trend direction, and price bar sequencing to determine the market's structural regime.
At the current price of $88.3K, Bitcoin trades at 17.5% from the channel's lower boundary, practically at the $86.4K support. Resistance sits at $97.5K, implying roughly 10% upside potential, while the buffer to support is less than 2.5%. Structure Shift Index reads -0.57 within the [-1, +1] range, indicating a persistently bearish structure.
A 17% channel position with Structure Shift at -0.57 marks a decision zone. The key level is $86.4K support: a breakdown opens the path to channel reassessment lower, while holding creates a base for potential reversal.
Bitcoin Derivatives Market Pressure Index
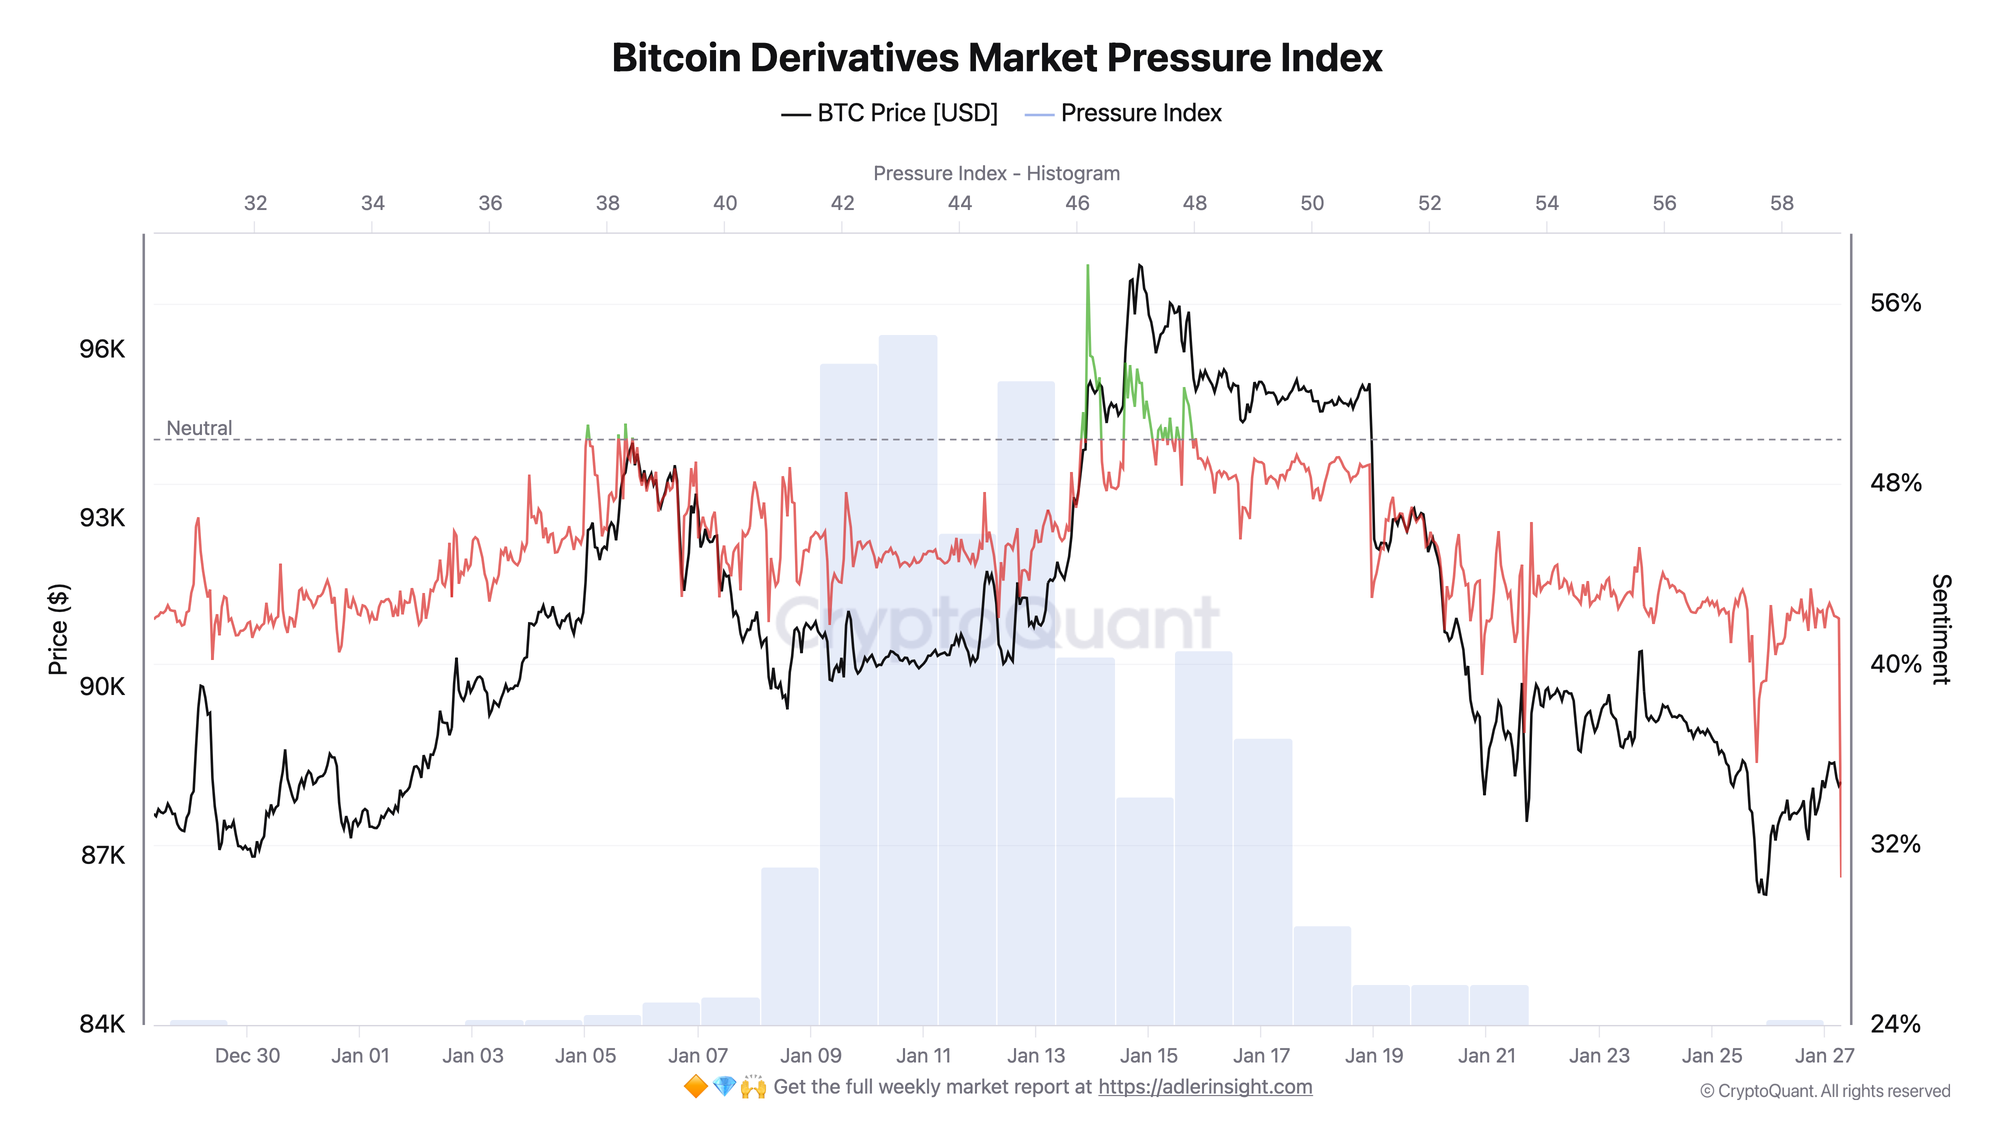
Market Pressure Index is a normalized composite of price, cumulative 6-hour net taker flow, Open Interest, and volume delta, calibrated over a 365-day window for signal robustness.
On January 27 morning (07:00 UTC), the index collapsed to 30.54, a new absolute 30-day low, below previous extremes of January 25 (35.63) and January 21 (36.95). The collapse occurred within one hour, a 12-point drop. Price barely moved: $88.2K to $88.3K.
Critical divergence: pressure at an absolute extreme, yet price does not fall. This means one of two things: either buyers are actively absorbing supply at current levels (a sign of base formation), or the market is accumulating energy for a sharp move down upon support breach. Absence of price reaction to extreme pressure is an atypical situation requiring heightened attention.
The two charts form a picture of tense equilibrium: Price Structure shows price at support (17% of channel) with broken structure (-0.57), Pressure Index shows a new 30-day low (30.54) with no price reaction. Sellers attack with maximum monthly intensity but meet resistance. This is either a sign of strong support or the final pause before capitulation.
This brief is only 10% of the picture. The full version shows where the market gives you an edge - and where it’s better to stay out. So you don’t buy tops or sit through drawdowns.
FAQ
Why isn't price falling under such pressure?
The divergence between extreme pressure and stable price indicates the presence of a large buyer absorbing supply. This could be institutional accumulation, OTC deals, or short covering. However, such divergences are unstable: if the buyer steps back, accumulated pressure will translate into a sharp move down.
What matters more to track: Price Structure or Pressure Index?
For timing, Pressure Index and its divergence with price provide a leading signal. For direction, Price Structure: a breakdown of $86.4K support or Structure Shift returning above -0.3 will define the next phase. Currently both indicators are at extremes, a zone of maximum uncertainty and maximum opportunity.
CONCLUSIONS
Market Pressure Index reached a new 30-day low of 30.54, below all previous January extremes. Yet price remained stable around $88.3K, creating an atypical divergence. Price Structure confirms the critical zone: 17% from the channel's lower boundary, Structure Shift at -0.57, $86.4K support within 2.5% of current price. Interpretation is twofold: either buyers are forming a base by absorbing record seller pressure, or this is the calm before a breakdown. Risk-off regime with an element of uncertainty: extreme pressure without price reaction is a rare pattern. The main trigger is reaction to $86.4K support: holding with Pressure Index reversal above 40 confirms base formation, breakdown with accelerating pressure signals transition to capitulation.