


After 87 days in negative territory, the 30-day change in realized capitalization turned positive. By September 6, the indicator had reached +0.88%, while the price premium’s deviation from its monthly norm had narrowed considerably following the August spike.
TL;DR
Realized capitalization is rising, supporting the price recovery. The extreme momentum has eased. The main question today is whether capital growth will continue.
Bitcoin: Realized Cap Relative Net Position Change
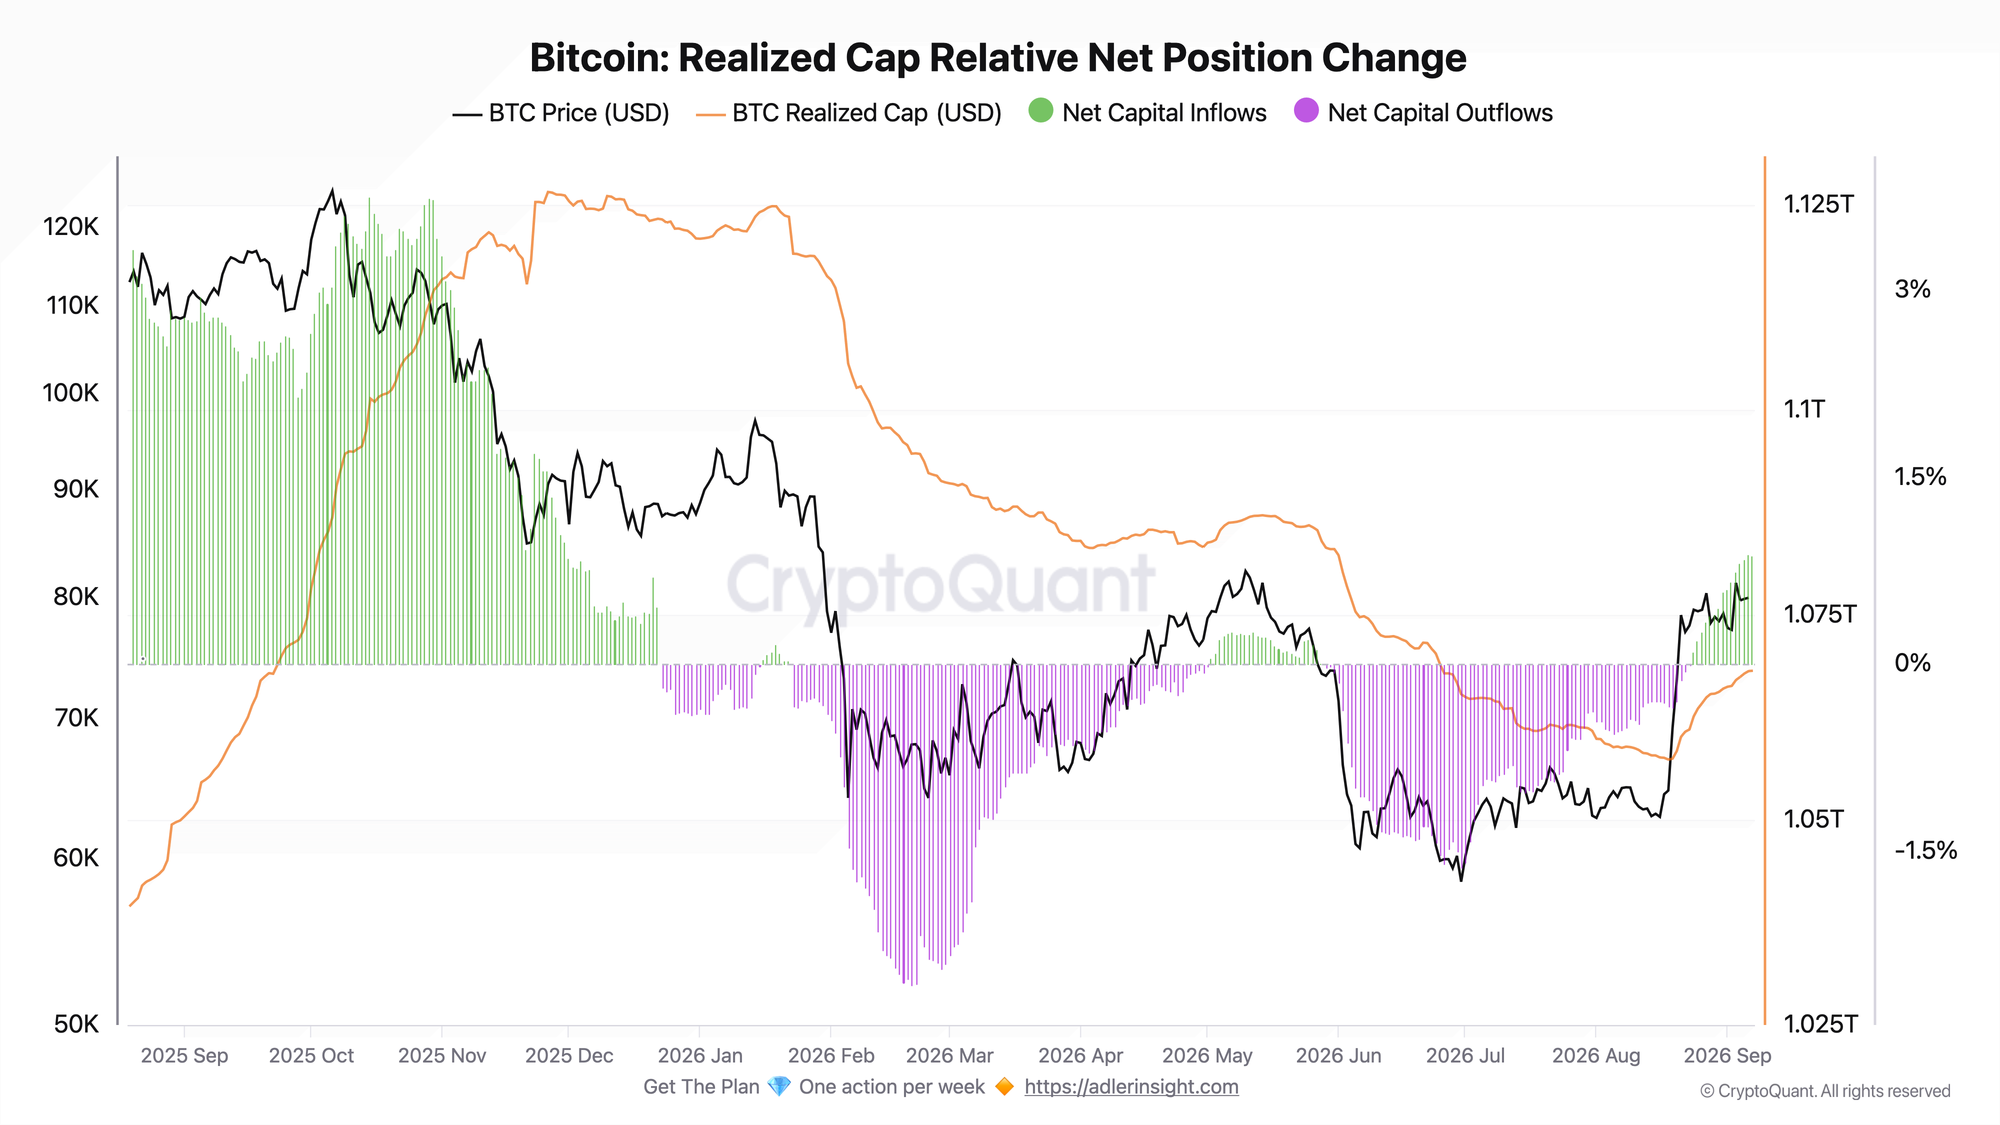
On the right side of the chart, purple bars have given way to rising green bars, while the orange realized capitalization line has turned upward. The indicator crossed above zero on August 24 after 87 days in negative territory and rose from +0.10% to +0.88% by September 6. Realized capitalization reached $1.068 trillion, increasing by $9.36 billion over 30 days. It continued to rise through the recent price fluctuations around $80K.
This confirms an improvement in realized capitalization after a prolonged contraction. However, the chart also shows a brief move into positive territory in May, followed by another decline. A sustained recovery requires the 30-day change to remain positive alongside further growth in realized capitalization itself. A return below zero would weaken this signal.
Bitcoin Realized Premium Z-Score
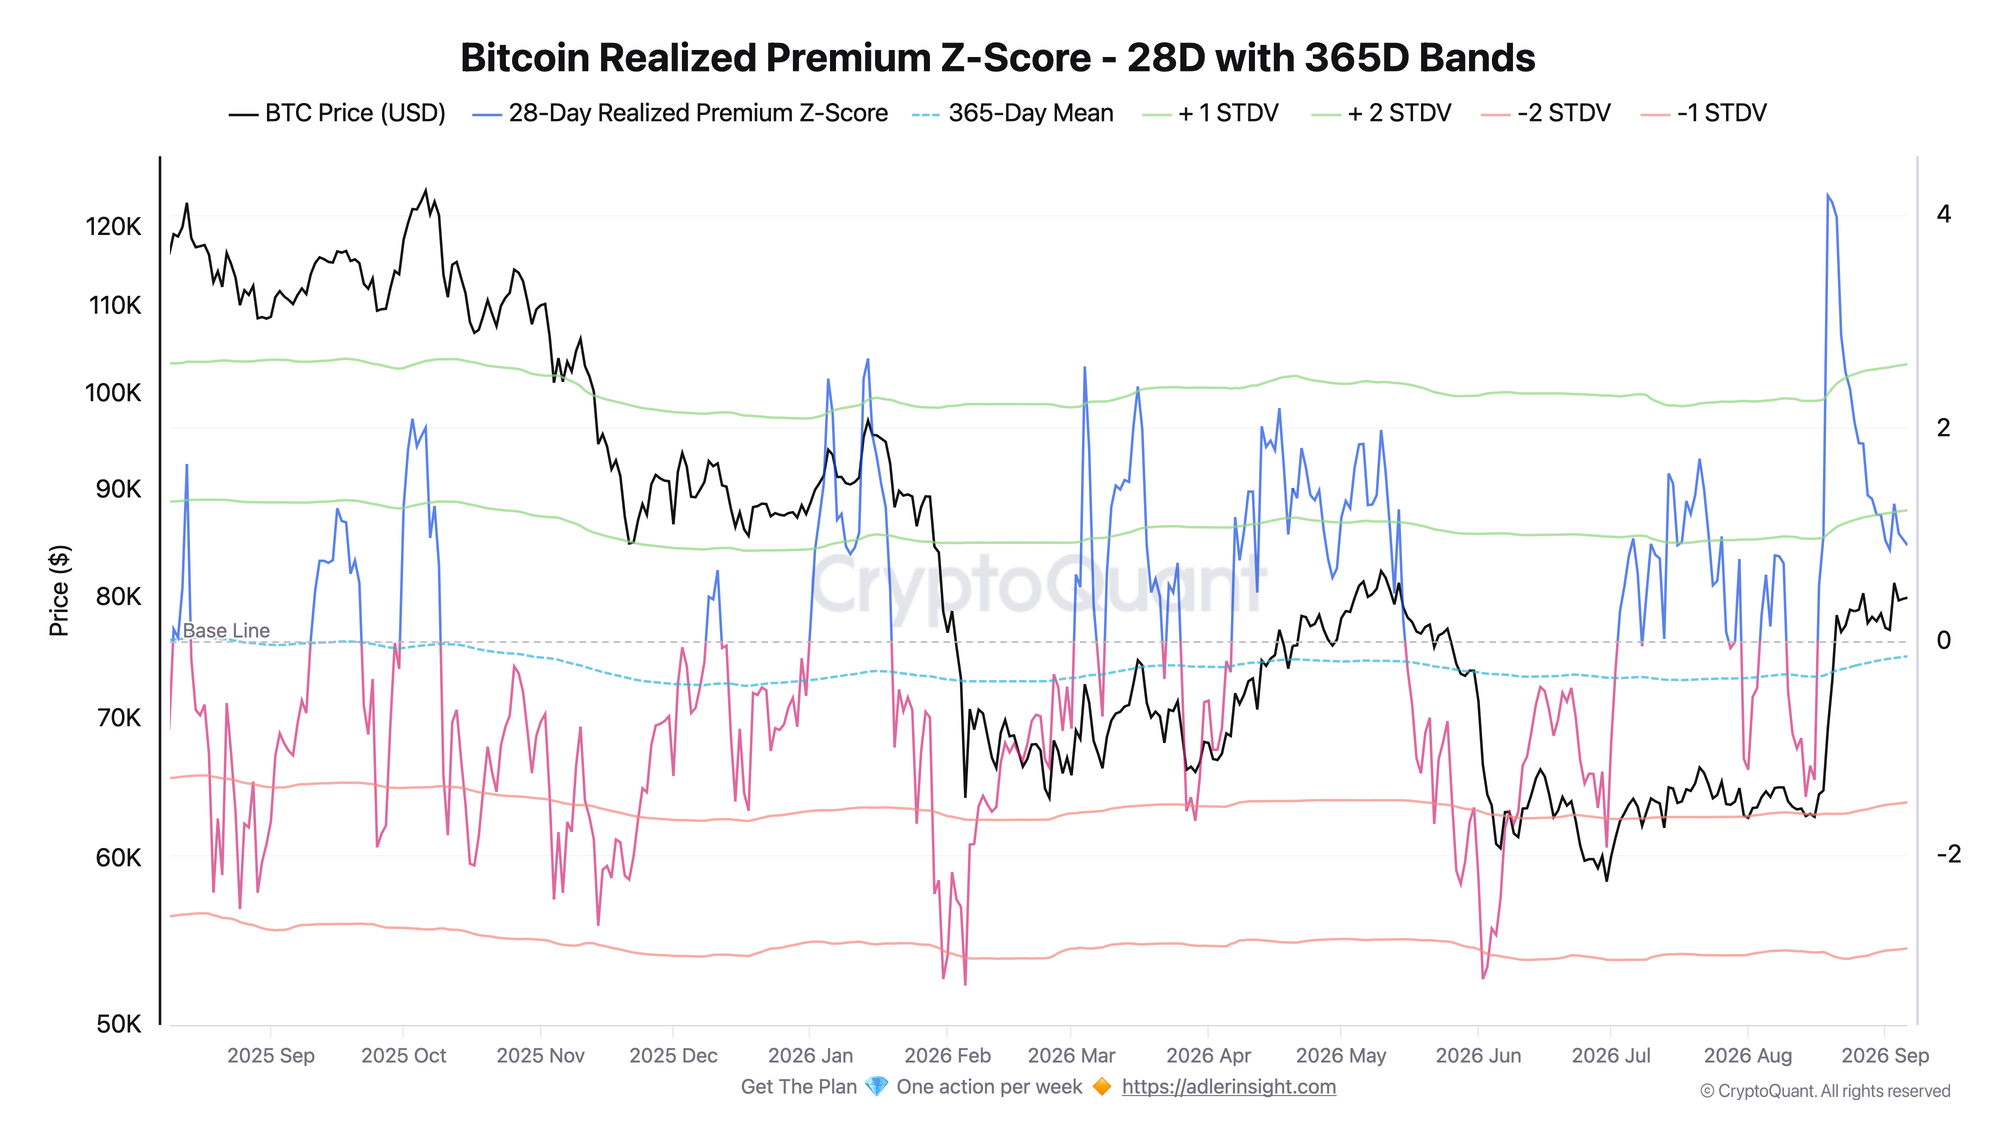
Realized Premium Z-Score shows how far the ratio of market price to realized price deviates from its norm over the past 28 days. Realized price reflects the average on-chain cost basis of coins. A reading above zero means this ratio is above its recent norm; conversely, a reading below zero means it has fallen below that norm.
On August 19, the metric surged to 4.17 as the price jumped. By September 6, the indicator had declined to 0.90 but remained above zero. Meanwhile, bitcoin is holding around $80K, well above its levels before the August rally.
The sharp spike has given way to calmer price action. A decline in the indicator alone does not mean a price downturn has begun: new price levels gradually feed into the calculation and become less unusual relative to the past 28 days. The two charts show that price is holding on to most of its gains while realized capitalization continues to increase, supporting the recovery.
FAQ
Can the $9.36 billion increase in capitalization be considered a direct cash inflow? No. It is an increase in the value of the supply calculated using the prices at which coins last moved, rather than a record of money entering the market. The metric reflects changes in the aggregate on-chain cost basis, so equating it with spot buying volume would be incorrect.
What would confirm that the recovery is sustainable? The 30-day change remaining above zero while realized capitalization continues to rise. A repeat of May’s pattern, with a quick return to negative territory, would cast doubt on the recovery’s sustainability.
CONCLUSIONS
Realized capitalization rose 0.88% over 30 days, while the premium’s standardized deviation declined from its August extreme to 0.90. The combined signal is moderately positive: the recovery is accompanied by a rising on-chain cost basis of the supply, but these charts do not yet confirm a sustained bullish regime. Continued growth in realized capitalization is the main condition for further improvement; the primary risk is a repeat of May’s pattern.
Live Charts
Explore the metrics behind this brief with live, auto-updating charts:
Realized Price - Aggregate on-chain cost basis compared with BTC price and long-term trend.
MVRV Ratio - Market value vs realized value to identify valuation regimes and cycle risk.
Realized Price Bands - Dynamic realized-price valuation zones from live BTC price and on-chain cost basis.
CVDD - Cumulative Value Days Destroyed as a deep-value floor and historical accumulation band.