
The current market calm has reached levels that often precede price breakouts from narrow ranges. Periods of extremely low volatility reflect a state of balance between supply and demand, after which the market typically transitions to an active liquidity redistribution phase and range expansion.
TL;DR
Realized volatility has compressed to levels that statistically rarely persist for extended periods. This structural compression creates conditions for an increased probability of price breaking out of the current range, however it does not determine the direction of movement by itself and is not a trading signal.
Bitcoin Realized Volatility
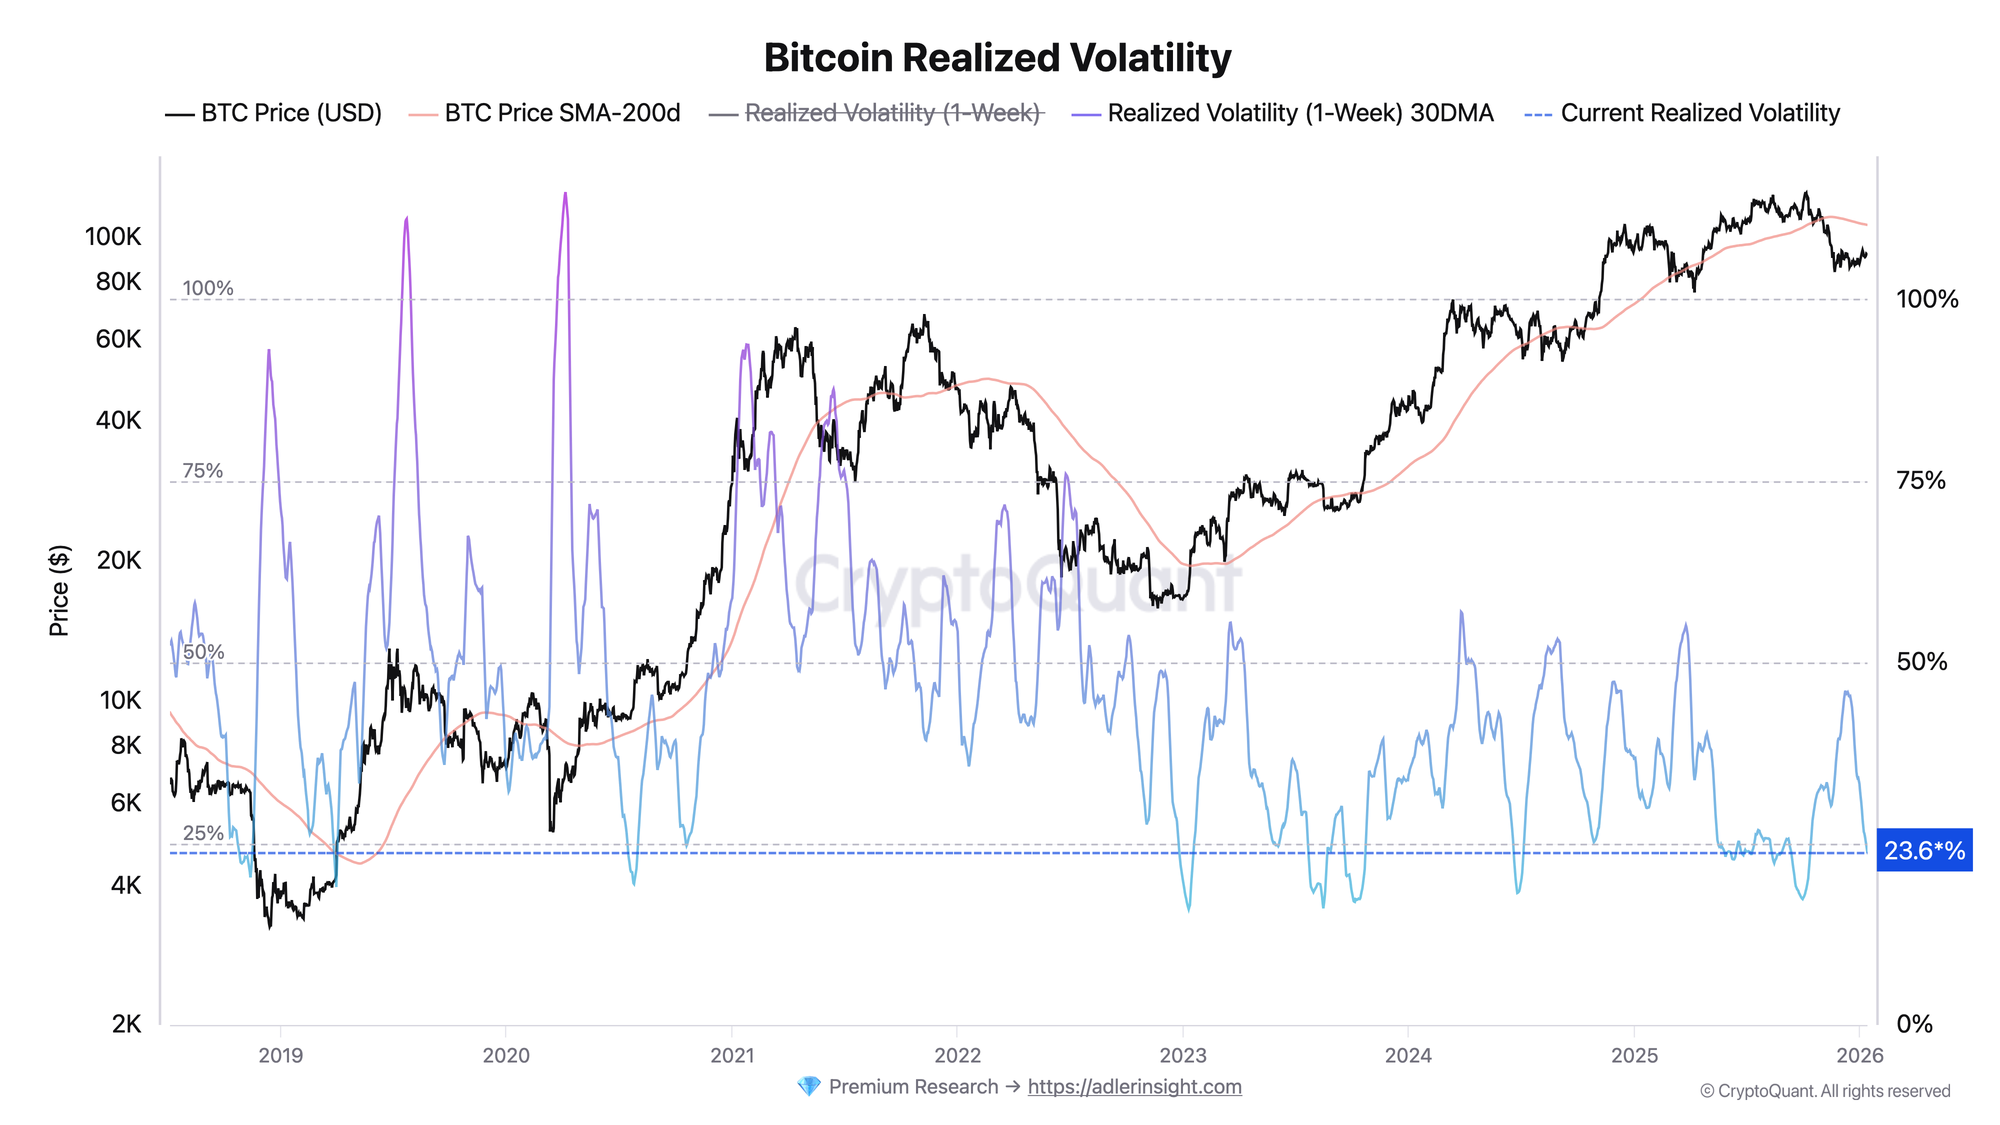
Current Realized Volatility values are near the lower distribution zones for this market cycle and are comparable to periods of reduced volatility that were observed before significant moves throughout the entire observation period. This indicates not the direction of future movement, but rather a reduction in oscillation amplitude and a temporary weakening of impulse dynamics.
Looking at history, such regimes are rarely sustainable over extended periods. As imbalances between supply and demand accumulate, the market typically transitions from a compression phase to a range expansion phase.
Bitcoin 30-day Price High and Low All Time
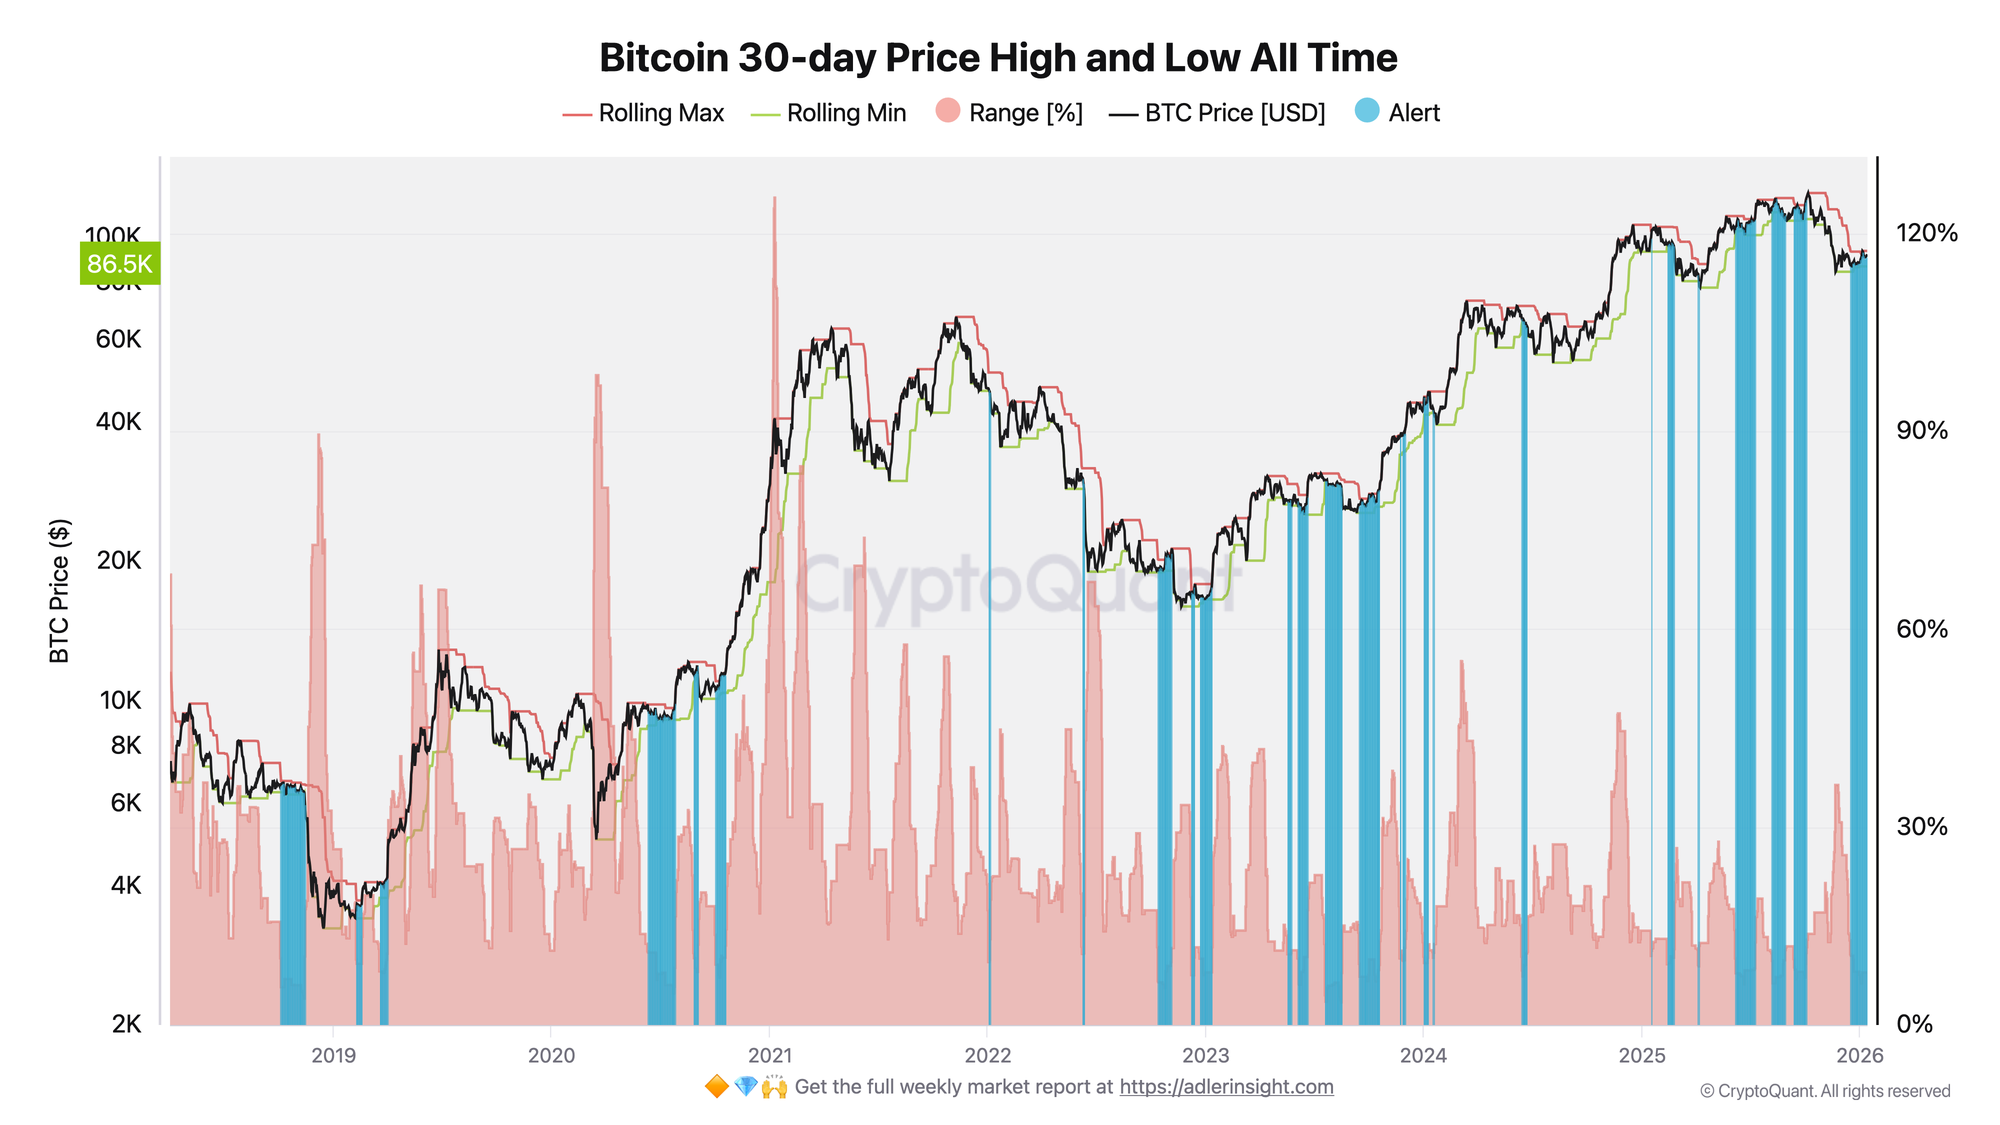
The 30-day highs and lows indicator confirms structural range compression: the distance between Rolling Max and Rolling Min continues to narrow, while the percentage range (Range %) remains near local minimums. This indicates a reduction in intraday and interday oscillation amplitude and the absence of sustained dominance by either side of the market.
This metric is important from a market structure perspective, since price breakouts beyond the 30-day range are often accompanied by increased activity from algorithmic and trend-following strategies. Combined with volatility data, this suggests not a guaranteed breakout, but rather that the market is approaching a phase where the probability of directional movement increases.
This brief is only part of the system.
Full access to the Biticon strategy and Deep Research is available in the 7-day trial.
FAQ
Why is low volatility considered a risky regime?
Prolonged volatility compression is often accompanied by increased market sensitivity to external triggers. Under such conditions, even moderate liquidity flows can cause a disproportionate price reaction, which increases the probability of sharp moves.
What will confirm the start of a move?
A more reliable confirmation of a regime change will be a sustained price breakout beyond the current 30-day range (Rolling Max/Min), accompanied by realized volatility expansion above its 30-day average.
CONCLUSIONS
The aggregate data indicates a phase of deep market compression: realized volatility is near 23.6%, and the price range remains tight. Such regimes more often conclude with a transition to range expansion, however they do not determine either the direction or magnitude of future movement by themselves. Under current conditions, the key risk lies not in predicting direction, but in the market's elevated vulnerability to sharp impulses following an exit from the local consolidation phase.