
🎧 Morning Brief #0098 - audio debate on today’s market setup
After declining to a local minimum on January 19, exchange reserves have started to grow. This is happening against the backdrop of price falling from $97K to $76K - a classic signal of coins transitioning from holders to the market.
TL;DR
Exchange reserves reversed from lows and increased by 34K BTC over two weeks. Supply growth amid weak price action is a negative signal for short-term dynamics.
Bitcoin: Exchange Netflow (Total) - All Exchanges
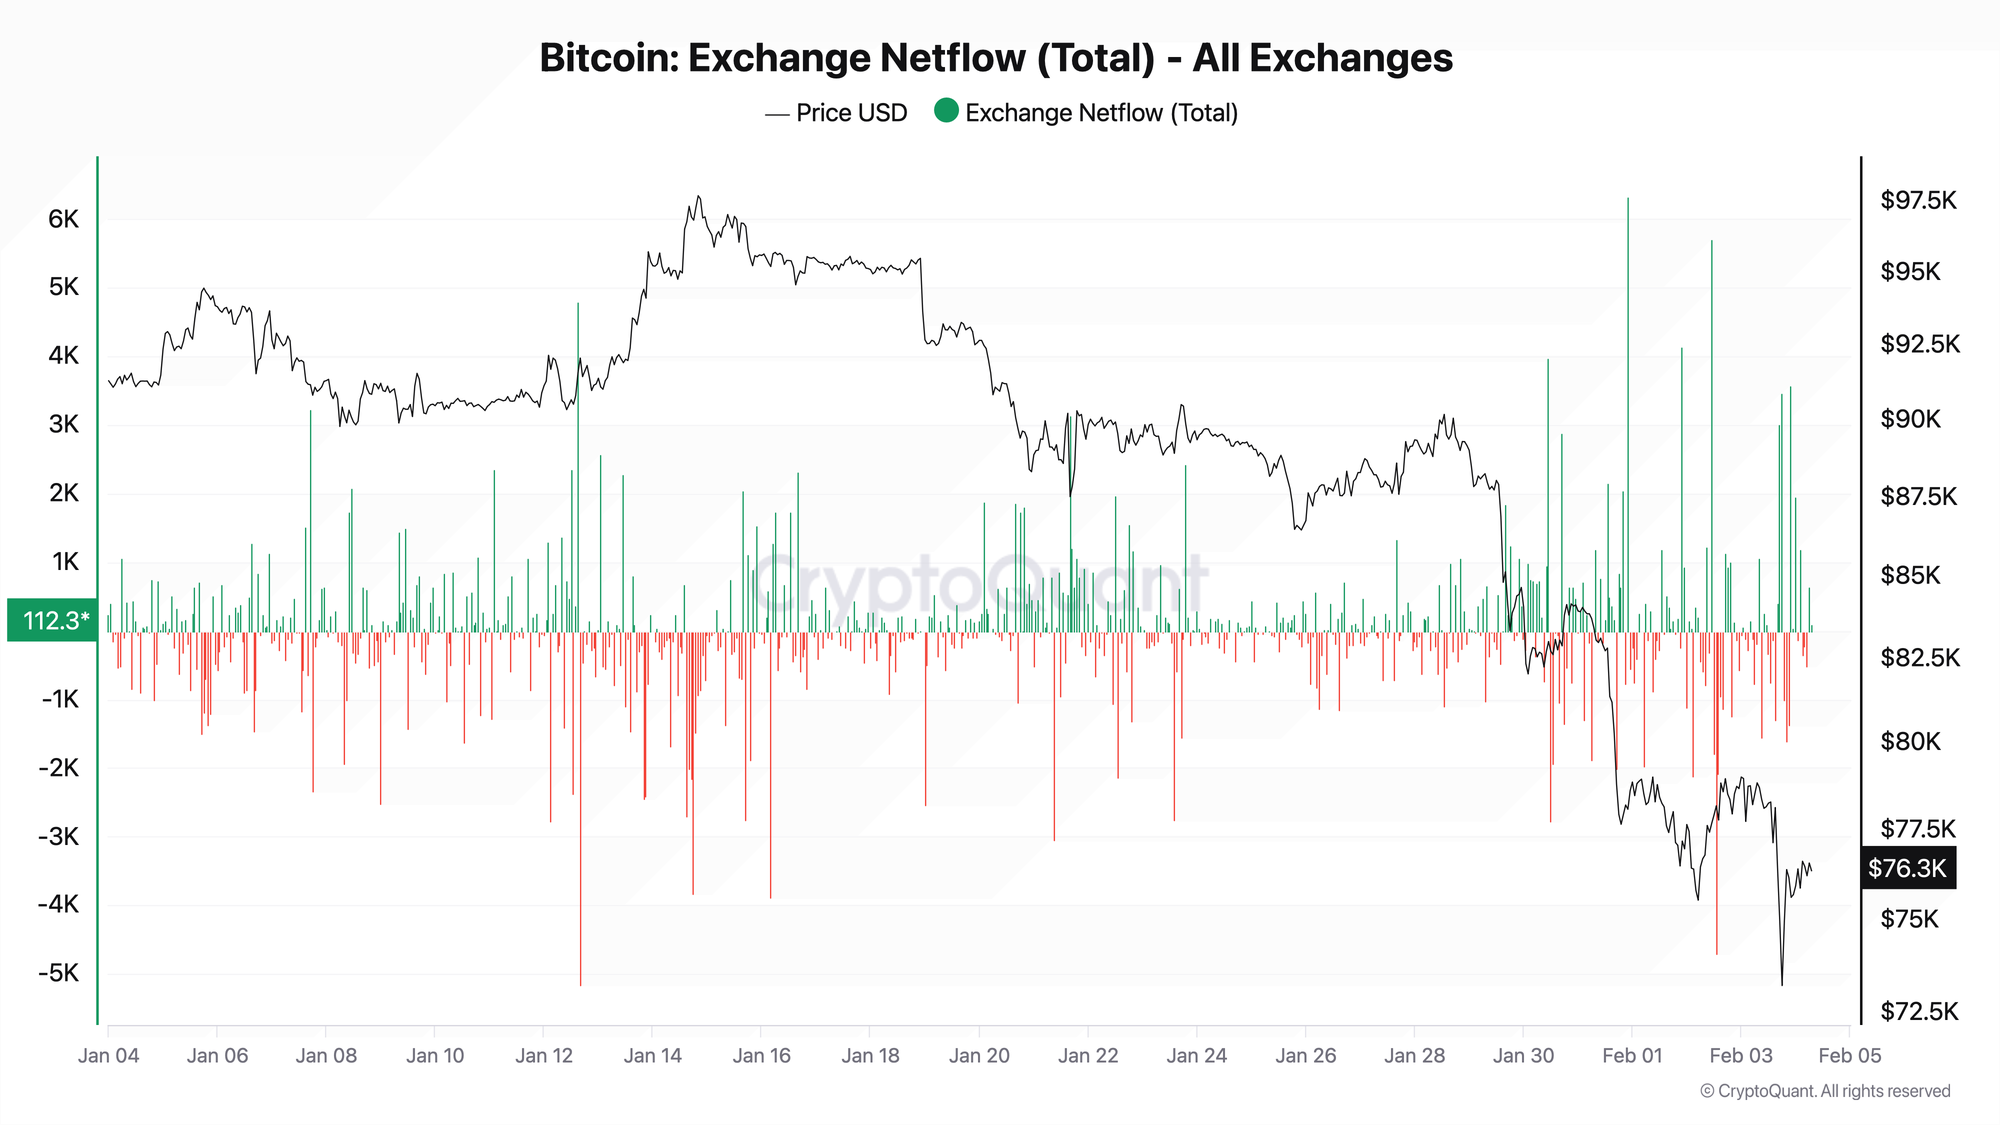
The metric reflects net BTC flow to all exchanges: green bars represent inflows (potential selling pressure), red bars represent outflows (accumulation).
Since late January, the flow structure has changed. While outflows dominated before January 19 with rare inflow spikes, the picture has reversed since late January: several large inflows occurred on January 31 (+6.3K BTC per hour), February 1 (+4.1K BTC), and February 3 (+3.5K BTC). Recent days show a sustained dominance of green bars over red.
The shift in netflow regime from negative to positive confirms a reversal in holder behavior. Trigger for improvement: return to sustained outflows exceeding 1K BTC/hour with price stabilization above $80K.
Bitcoin: Exchange Reserve - All Exchanges
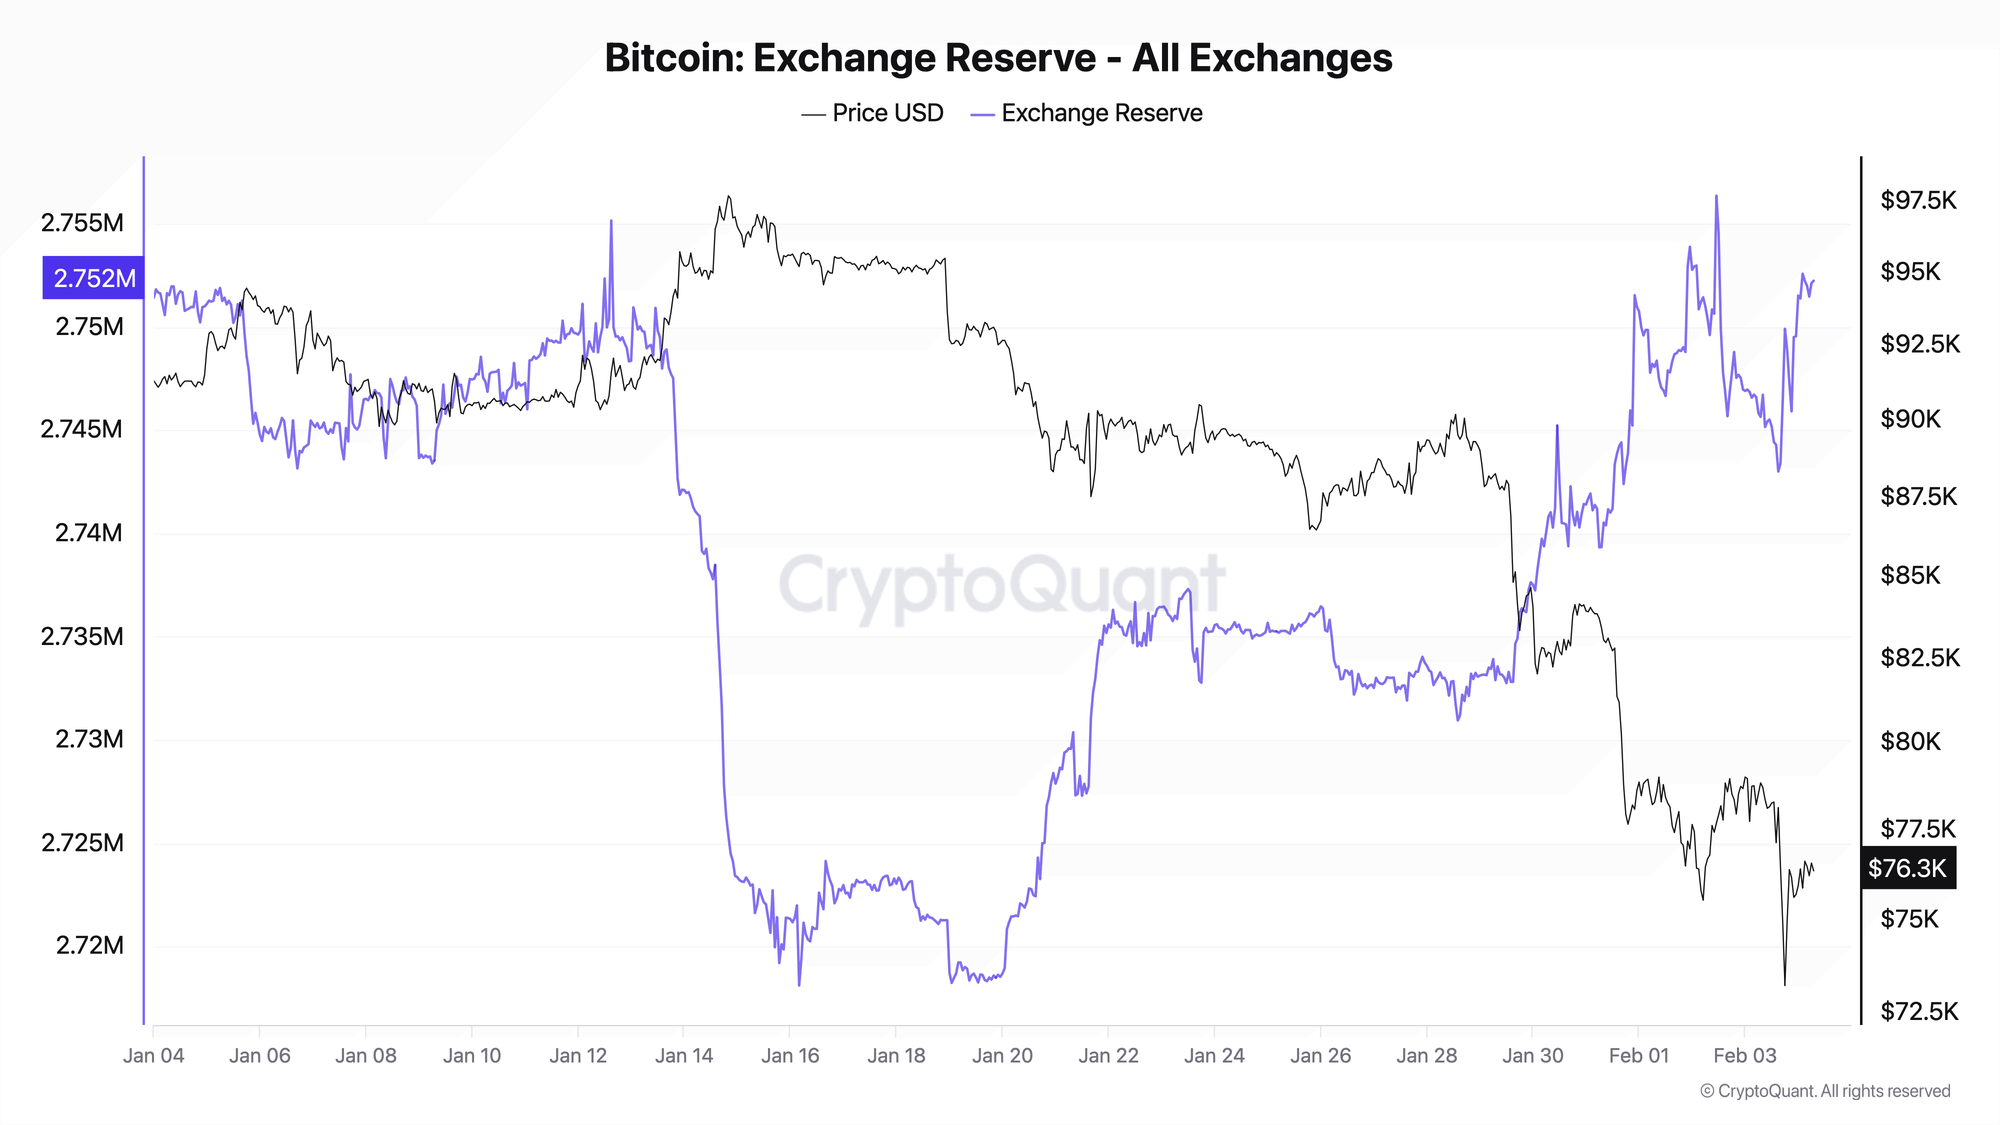
The metric shows the aggregate volume of BTC held on exchange addresses. Growth means coins are returning to exchanges for potential sale.
Reserves reached a local minimum of approximately 2.718M BTC on January 19 - this was the point of maximum accumulation. Since then, the trend has reversed: the current level stands at 2.752M BTC, meaning 34K BTC have returned to exchanges over two weeks. Growth accelerated after price broke below $80K, indicating capitulation among some holders.
A 1.2% increase in reserves over two weeks amid a ~20% price decline reflects coins transitioning to a more liquid state and intensifying potential supply pressure on the market. Critical level: continued reserve growth above 2.76M BTC will increase selling pressure. Positive scenario: reserve stabilization and return to outflows while price holds above $75K.
Both charts paint a consistent picture: the accumulation phase that lasted until mid-January has been replaced by a distribution phase. Coins are returning to exchanges precisely when price is falling - a sign of capitulation among some participants and increasing liquid supply.
Headlines don’t tell you what to do.
The market is noisy and contradictory. Our system converts raw data into a clear weekly action - BUY, HOLD, REDUCE, or EXIT.
→ Get full access to the Bitcoin strategy and weekly decision engine
FAQ
Why is reserve growth negative for price?
Coins on exchanges represent potential supply. When reserves grow, the amount of BTC available for sale increases. Combined with falling price, this creates pressure: those transferring coins to exchanges during a correction are most likely planning to sell, not buy.
What scenario would signal a reversal?
A positive signal would be reserves stopping their growth and returning to outflows while price holds. Historically, bottoms form when reserves stop growing despite continued price pressure - this means those who wanted to sell have already exited.
CONCLUSIONS
On-chain data structure indicates a regime shift from accumulation to distribution. Reserves reversed from January 19 lows and grew by 34K BTC, while netflow shifted to inflow dominance. Stance is risk-off with neutralization upon reserve stabilization below 2.76M BTC and return of sustained outflows. Main risk: continued reserve growth will accelerate selling pressure and open the path to a $70K test. Main trigger for improvement: netflow reversal into negative territory while price holds above $75K.