
🎧 Morning Brief #175 - audio debate on today’s market setup
May 2026 has put short-term holders in a vulnerable position: BTC is trading below their aggregate cost basis, while Net Realized P/L has moved into negative territory for the first time in a month. Today’s two charts give an updated picture - from the cost structure of market participants to the real monetary flow through the network.
TL;DR
The market remains under pressure: STH are holding positions at a loss, while realized losses exceed profits. Until price returns above $80K, the signal remains neutral-bearish.
Bitcoin Realized Price Analysis: STH Cost Basis vs. Market Price
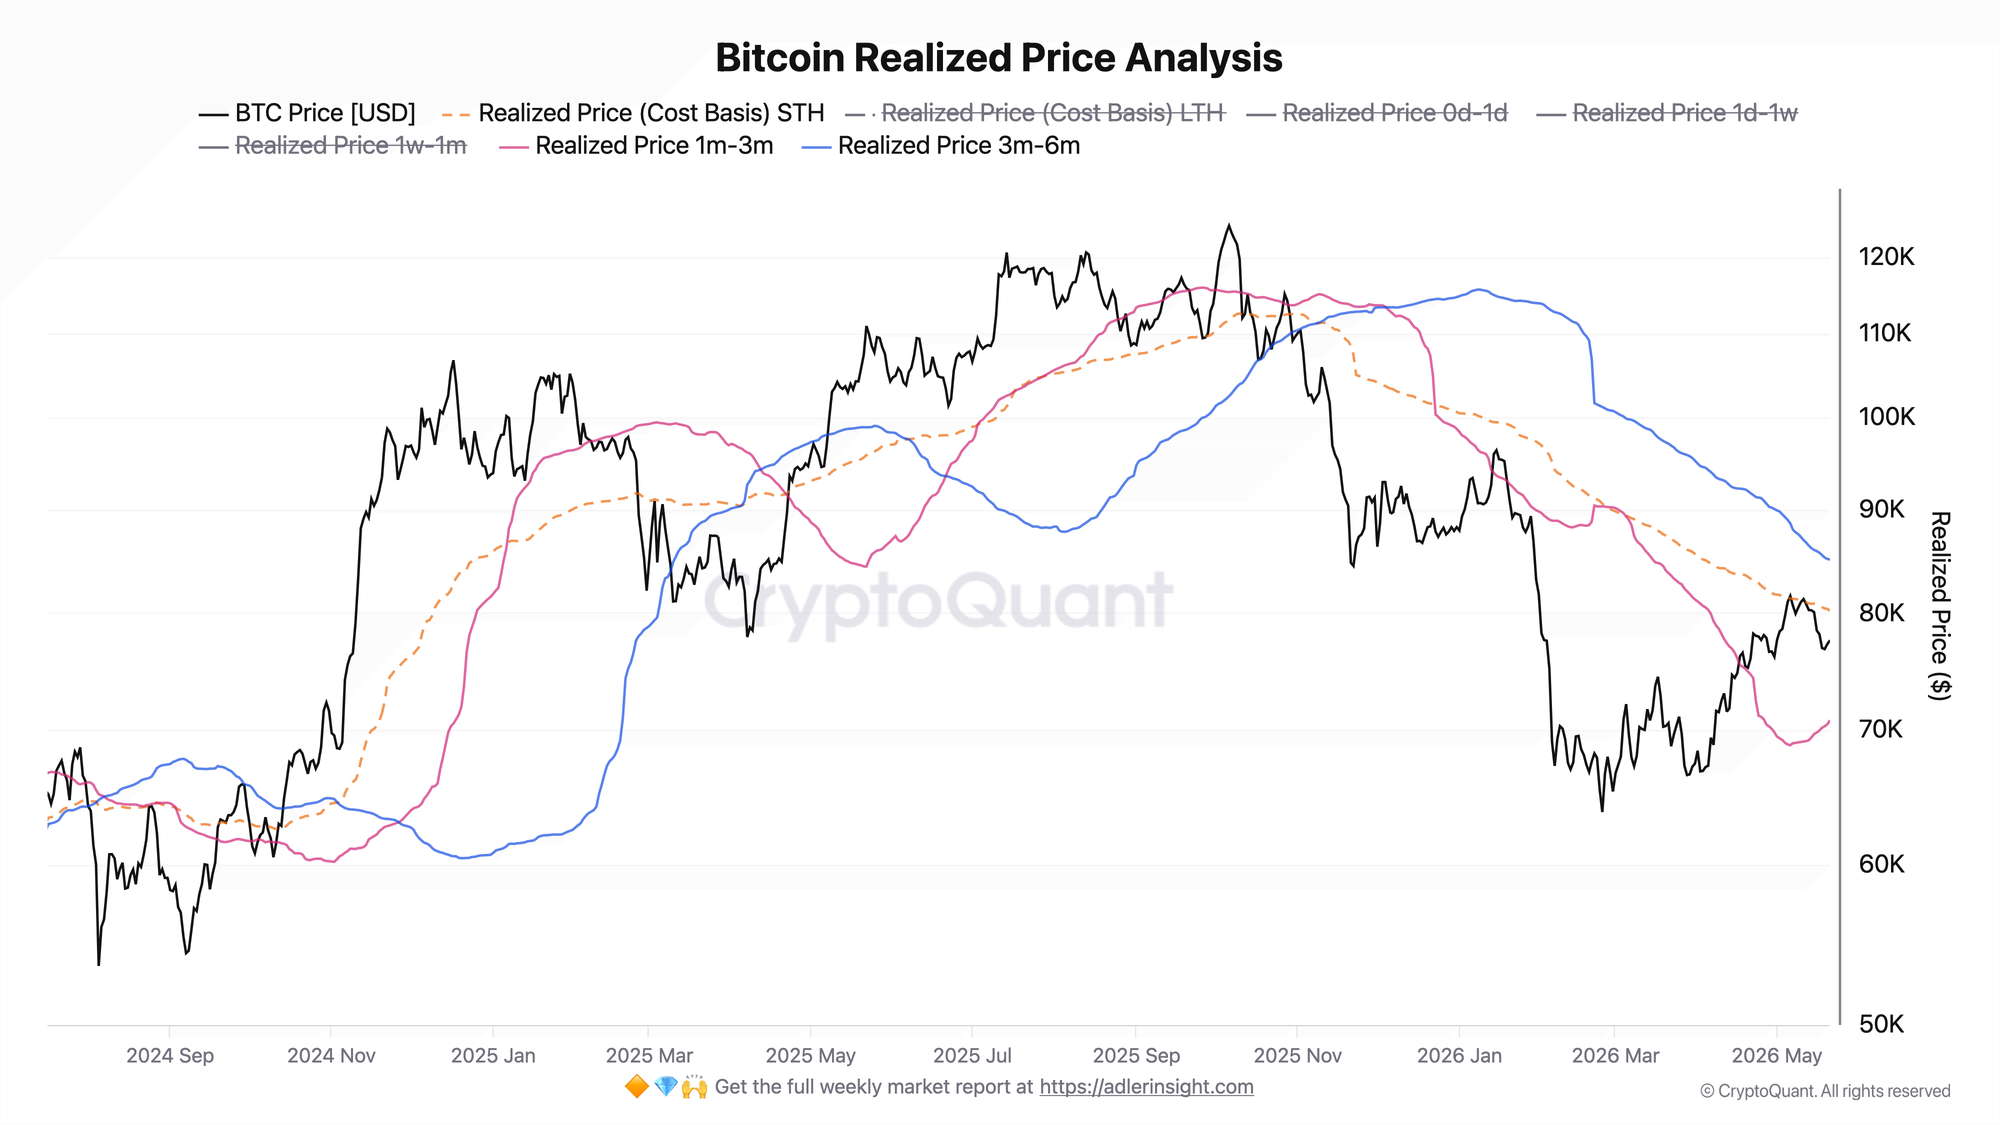
The metric shows realized price, meaning the average cost basis of different holder cohorts. Key levels as of May 21, 2026:
- STH Cost Basis: $80,217
- Realized Price 3m-6m: $85,023
- Realized Price 1m-3m: $70,791
- BTC Price: $77,550
BTC is trading below STH Cost Basis, but above the lower boundary of the 1m-3m range. This means the average short-term holder is currently "underwater" by roughly $2,700.
Historically, price below STH Cost Basis is a zone of elevated stress. Some participants begin selling at the first price recovery, creating an overhang of supply. That makes the $80,217 area a key local resistance level.
The main trigger for a regime shift is a return and hold above $80,217. Until that level, any rally remains vulnerable to selling from STH trying to exit with smaller losses.
Bitcoin Net Realized Profit/Loss
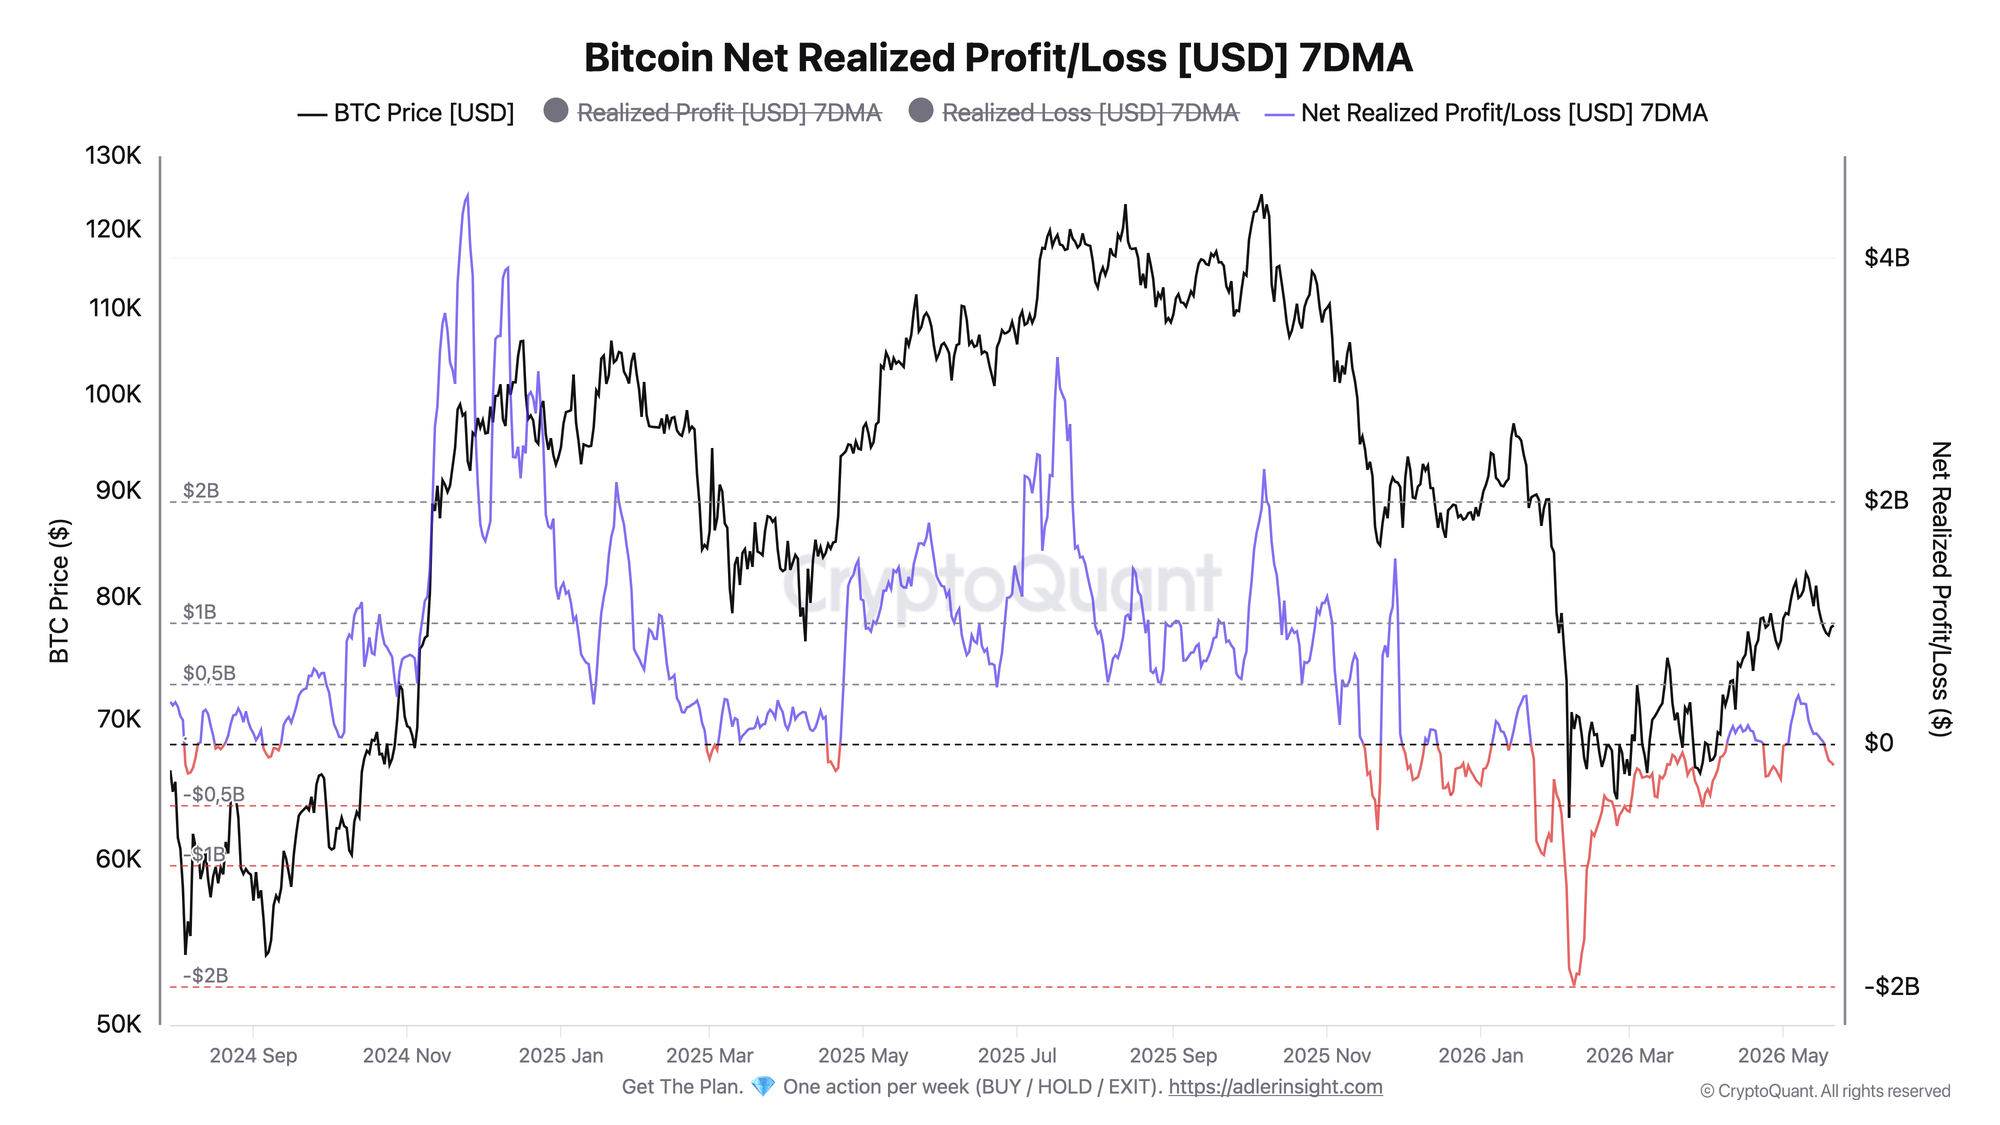
Net Realized P/L 7DMA is the difference between realized profits and losses across all network participants over a rolling week, expressed in USD.
As of May 21, the value stands at -$176M: realized losses reached $366M, while realized profits amounted to only $190M.
The reversal was sharp. On May 17-18, the metric was still in a slightly positive zone around +$12M, while on May 9-10 it showed a steady inflow of about +$330M. Over the past 5 days, losses have been rising consistently while profits have been shrinking - a classic picture of participants exiting the market against a declining price backdrop.
In historical context, current values are still far from the extreme capitulation of January 2026, when Net Realized P/L fell toward -$2B. But the direction of the trend has deteriorated.
The deterioration in the metric near $77K suggests that some participants prefer to realize losses now rather than wait for further downside. Negative Net Realized P/L by itself does not always mean the decline will continue. But combined with STH being underwater, it creates an environment with limited upside impulse.
The trigger for a reversal is a sustained return of Net Realized P/L above zero on a 7DMA, alongside a price recovery above $80K.
Stop holding through every crash - start your 7-day free trial. Weekly Engine tells you when to stay in, when to step aside, and when risk is rising.
Signal
The two charts are saying the same thing in different languages: short-term participants are under stress. STH Cost Basis at $80,217 forms a local supply ceiling. Negative Net Realized P/L confirms that this stress is already materializing in actual sales - not just in unrealized paper losses.
As long as price remains below $80K, the market is not confirming a recovery. A return above $80,217 and a move in Net Realized P/L back above zero would be the first sign that seller pressure is beginning to ease.
FAQ
What does it mean when price is below STH Cost Basis? It means the average short-term holder, whose coins moved within the last 155 days, bought BTC above the current price. These participants are more likely to sell into a recovery, creating an overhang of supply. This is not a crash signal, but it is a resistance signal.
Under what condition does the picture shift from neutral to bullish? It requires double confirmation: price above $80,217 with a hold for at least 3-5 days, and Net Realized P/L turning back above zero at the same time. Only then will short-term holders exit the loss zone and selling pressure begin to structurally decline.
CONCLUSIONS
The market is in a neutral-bearish regime with a clearly defined resistance level. STH are holding positions at a loss: the current BTC price is $77,550 versus STH Cost Basis at $80,217. Net Realized P/L at -$176M confirms that this stress is already being realized through the network - losses exceed profits.
The strength of the current structure is that the lower boundary of the range, $70,791 based on Realized Price 1m-3m, remains well below the market and has not yet been tested.
The main trigger for a regime shift is a return above $80,217 with positive Net Realized P/L. The main risk is a breakdown of the $74,500-$75,000 zone with accelerating realized losses, which could send the metric back toward April-January 2026 levels.
Live Charts
Explore the on-chain metrics behind this brief:
- Realized Price - Aggregate cost basis vs. BTC price and long-term trend.
- Realized Price Bands - Dynamic valuation zones built from live on-chain cost basis.
- SOPR - Whether moved coins are realizing profit or loss.
- STH-SOPR - Short-term holder behavior around the 1.0 breakeven threshold.
- NUPL - Net unrealized profit/loss mapped into cycle sentiment phases.