
Fear & Greed 30DMA = 49.4%, index itself in Fear, Fear & Greed 90DMA = 61.6% still above median but turning down. MVRV Z-Score (365D) = −0.3 - no overheating, valuation close to fair value over the year.
TL;DR
Emotional momentum has cooled: 30DMA F&G at median in Fear mode, while 90DMA maintains a moderately bullish backdrop. MVRV (365D) = −0.3 confirms "fair/slightly cheap" valuation and consolidation mode without euphoria - the market is more sensitive to news and liquidity. Base scenario - sideways/grind higher through spot, continuation of uptrend validated by F&G consolidation >60 together with rising 30DMA and updating local price highs, risk scenario - drop <40 with increased leverage in derivatives and MVRV falling to < −1.
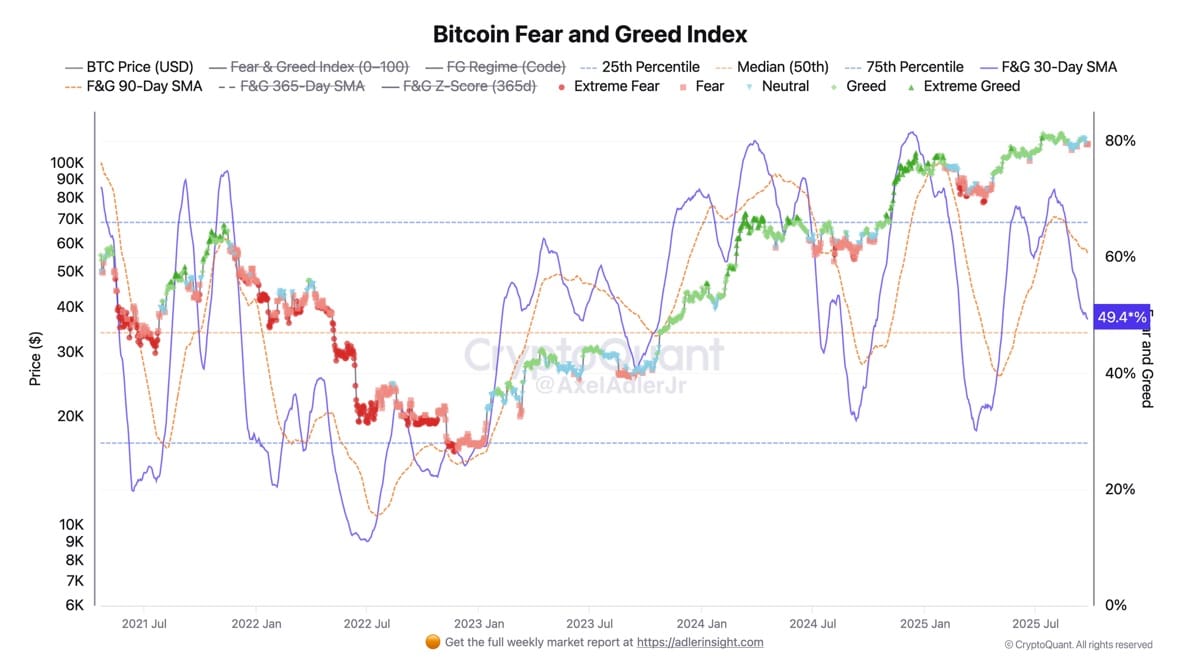
Currently, the Fear and Greed index demonstrates a clear shift toward Fear: the local emotional backdrop has deteriorated, and the 30-day moving average of the index has dropped to the 50th percentile (median). This indicates that the neutral environment is gradually fading and the market is becoming more sensitive to external triggers - such as news flow and liquidity levels. Meanwhile, the 90-day average remains above the median at 61%, indicating a persisting structural bullish bias despite the obvious reversal of this metric.
Key attention should be paid to the 30DMA dynamics: consolidation of the index below 40% amid pressure from derivatives and rising open interest could amplify emotional swings and trigger a new wave of liquidations. The zone below the median in the context of Buffett's rule "be fearful when others are greedy, and be greedy when others are fearful" can be viewed as an area of potential position accumulation.
Thus, the market has entered a phase where the balance of emotions and technical factors is particularly delicate: any intensification of fear while maintaining fundamental support could transform into a platform for a future rally.
Bitcoin MVRV Z-Score (365D)
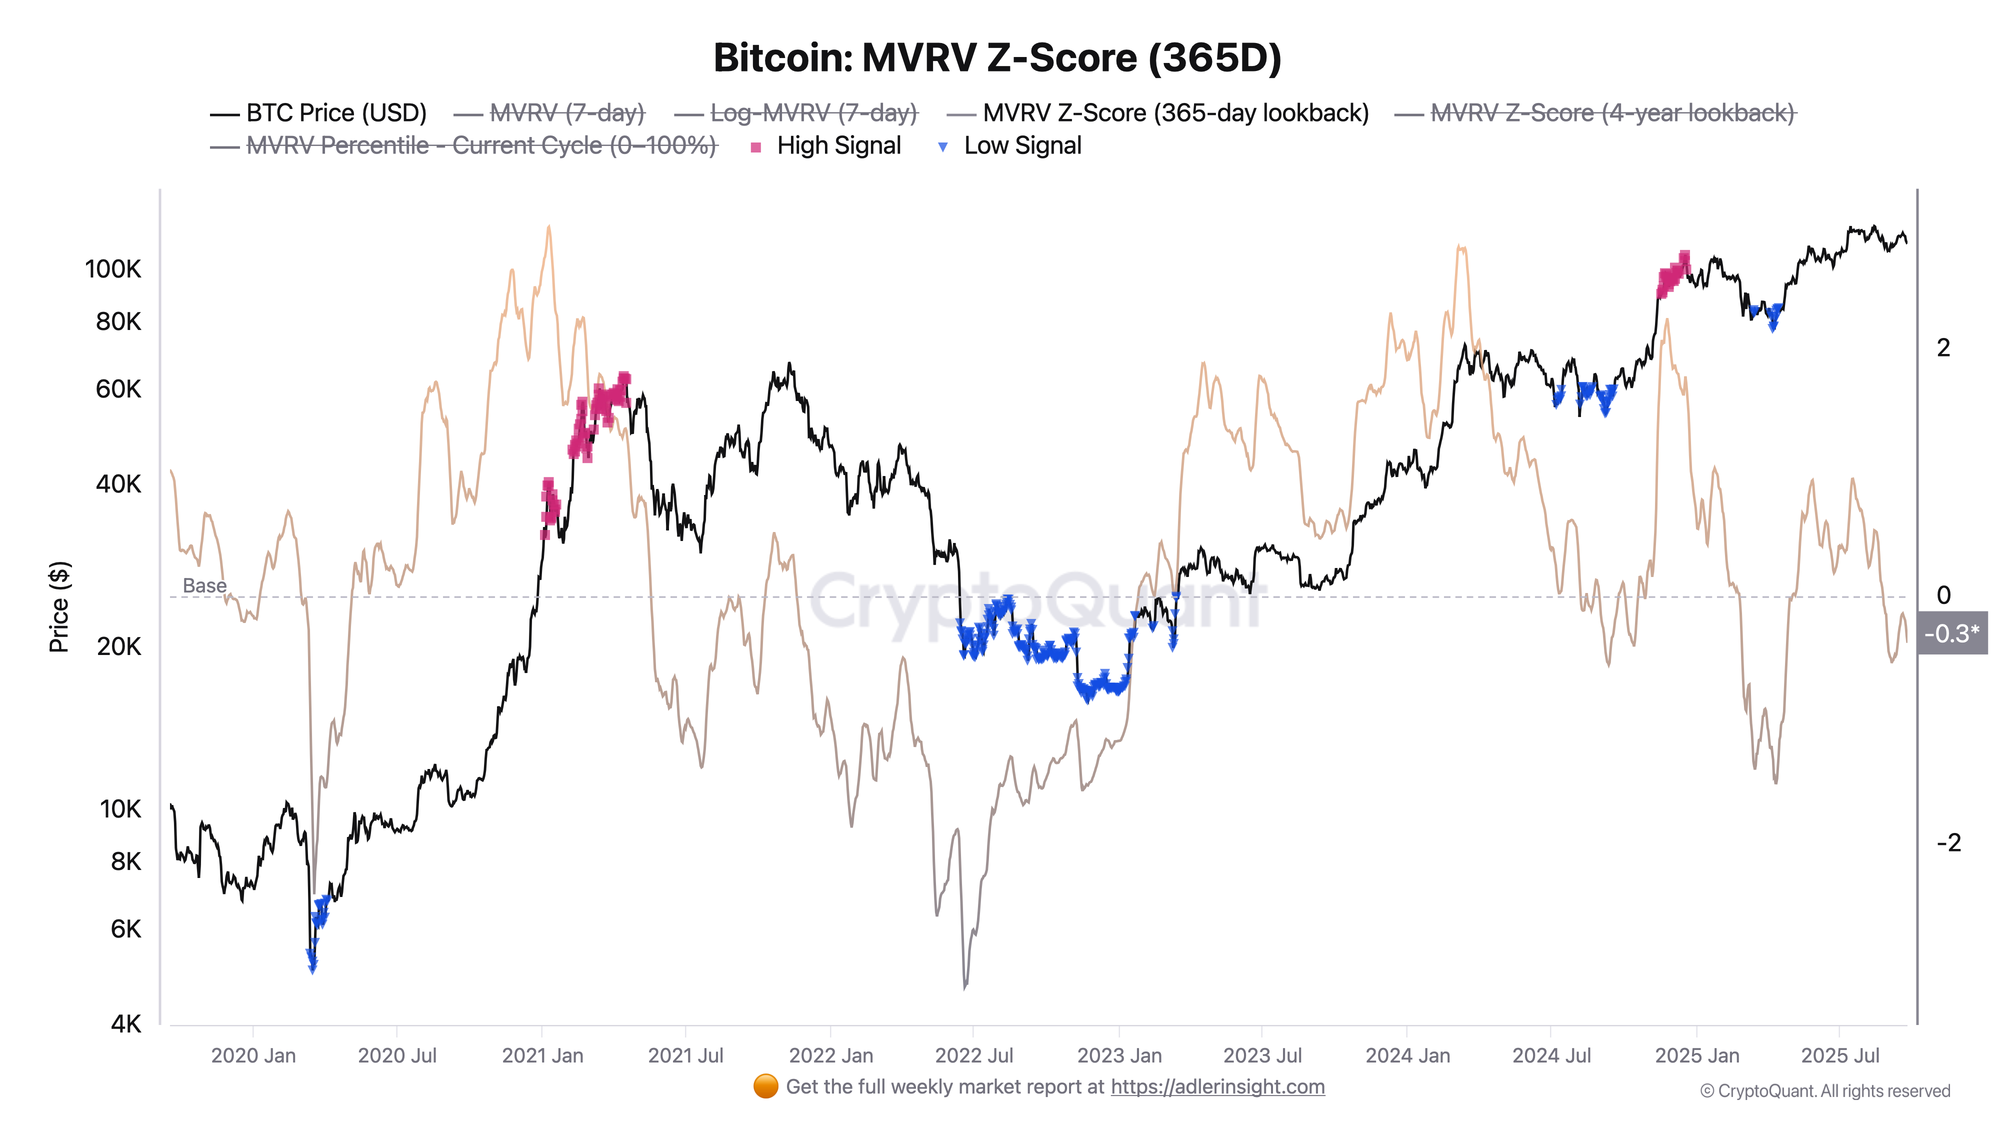
MVRV Z-Score (365D) has dropped to the base zone and holds at −0.3 with a downward bias. This means that market capitalization is trading close to "fair" value relative to realized price adjusted for annual volatility: there is no overheating, valuation is neutral-to-moderately "cheap" relative to the last year. This level corresponds to a digestion phase after a rally and decent points for gradual accumulation on dips, if there are no signs of loss-making sales.
To properly read this metric, it's important to understand its structure: MVRV compares market price with realized price (average cost basis of held coins), and Z-Score shows how much the current value deviates from historical norm over the selected period. When the indicator is above +2, the market is usually overheated - investors hold significant unrealized profits, creating risk of profit-taking and corrections. When the value falls below 0, conversely, the market is either close to fair valuation or undervalued: historically, such zones have coincided with accumulation phases and the start of new cycles. Thus, current levels near the base signal that the market has exited the overheated zone and moved into a more sustainable phase, where the risk-return balance shifts in favor of long-term buyers.

FAQ
How to read the 30-day and 90-day SMA of the Fear & Greed index?
30DMA - "temperature" of sentiment here and now, 90DMA - structural backdrop. Currently 30DMA = 49–50 (at median) and the index itself shows Fear, while 90DMA = 61–62 remains above median. This combination means: emotional momentum has cooled to neutral-bearish, but the base cycle backdrop is still moderately bullish.
What F&G levels are important for actions?
Historically <40 on the index (and 30DMA falling below 40) corresponds to sustained Fear and consolidation/correction phases, >60 and 30DMA turning up - return of momentum and confirmation of uptrend. Extremes <25 / >75 - zones of increased reversal probability (in the spirit of Buffett's rule).
What does MVRV Z-Score (365D) = −0.3 mean?
This is "base": market price is close to realized value adjusted for annual volatility - no overheating, valuation is neutral-to-moderately "cheap" relative to the last year. Overheating risks usually begin above +2, and deep undervaluation zones below −1.
How to read F&G and MVRV together?
The matrix is simple: Fear + low/negative MVRV → market close to "fair" price, often this is a range with better asymmetry for buying dips, Greed + high MVRV → risk of overheating and profit-taking. Current combination (Fear with 30DMA ≈ median and MVRV = −0.3) - early/middle stage of digestion without euphoria.
Conclusions
Sentiment has shifted to Fear, 30DMA of the index has dropped to median, while 90DMA remains above the 50th percentile: momentum has weakened, but the structural cycle backdrop is moderately bullish. MVRV Z-Score (365D) = −0.3 confirms absence of overheating and indicates "fair/slightly cheap" valuation against the last year - this is a classic consolidation regime after a rally. Base scenario - sideways with increased sensitivity to news and liquidity.