
BTC price has approached the average purchase price of short-term holders - the gap has narrowed to just 4%. Meanwhile, profit-taking remains elevated: over 35,000 BTC with positive P&L flowed to exchanges in the past 24 hours.
TL;DR
STH discount has narrowed to minimum - price has nearly caught up with cost basis. This is a decision zone: either a return to premium or a new wave of pressure.
Bitcoin Short-Term Cost Basis vs Premium/Discount
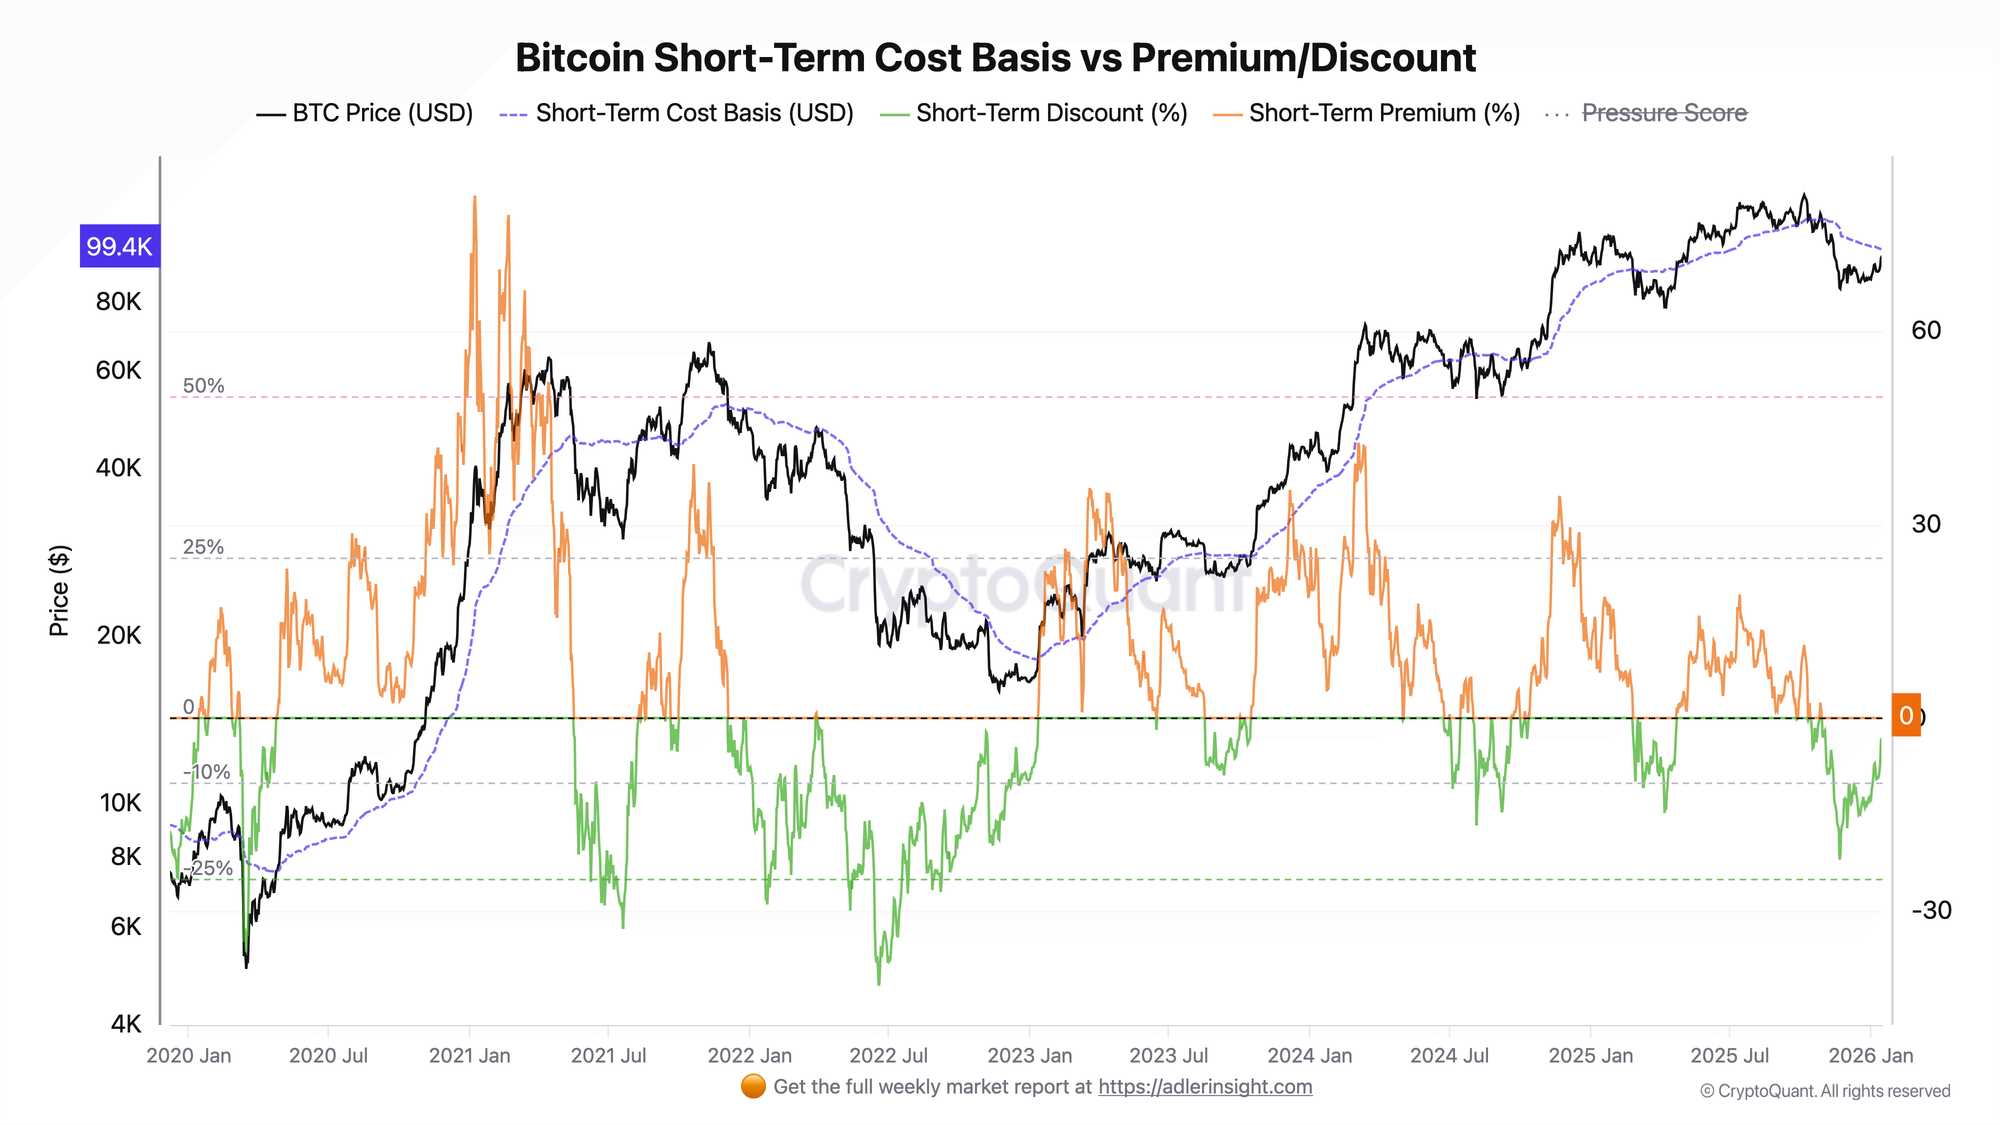
The metric displays a simple ratio: how much the current price is above (premium, positive value) or below (discount, negative value) the Short-Term cohort cost basis.
In November 2025, the discount reached an extreme -22% (November 21-22) - this was a capitulation zone when the price dropped to $84,400 while cost basis was above $108,000. Since then, a sequential recovery has occurred: late November - compression to -12.5%, December - fluctuations in the -11% to -17% range with local spikes, early January - acceleration of recovery from -12.5% (January 1) through -9.4% (January 8-10) to the current -4% (January 16). Over two months, the discount has narrowed almost 5.5x: from -22% to -4%. Price ($95,500) has approached cost basis ($99,460) - the gap is minimal and could be closed with one strong move.
The current situation is a decision zone, not capitulation. Historically, the zone near cost basis is accompanied by elevated volatility and acts as a market reaction area - both for trend continuation and reversal. Bullish scenario trigger - consolidation above $100,000 and STH transition to profit. Deterioration condition - return of discount to double-digit zone (below -10%), corresponding to prices below ~$89,500, which would significantly increase pressure on underwater holders.
Bitcoin Short-Term Holder P&L to Exchanges Sum 24H
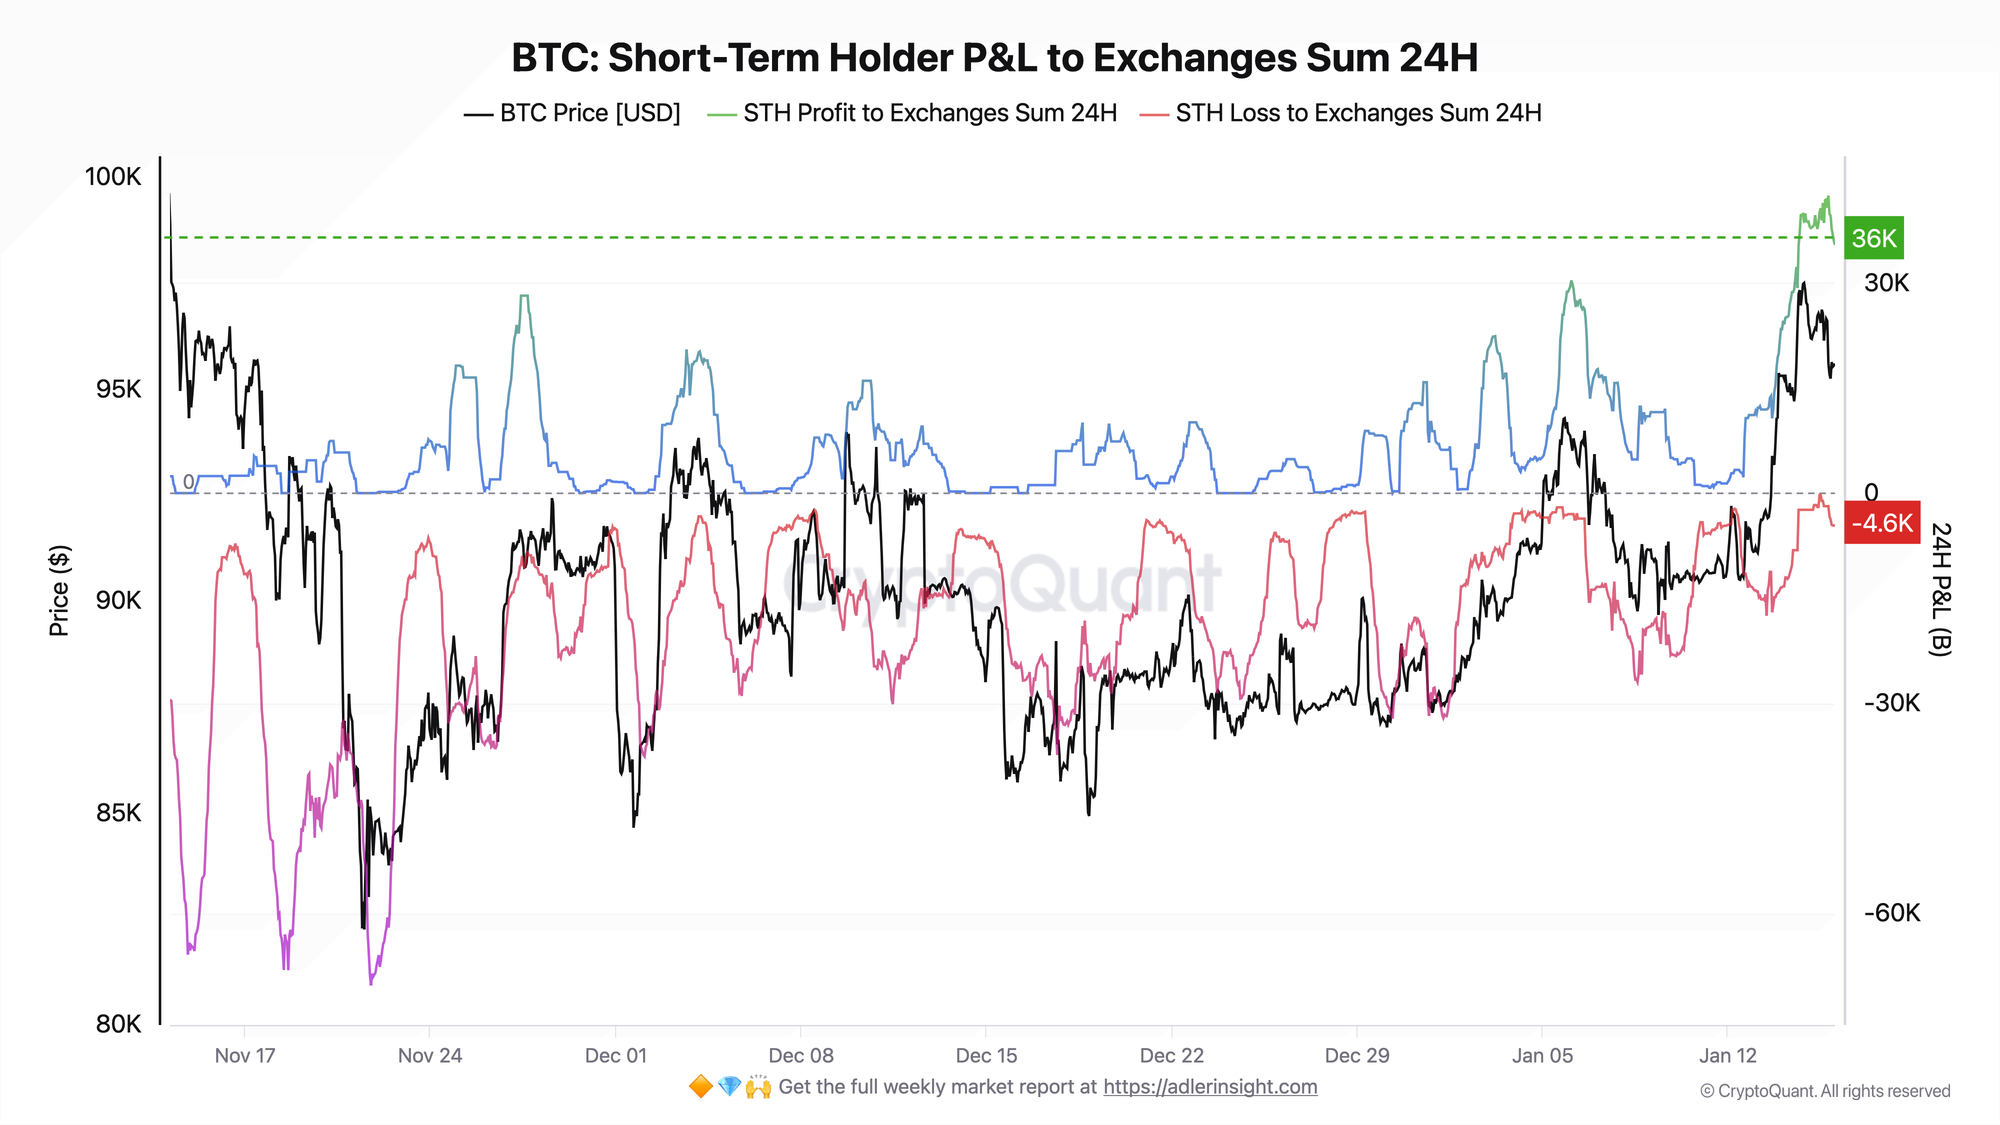
The metric separates all STH transfers to exchanges into two flows: coins in profit (purchased below current price) and coins in loss (purchased above).
Over the past 24 hours, ~35,400 BTC with profit flowed to exchanges - the upper bound of the two-month range. Loss-taking is minimal: ~4,600 BTC. The profit/loss ratio is approximately 7.5:1 - pronounced dominance of profit-taking over panic selling.
High profit-taking amid minimal discount is a logical picture. Buyers from the $85,000–$92,000 levels are using the approach to cost basis for taking profits. The flow structure indicates dominance of profit-taking over panic-selling - this is a qualitatively different type of pressure than capitulation of underwater positions. Inversion of the profit/loss ratio - when loss-driven selling begins to dominate - would intensify the bearish scenario, though it is not a mandatory condition.
The charts form a coherent picture: the discount has narrowed to minimum, and it is precisely in this zone that profit-takers have become active. Price is testing the cost basis zone amid elevated supply from profitable positions.
This Sunday, the full in-depth Bitcoin market report comes out. It includes:

1) Bitcoin Strategy
Key components: Regime (main filter) → Bitcoin Index Market Phase → Bitcoin Halving Cycles Timing → Point triggers: Bitcoin Advanced Net UTXO Supply → BTC Buy/Sell Index & Risk → Weekly strategy status
2) Market Analysis
Deep market analysis using key on-chain metrics and final market state with forecast for the following week.
3) Adler Insight Light
Adler Insight Light - a one-page weekly brief based on our proprietary models. It aggregates over 50 on-chain and market parameters and uses machine learning-based forecasting.
7-day trial subscribers receive both reports in full. → Subscribe before Sunday
FAQ
Why is discount compression more important than its absolute value?
Dynamics matter more than statics. A -4% discount after -22% represents recovery and approach to the cohort's breakeven point. The same -4% after +20% premium represents deterioration. Context determines interpretation.
What would confirm a return to bullish regime?
Two conditions: price consolidation above $100,000 (STH transition to premium) and declining profit-taking volumes without growth in loss-driven selling. This would indicate that sellers are exhausted and buyers have held the level.
CONCLUSIONS
STH discount has narrowed from an extreme -22% to -4% over two months - price has approached cost basis of $99,460. Current flow structure: profit-taking dominates over loss-selling at a ~7.5:1 ratio, indicating absence of panic behavior. Regime - neutral, decision zone. Bullish scenario will be confirmed by consolidation above cost basis and STH transition to premium. Bearish scenario will intensify upon return of discount to double-digit zone and/or inversion of profit/loss ratio toward dominance of loss-driven selling.