
Short-term holders under stress amid liquidity outflows from spot ETFs.
TL;DR
STH Realized P/L has dropped into the capitulation zone, indicating massive loss-taking among short-term holders. Simultaneously, US Spot ETFs are recording sustained outflows, which intensifies pressure on the spot market and increases the probability of further correction.
#Bitcoin #OnChain #ETF
Bitcoin Short-Term Holder
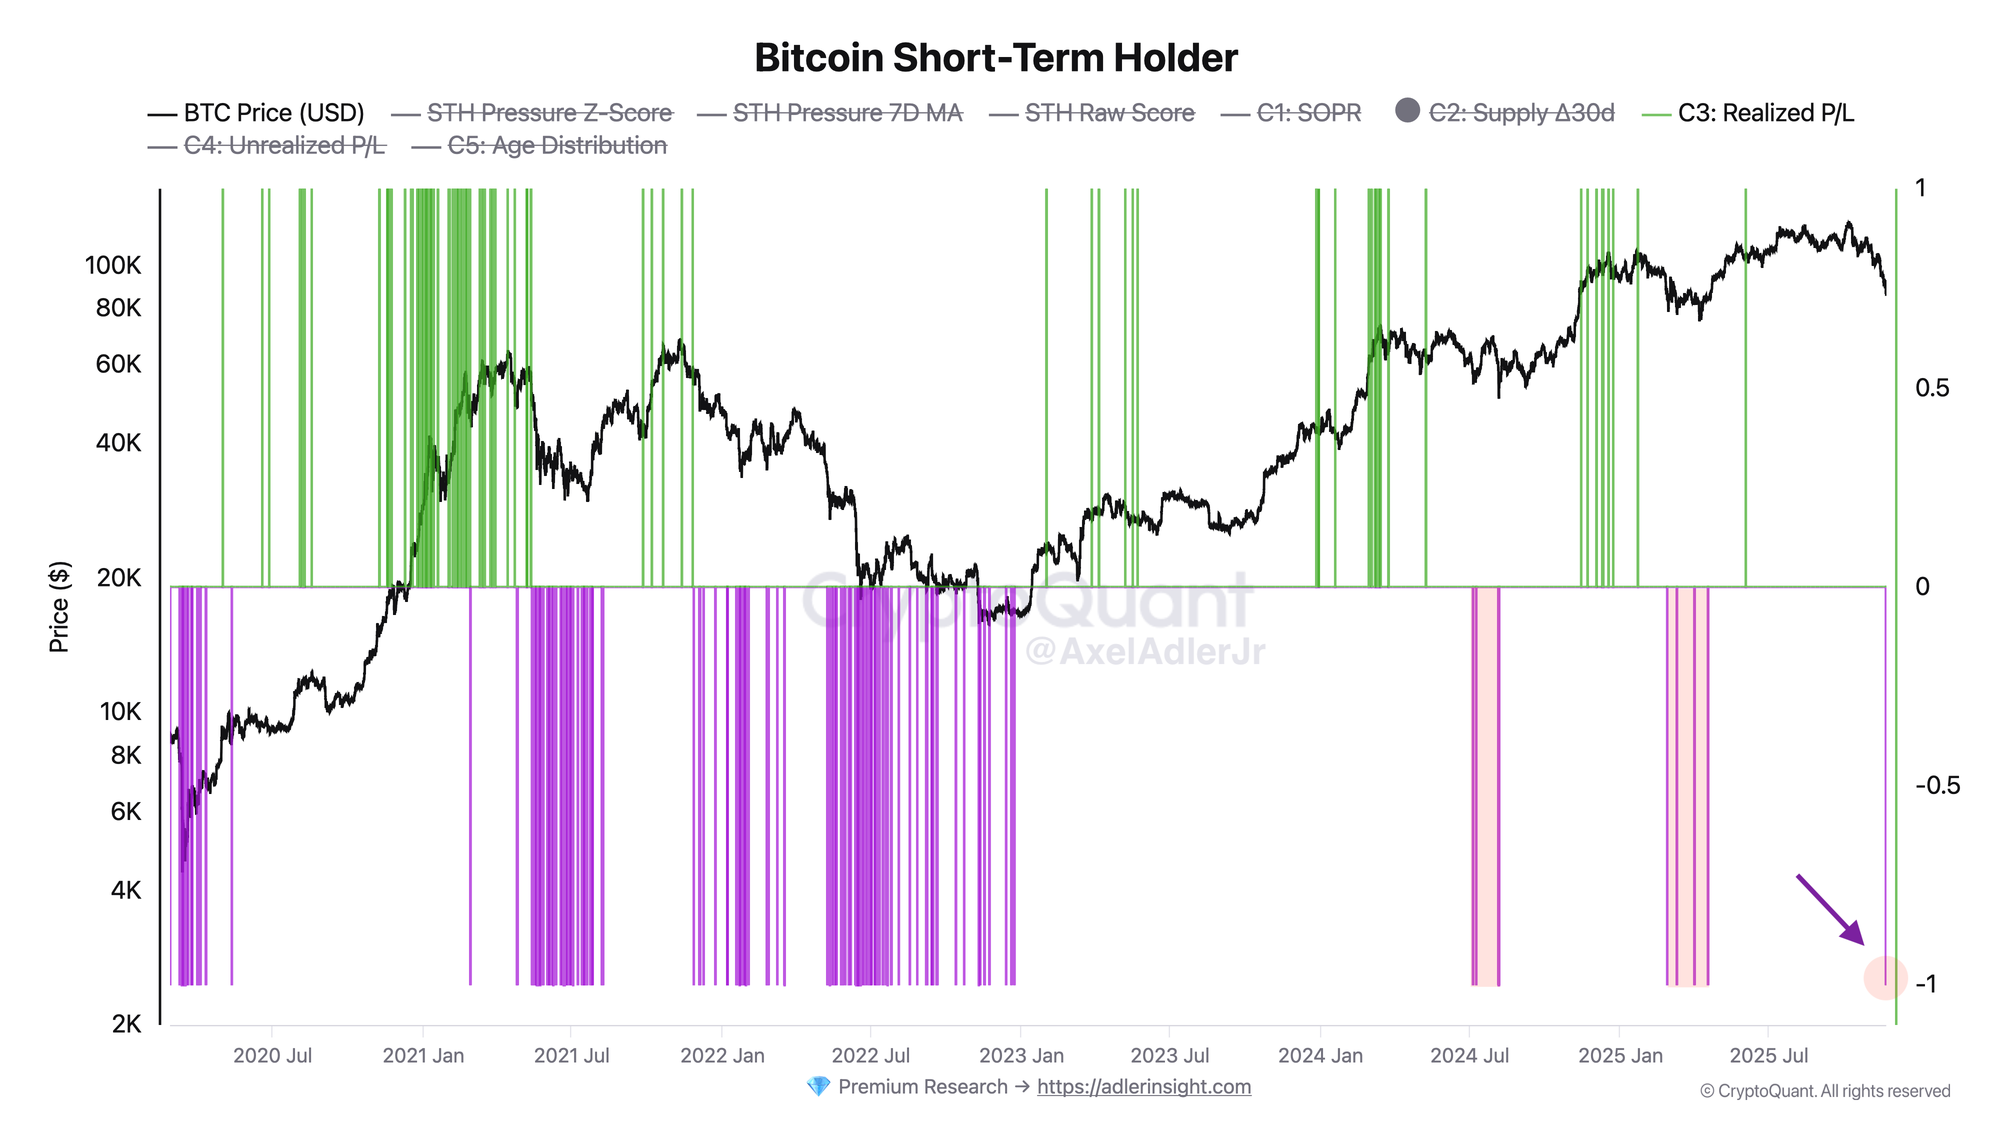
Purple zones on the chart mark periods when STH are realizing losses or are under pressure. The current signal (arrow) indicates capitulation stress. BTC price is trading around $83K; such zones during bearish market phases have deepened corrections.
Bitcoin + US Spot ETF Flows
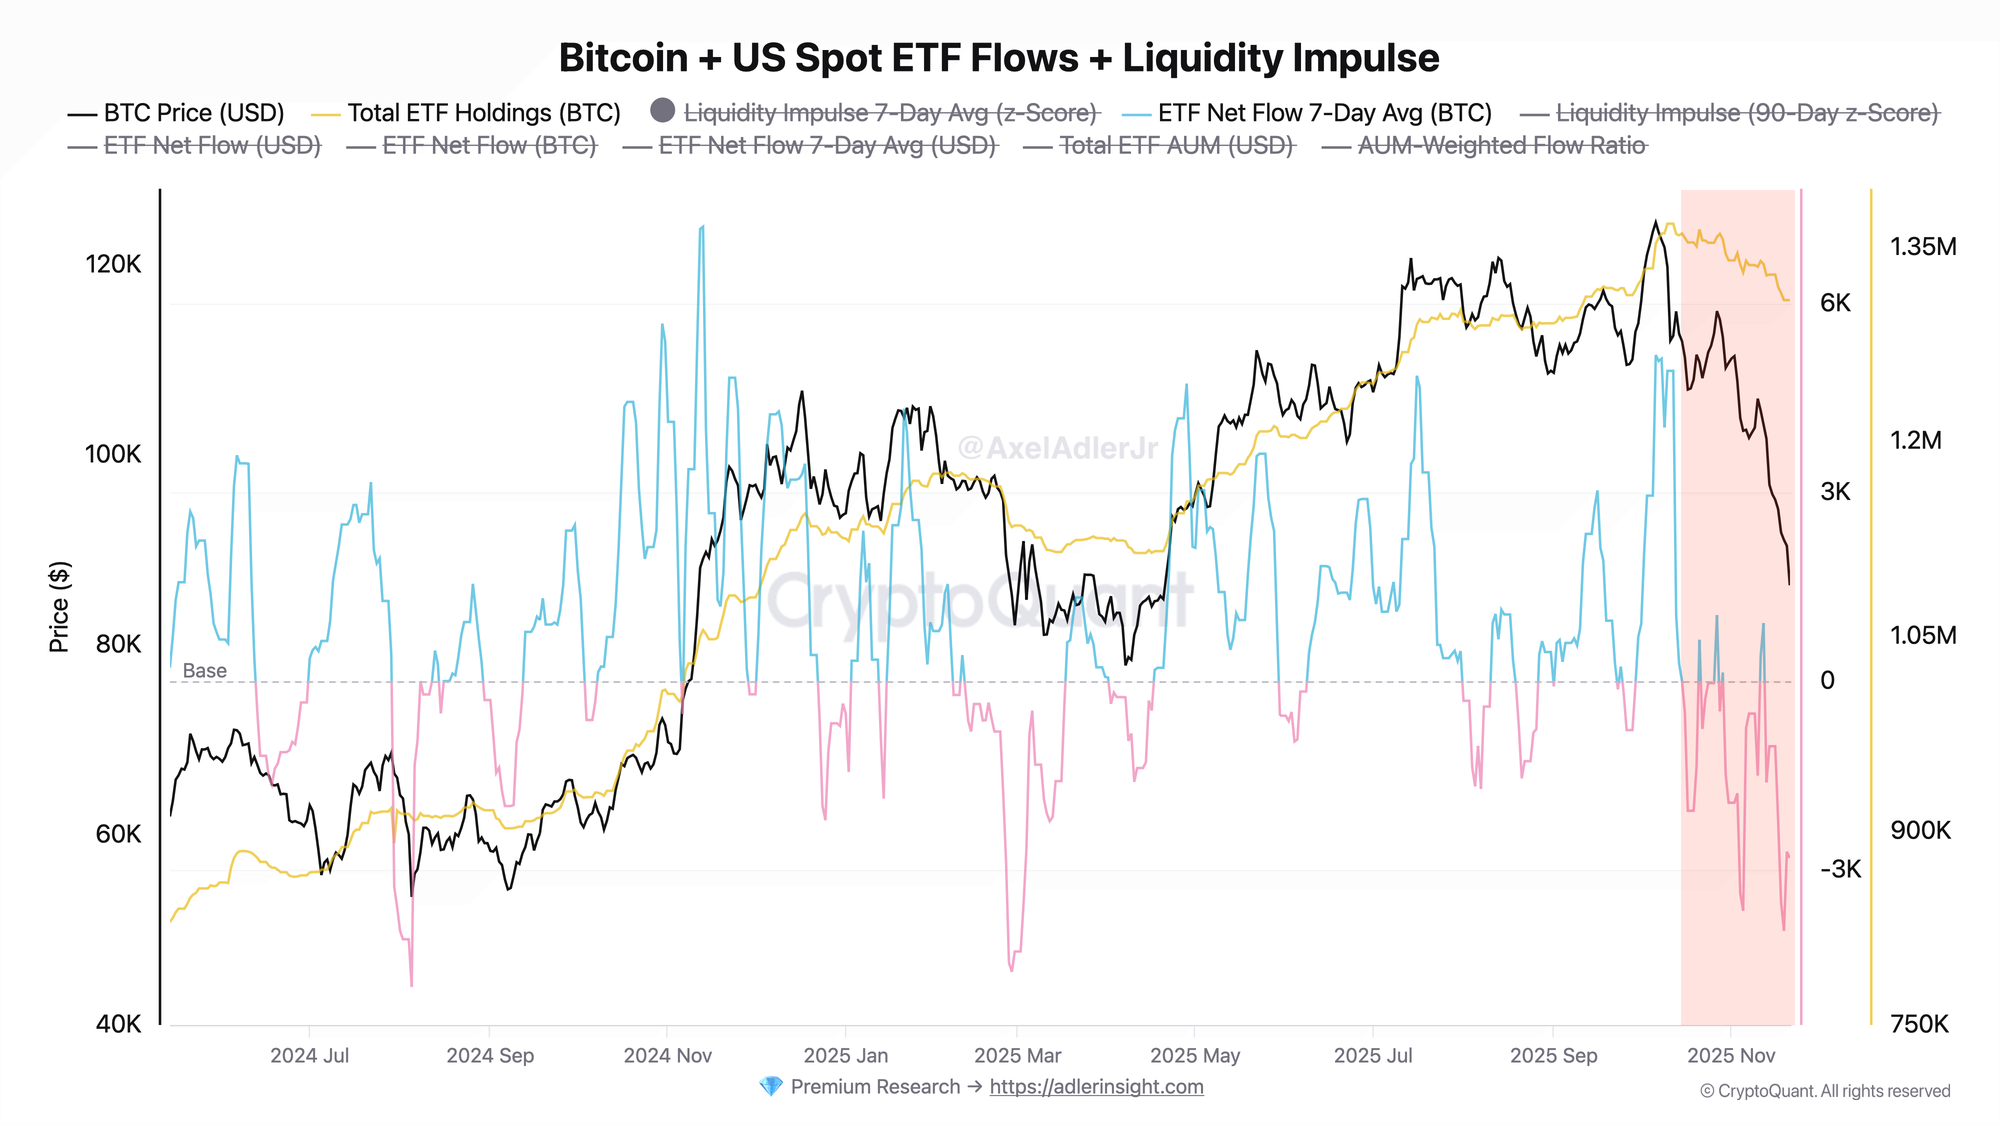
The red zone on the right (November 2025) records sustained outflows from US Spot ETFs. Price corrected from ATH $125K to $83K and intensified the outflow. So far, Total Holdings are not declining dramatically - institutions are not showing strong panic, but new capital is not coming in. Both charts give a bearish signal: STH are under pressure (realizing losses), while institutional demand through ETFs is not offsetting the selling.

FAQ
What does the current STH Pressure Index picture indicate?
The index at -1 shows that short-term holders (those who bought within the last 155 days) are massively realizing losses. This is a stress zone that, in bear markets, has transitioned into deep corrections.
How to interpret ETF Flows signals in the daily context?
A negative 7-day average flow means institutions are withdrawing capital from spot ETFs faster than they are depositing. If this trend persists, it pressures the spot price.
CONCLUSIONS
The market is entering a phase of intensifying pressure: short-term holders are capitulating and realizing losses, while outflows from US Spot ETFs continue to pressure liquidity. With this combination of STH stress and weak institutional inflows, the risk of a deeper correction remains elevated.