


Bitcoin has entered a period of low volatility and compression. Aggressive selling dominated the market over the past two weeks, but the balance of buying and selling is now close to neutral.
TL;DR
Bollinger Bands have narrowed, and the sellers’ edge has weakened. Neither buyers nor sellers currently have a clear advantage.
Bitcoin: Bollinger Bands Range
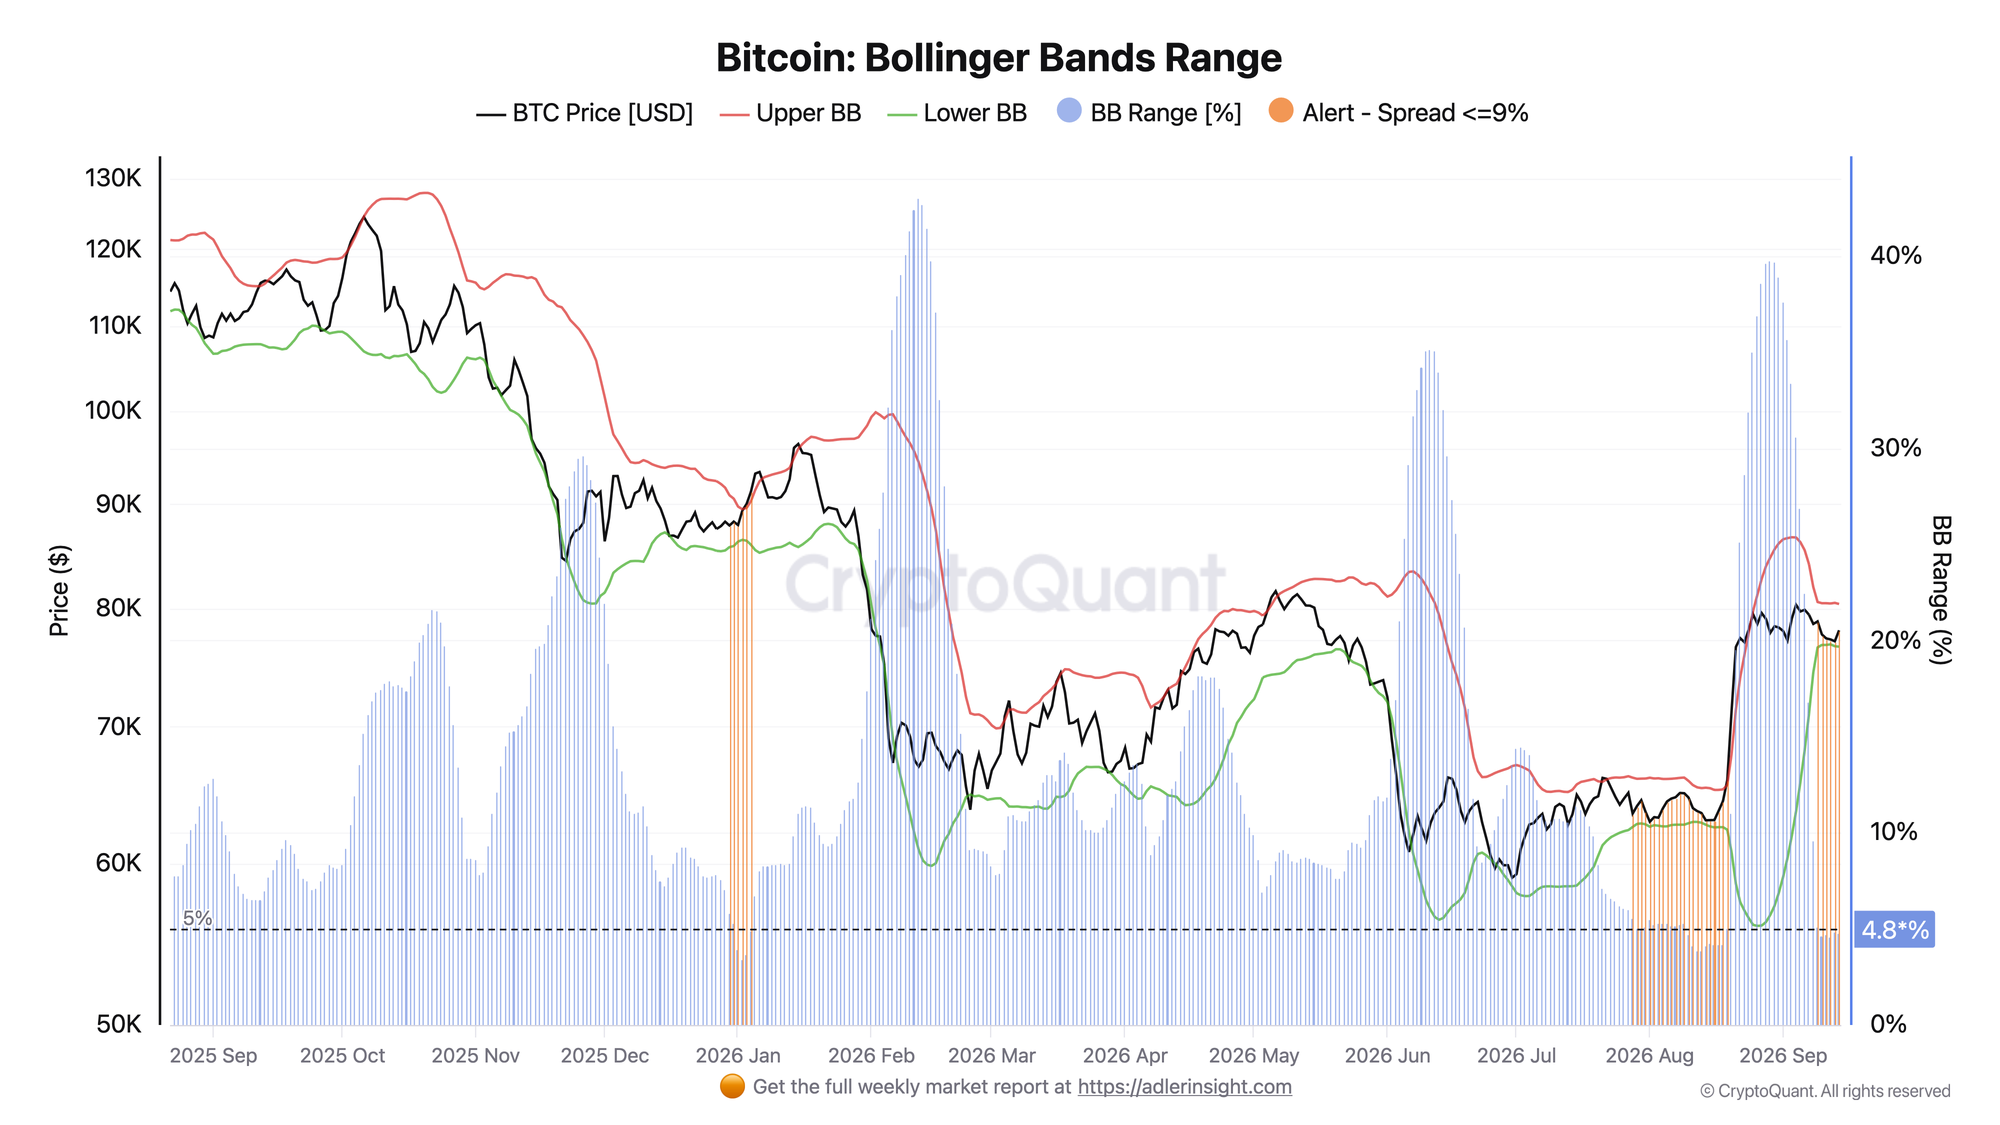
As of September 14, Bollinger Band width stands at 4.81%. The indicator has remained below the 6% threshold for six consecutive days, indicating continued compression. Volatility declined after August’s short squeeze, and the bands have remained narrow in recent days.
The lower band is at $76.6K and the upper band at $80.4K. Bitcoin is trading at $77.3K on the morning of September 15, in the lower half of this range. Buyers need to push the price back above the middle band to improve its position within the bands.
Bitcoin Net Taker Volume Oscillator
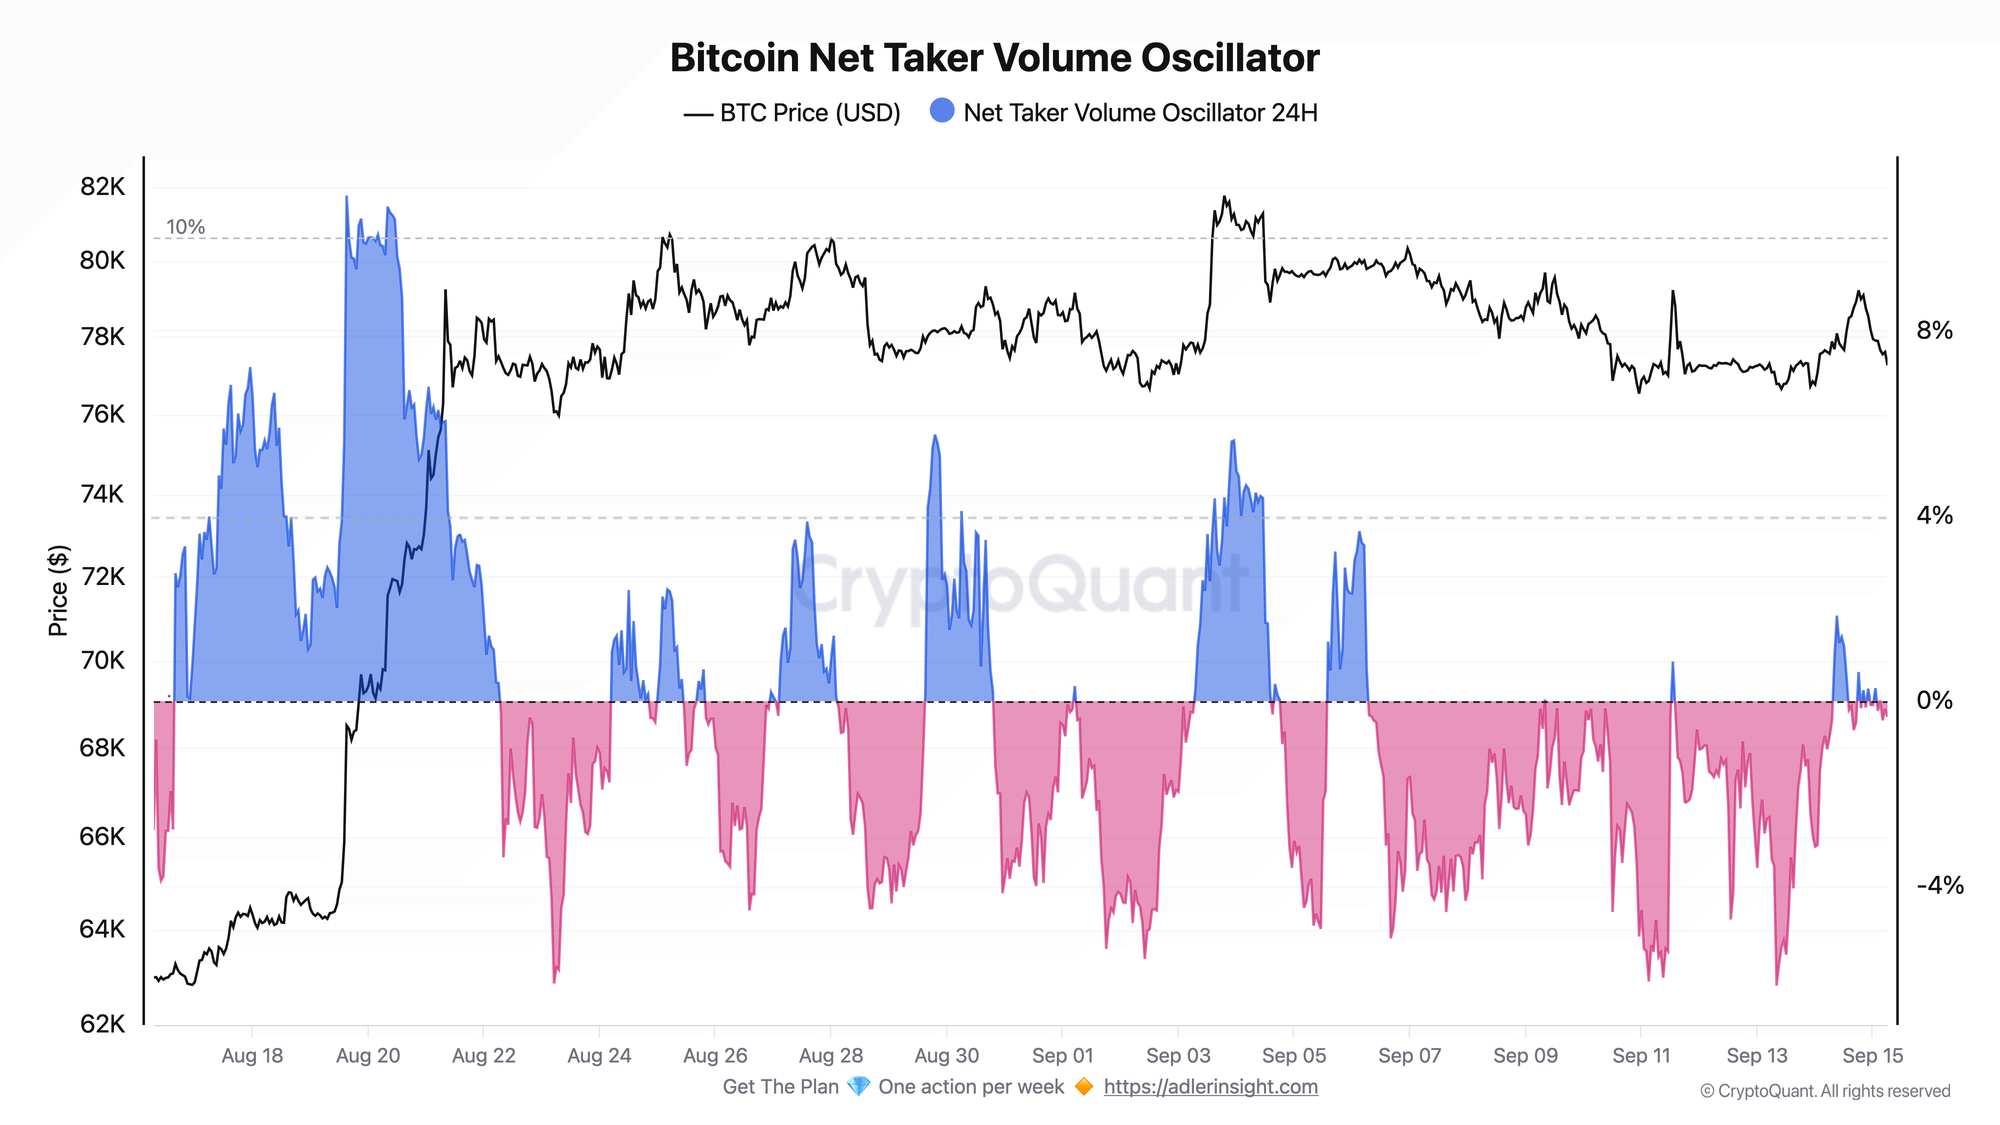
Over the past two weeks, the oscillator was below zero in 271 of 336 hourly observations, or 80% of the time. The daily balance of aggressive trades favored sellers for most of that period. Buyers occasionally gained an advantage but did not hold it for long.
The balance is now close to neutral: the latest oscillator reading is -0.34%, compared with -6.14% on the morning of September 13. The selling imbalance has narrowed considerably, although yesterday’s move into positive territory did not hold.
Reading the signal is not enough - you need to act on it. Weekly Engine turns on-chain data into one clear decision per week, with risk caps and invalidation built in. Subscribe.
FAQ
Do narrowing Bollinger Bands signal an imminent rally? No. Narrow bands reflect low volatility and market compression but do not determine the direction or timing of the next move.
Does weaker selling pressure mean buyers have taken control? Not yet. The oscillator has moved closer to zero, indicating that aggressive buying and selling volumes are becoming more balanced.
Conclusions
The market remains compressed, the price is still below the middle band, and the sellers’ advantage has weakened in recent days. A sustained move above $78.5K, accompanied by a consistently positive balance of taker trades, would signal improvement. The main risk is renewed selling pressure and a price break below the lower band near $76.6K.
Live Charts
Explore the metrics behind this brief with live, auto-updating charts:
Funding Rates - Perpetual futures funding to track long-side or short-side leverage pressure.
Open Interest (BTC) - Total futures positioning and 7-day BTC-denominated change.
Exchange Netflow - Net BTC moving to and from exchanges across positive and negative flow regimes.
Coinbase Premium Index - Coinbase vs global market premium as a proxy for US spot demand pressure.
Fear & Greed Index - Composite market sentiment for risk appetite and sentiment extremes.