
Bitcoin is trading at $97.6K, 21.8% below its October peak, two out of three metrics indicate a transition to a bearish phase, Death Cross may occur within the next 24 hours, marking the final transition to the red zone.
TL;DR
A Death Cross will form on the market in the coming hours, confirming the third bearish signal.
#Bitcoin #BearMarket #TechnicalAnalysis #OnChain
Bitcoin Bear/Bull Market 1Y
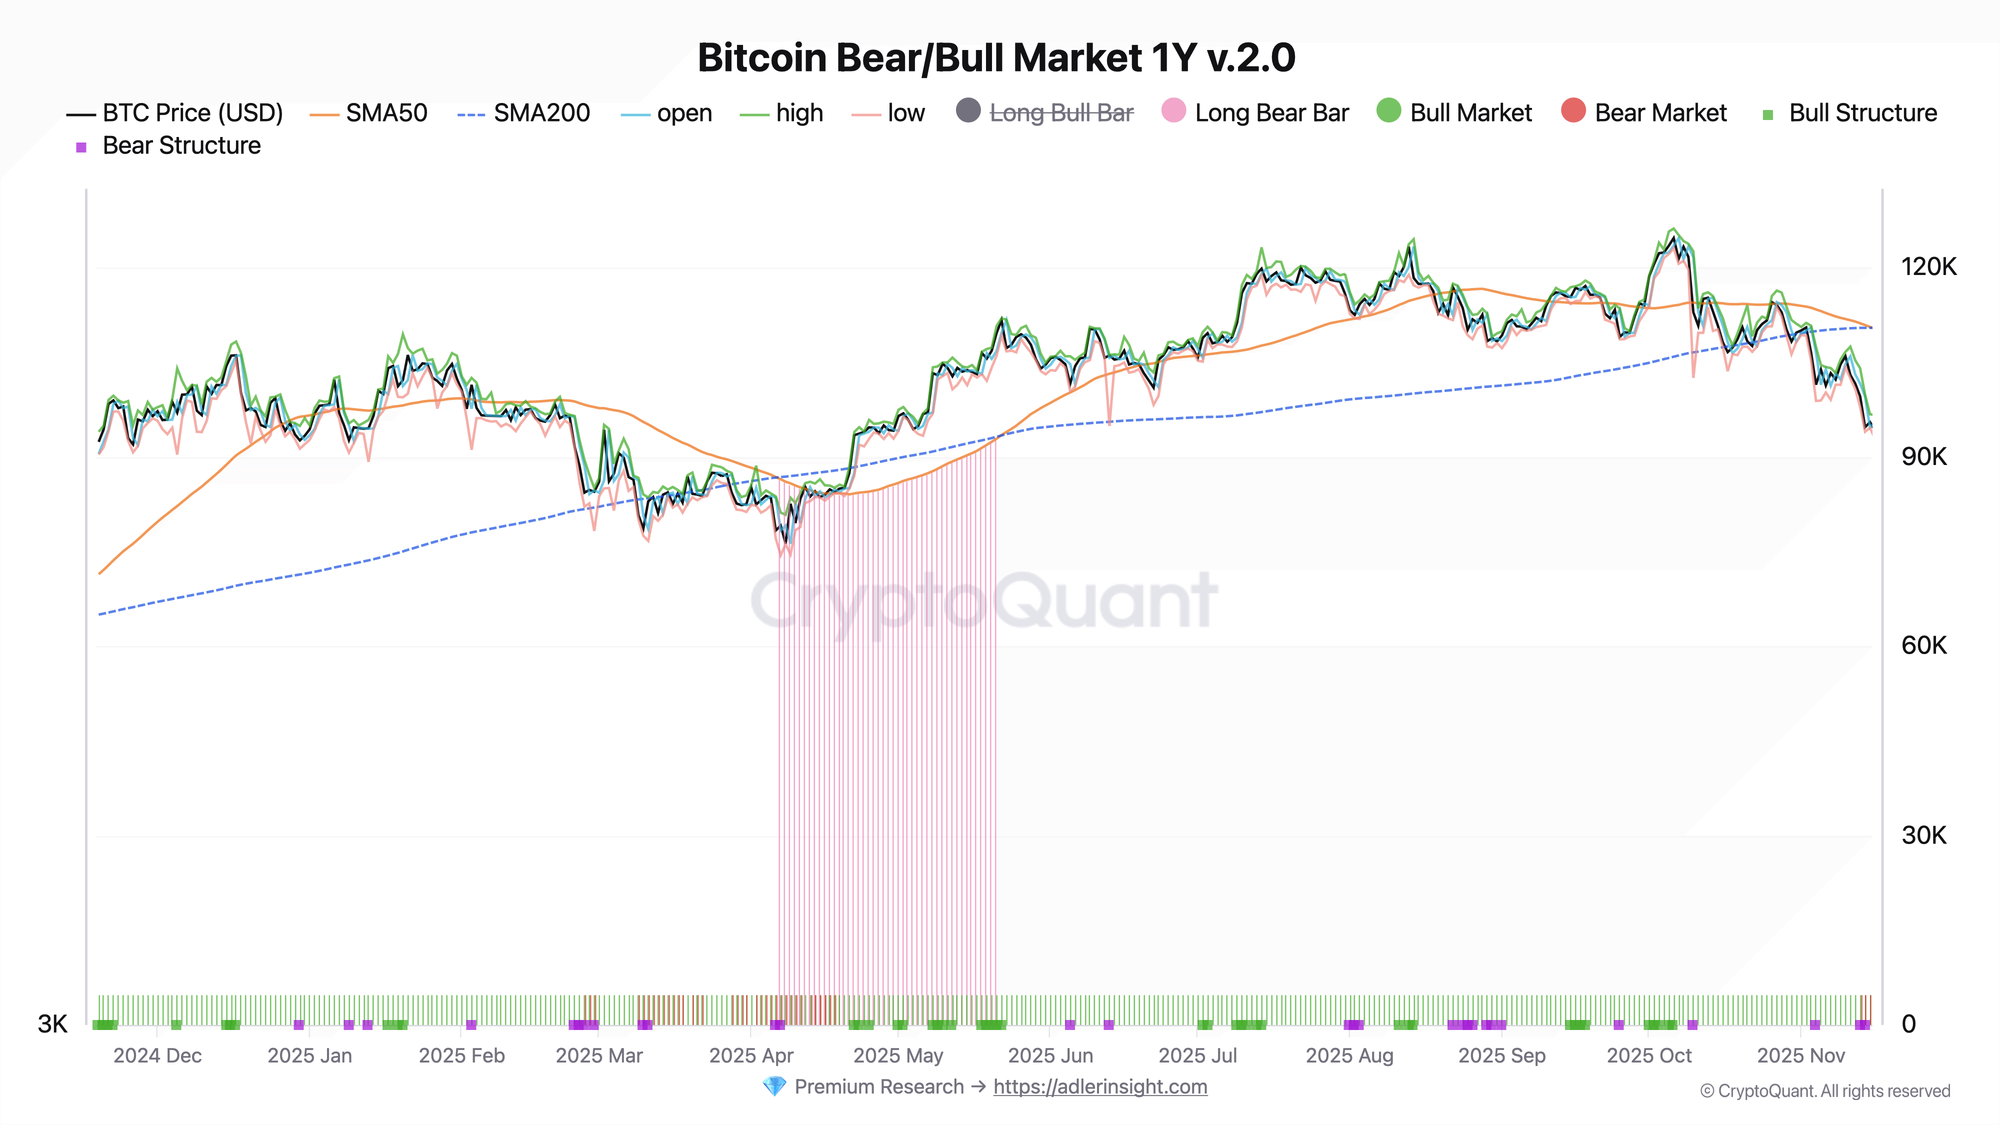
Two out of three metrics are already bearish - price is 11.7% below SMA200, lower highs/lower lows structure since November 13. The chart shows a classic transition from bullish phase (green bars until October) to bearish (pink-red from November). Current price of $97.6K is trading below both moving averages: SMA50 = $111K, SMA200 = $110.5K. Critical moment for the market.
According to Bloomberg and Goldman Sachs standards:
(1) trend relative to SMA200 - bearish,
(2) price structure - bearish,
(3) Death Cross on the verge of formation.
At the current pace, Death Cross will occur tomorrow, adding the third bearish signal and definitively repainting the regime to Strong Bear.
Bitcoin Support and Resistance
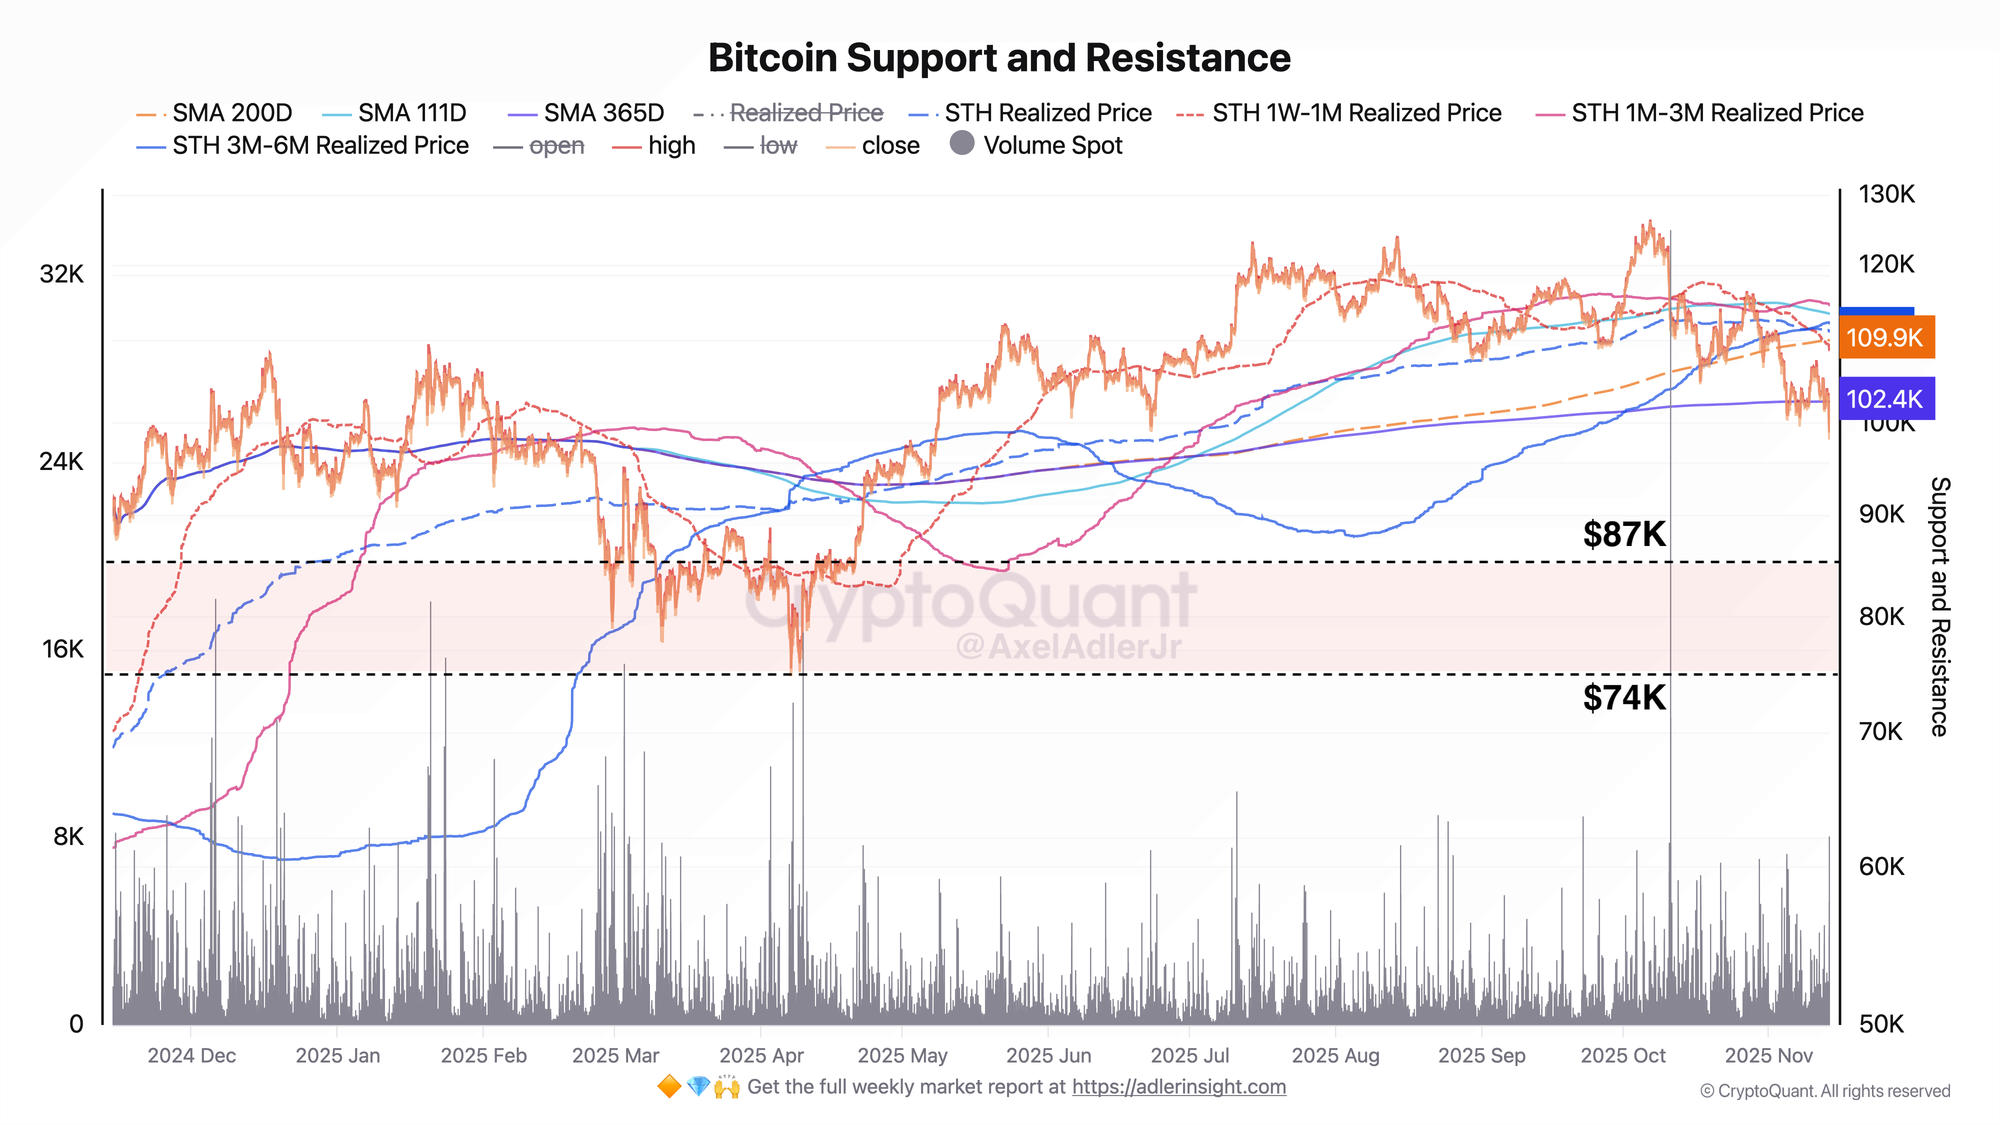
All key metrics have flipped to resistance. A complete structural inversion has occurred on the chart: what was previously support (STH metrics, annual MA) now presses from above. Below $102K there's a vacuum down to the $87K and $74K zones - these are levels where the base was formed in March-April. The Bitcoin Bear/Bull Market 1Y chart shows the reversal (two metrics bearish, third on the edge), while the Bitcoin Support and Resistance chart demonstrates the result of this reversal - complete absence of support above $102K and dense overhead resistance in the $109-115K zone.

FAQ
What does the current picture on the Bear/Bull Market 1Y chart mean?
The market has technically turned bearish. Death Cross within the next 24 hours will settle the matter definitively.
How to interpret the signals from the Support and Resistance chart in today's context?
The chart shows structural weakness, all key metrics have flipped from support to resistance.
CONCLUSIONS
Death Cross occurs within the next 24 hours at a price below $102.4K, triggering the transition to bearish regime and leading to a test of $87K