
Liquidity supports BTC, inflows remain steady, and LTH are not hindering growth yet.
TL;DR
Bullish backdrop: liquidity and on-chain inflows support a pull toward fair value with increased overheating risk at z 2.0+. Base case for the quarter - $105–145k range with z rising to 2.0–2.1, upside to $140–165k possible with additional liquidity/derivatives. Early reversal signs: weakening inflow (z→0) and LTH distribution rising into positive territory for several weeks.
#US-LIQUIDITY #BTC #LTH
Bitcoin US Liquidity Bands - Weekly (Power-Law + FRB/M2)
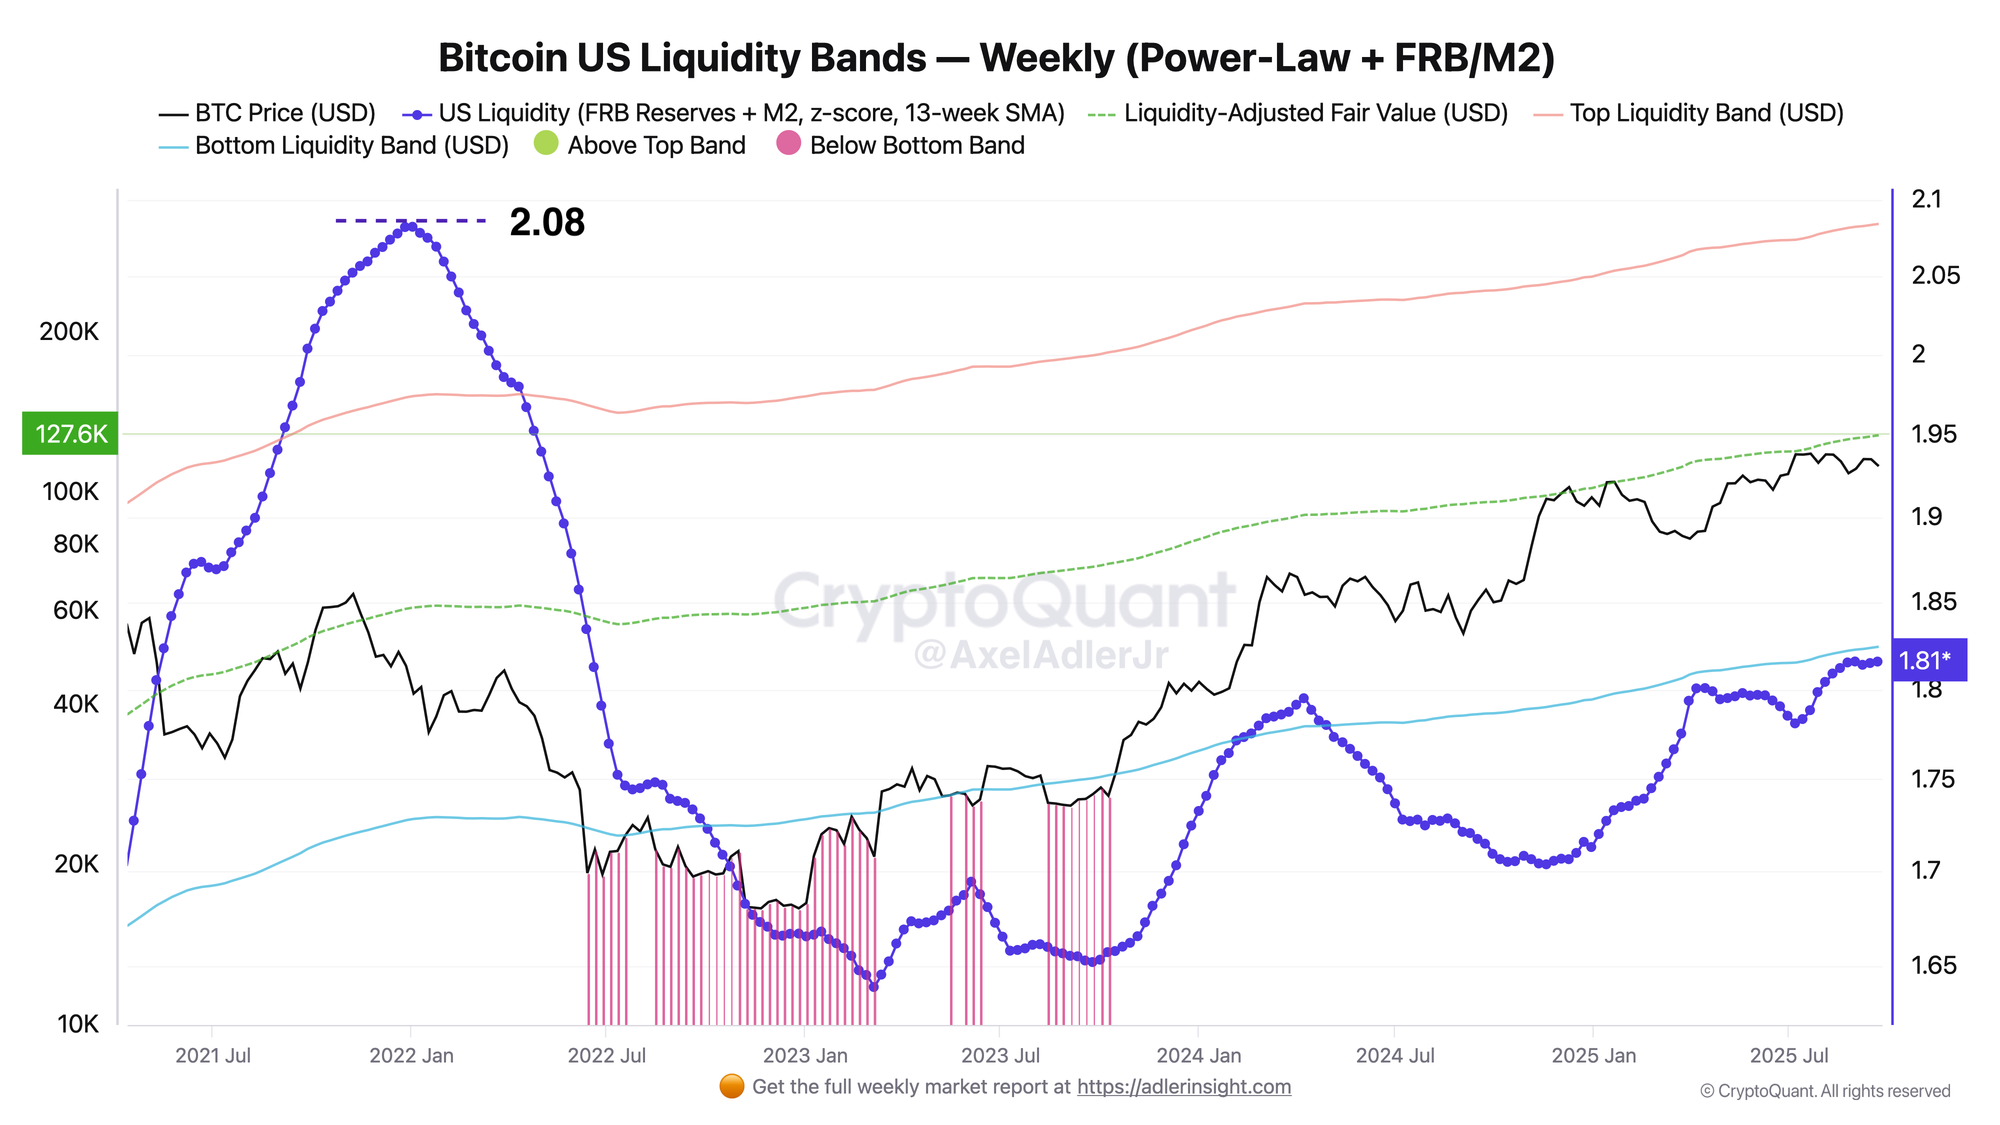
The chart shows how the US dollar liquidity composite (Fed reserves + M2, z-score, 13-week SMA) shifts Bitcoin's "fair" price and acceptable price corridor. The higher the z, the higher the green dashed Liquidity-Adjusted Fair Value ($127.6k) and the easier it is for price to hold above it; when z falls, support weakens. Currently z = 1.81 - liquidity is notably above average, backdrop is bullish: price is trading slightly below the fair value area ($127k) and dips are more often bought up while z holds >1.5. As z approaches 2.0, the risk of late-cycle overheating increases.
For the coming quarter (with one more Fed rate cut of 25 bps), the base scenario is gradual z growth to 2.0–2.1 with slow fair value increase, expected price range $105–145k with bias toward fair value. Breaking higher will require additional liquidity momentum or more aggressive inflow through derivatives; if z rises and consolidates closer to 2.0, the window will expand to $140–165k, but the risk of an "overheated" cycle top will increase significantly.
Bitcoin LTH Distribution (≥12m, 13w SMA, z)
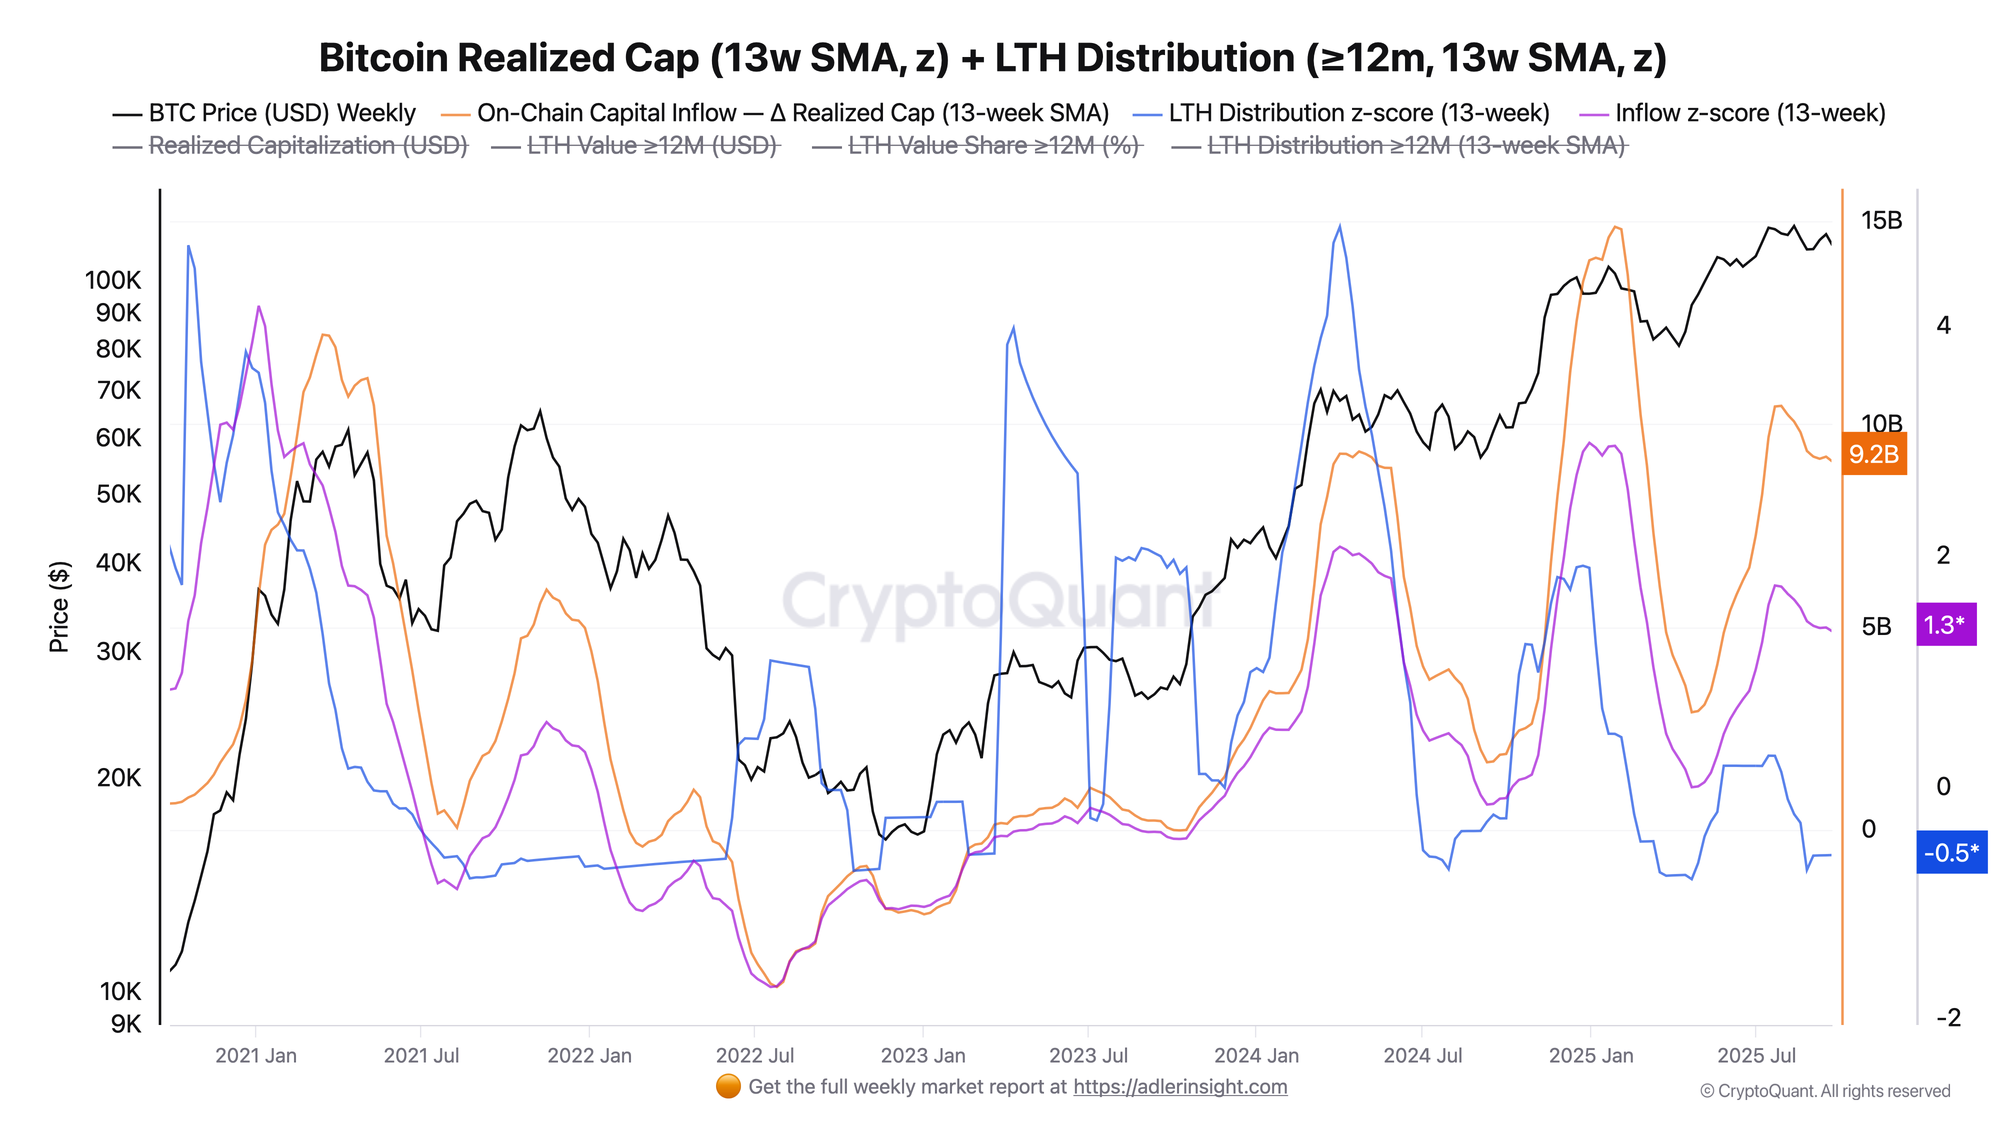
The current picture is constructive: 13-week on-chain capital inflow (Δ Realized Cap) remains notably above average at around $9.2B on 13-week smoothed SMA, with z-score +1.3. This means fresh money continues to "lock in" on-chain, supporting price after corrections. Meanwhile LTH Distribution z −0.5 - sales of "old" coins are below normal, meaning long-term holders are holding their supply rather than taking profit. Combined with high dollar liquidity, this creates a bullish backdrop: demand is coming in, while opposing supply from LTH is not pressing.
Related metric: Exchange Netflow often acts as a faster confirmation of inflow/outflow dynamics, especially around turning points.
If you want to understand how to interpret inflows and outflows correctly:
→ Bitcoin Exchange Netflow: What It Is and How to Use It
Risks are visible but not yet realized: inflow cooling is already noticeable relative to summer peaks, so momentum without strengthening derivatives or macro-liquidity may remain step-wise. Two signs to watch for reversal - sustained decline of inflow z toward zero and LTH Distribution z moving into positive territory for several consecutive weeks; this combination coincides with overheating phases and deeper pullbacks. For now, the balance of forces - "inflows above normal, distribution below normal" - rather implies buying of dips and testing of fair levels above current price.

Conclusions
US liquidity is above normal, fair value $127.6k is above current price, on-chain inflow is stable ($9.2B), LTH sales below normal - bullish backdrop with bias toward pulling up to fair value.