


🎧 Morning Brief #179 - audio debate on today’s market setup
Two key flow indicators simultaneously point to intensifying seller pressure. The 30-day BTC net flow turned positive for the first time since March - coins are returning to exchanges. At the same time, stablecoins are leaving CEXs at a record pace, depriving the market of buying power.
TL;DR
BTC is returning to exchanges after months of outflows, while stablecoins are simultaneously leaving exchanges - this is a double risk-off signal. The brief explains why this configuration is dangerous and which trigger will determine the next scenario.
Bitcoin 30D Net Flow (BTC)
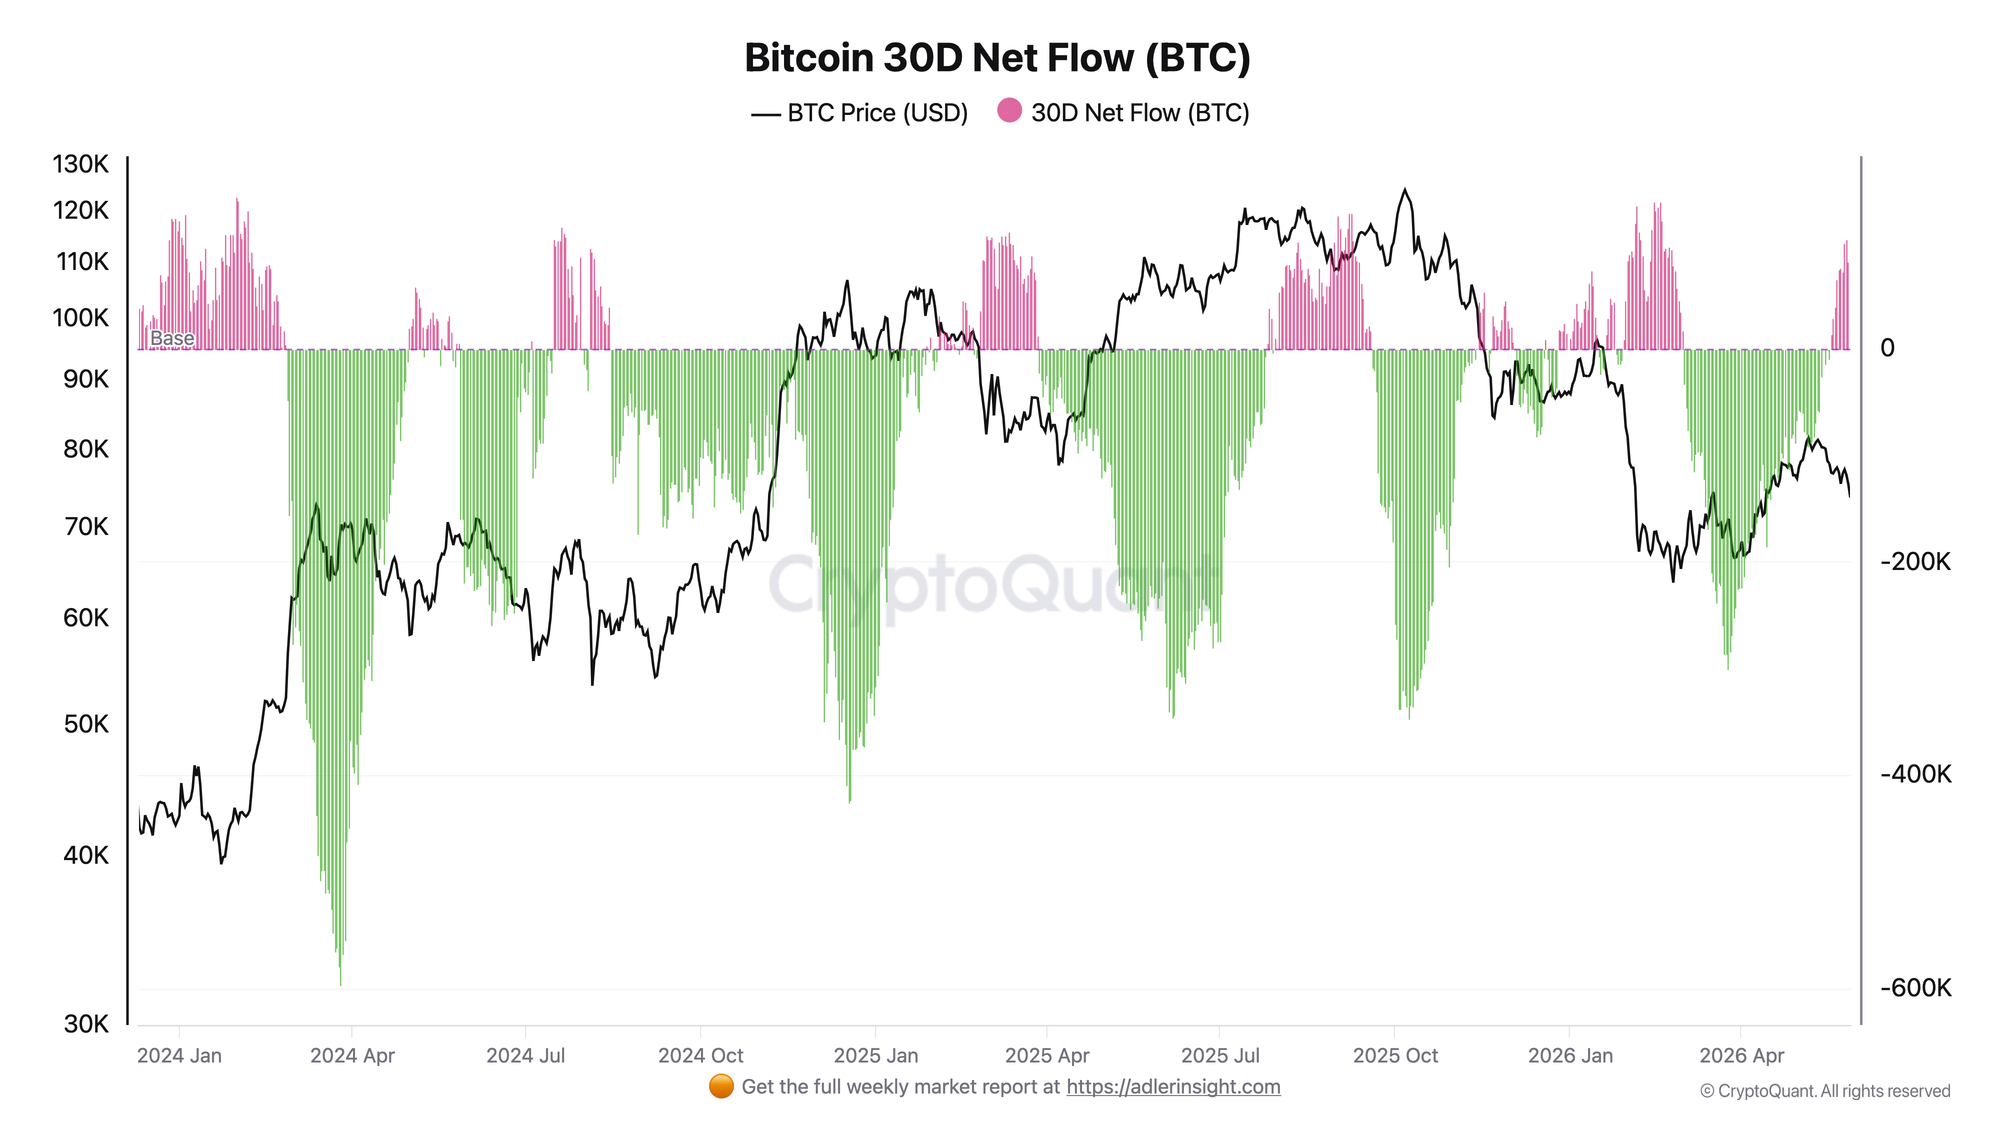
This is the 30-day cumulative BTC net flow on exchanges. Positive values, marked by pink bars, indicate net inflows to exchanges. Negative values, marked by green bars, indicate net outflows from exchanges.
From March through the end of May, the market went through a full reversal of the flow regime. At the end of March, net flow reached an extreme of around -300K BTC - this was the largest 30-day withdrawal from exchanges within the current cycle, coinciding with the price correction to $66-67K. At that point, the market was in a phase of aggressive accumulation: coins were moving into cold storage.
From April, outflows began to shrink, and on May 18 a key turning point occurred - net flow entered positive territory for the first time in two months, reaching +14K BTC. After that, inflows began to rise quickly: +65K BTC by May 21, a peak of +103K BTC on May 26, and +72K BTC as of May 28. Over the same period, the price fell from $80K to $73.7K.
The transition of net flow from negative to positive against a backdrop of falling price is a classic risk-off pattern. Coins are returning to exchanges, increasing the available supply for sale. Accelerating inflows during a price decline may indicate either profit-taking or preparation for a deeper correction. The deterioration trigger is further growth in net inflow above +100K BTC. The stabilization trigger is a return of the flow to zero or back into negative territory, which would mean the resumption of accumulation.
Stablecoin Net Flow - 30D SMA
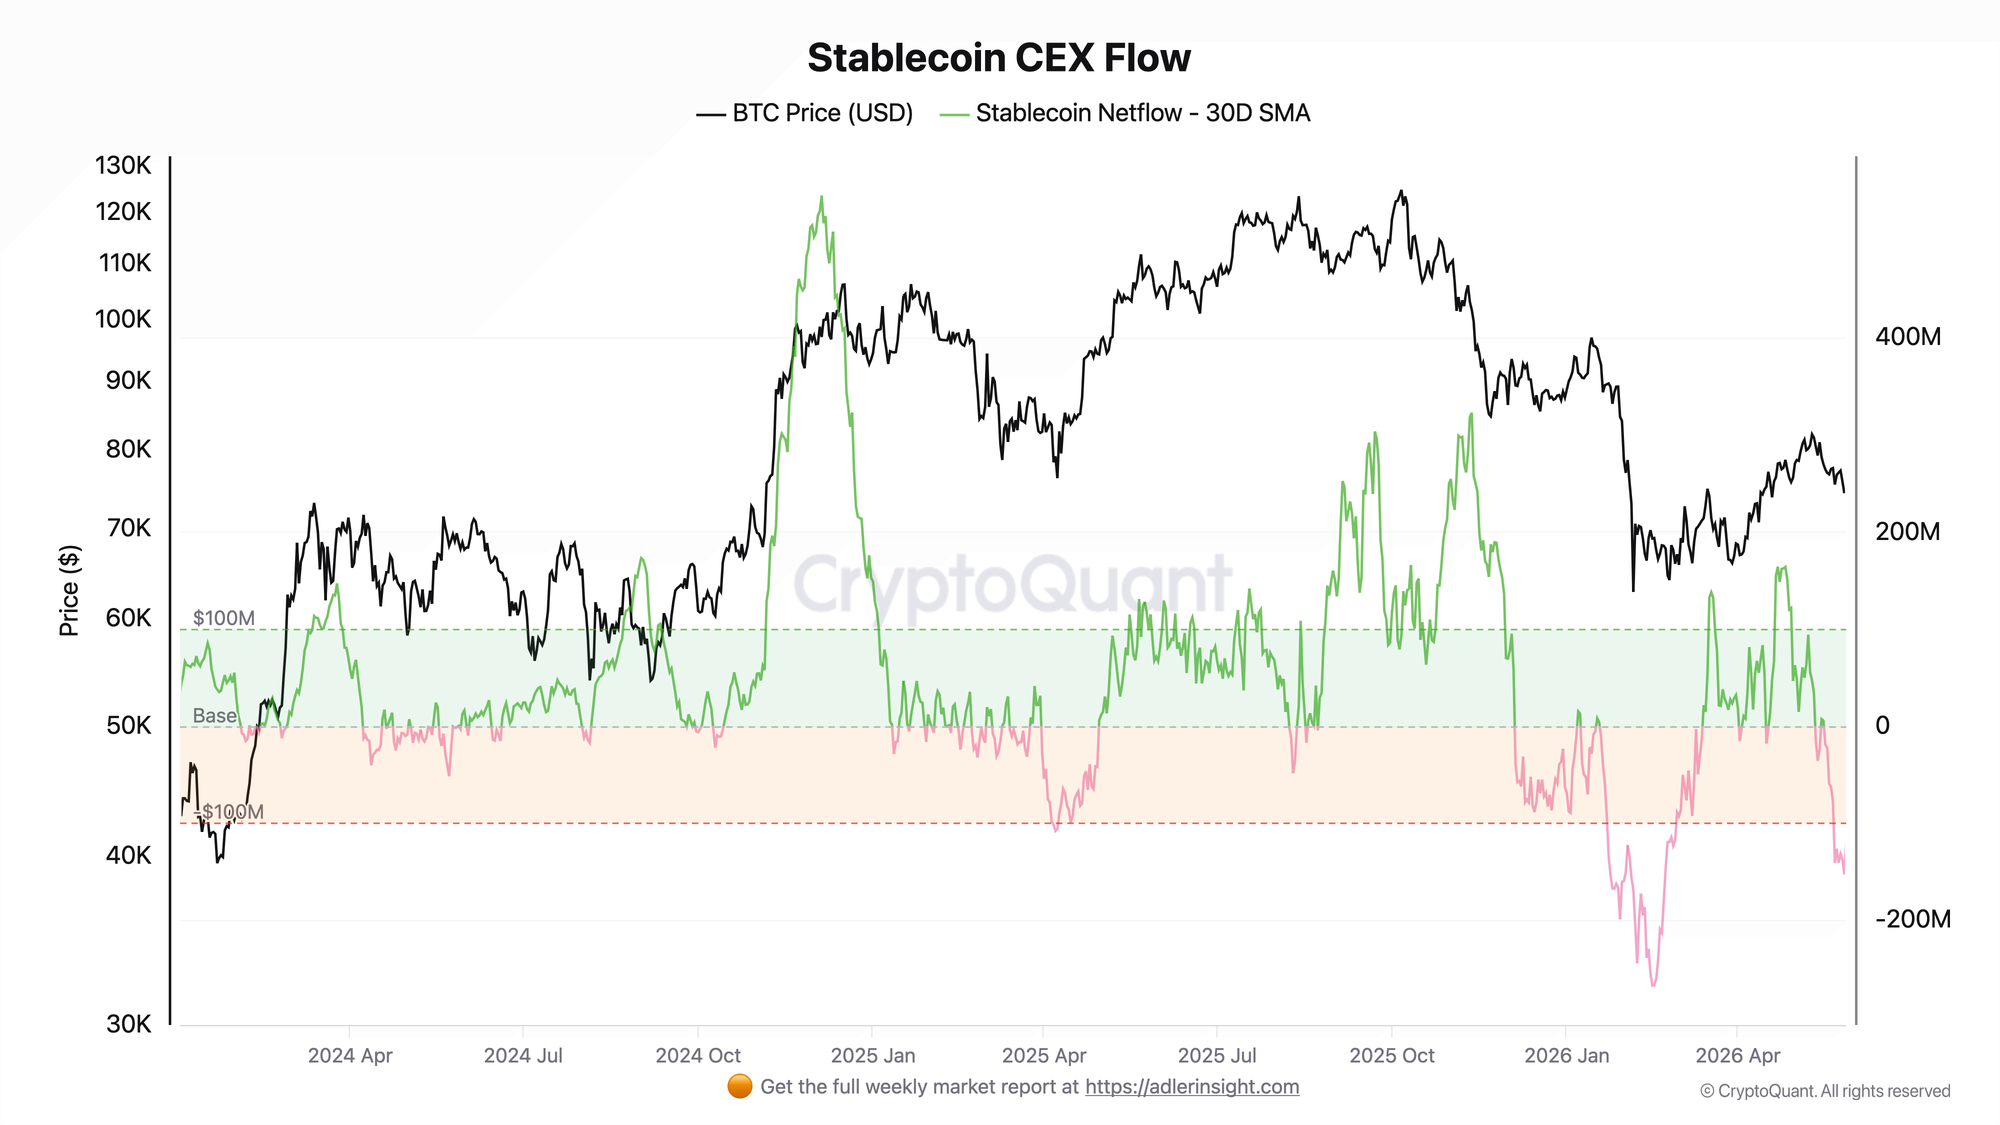
This is the 30-day moving average of stablecoin net flow to centralized exchanges. Positive values indicate liquidity inflows to exchanges and readiness to buy. Negative values indicate liquidity outflows and declining buying pressure.
The reversal in stablecoin flow happened rapidly. As recently as April 22-26, the 30D SMA was at a local peak of around +$164M per day - this was the highest level since the beginning of the year, coinciding with the price rebound into the $77-78K zone. By May 15-16, the indicator briefly touched zero, after which it moved into sustained negative territory.
The decline then accelerated: -$60M by May 19, -$141M by May 22, and a low of -$153M per day on May 27 - the lowest value since March. By May 28, the outflow had slowed slightly to -$119M per day, but the indicator remains deeply in negative territory.
Stablecoin outflows from exchanges mean a reduction in the amount of readily available buying liquidity on CEXs. When this happens simultaneously with BTC inflows to exchanges, the market gets an unfavorable flow configuration: exchange supply is rising, while the amount of liquidity capable of quickly absorbing that supply is declining. A reversal of stablecoin flow back to zero will be the first sign of stabilization.
Both charts are pointing in the same direction - risk-off. BTC is being sent to exchanges, increasing the supply available for sale, while stablecoins are being withdrawn from exchanges, reducing demand - both sides of the equation are working against price.
Outperform Buy & Hold with a rules-based strategy - Start free. One weekly action, clear triggers, and invalidation levels. No guessing.
FAQ
Why is simultaneous BTC inflow and stablecoin outflow from exchanges a strong bearish signal?
Exchange flows reflect participant intent. When BTC is sent to exchanges, it increases the overhang of supply - coins become available for sale. When stablecoins simultaneously leave exchanges, the market loses the liquidity that could absorb that supply. The result is an imbalance: there are more potential sellers than buyers. Historically, such configurations have more often preceded either a deeper correction or a prolonged consolidation.
What could break the current risk-off regime?
There are two key triggers. The first is a reversal of BTC net flow back into negative territory, when coins once again begin leaving exchanges and accumulation resumes. The second is a reversal of stablecoin flow into positive territory, when buyers return liquidity to CEXs. Even the appearance of one of these signals would weaken the bearish setup. The appearance of both at the same time would mean a full transition into risk-on.
CONCLUSIONS
The flow picture remains bearish. BTC net inflow to exchanges rose from zero to +103K BTC in just ten days, while stablecoins are leaving exchanges at a pace of -$119-153M per day. This is double pressure on price: supply is rising while demand is contracting. The regime remains risk-off.
The main trigger for improvement is a reversal in at least one of the two flows: a return of BTC net flow into negative territory or a reversal of stablecoin flow back toward zero. The main risk is further acceleration in both trends, which would create the conditions for a break below current price levels.
Live Charts
Explore the metrics behind this brief with live, auto-updating charts:
Exchange Netflow - Net BTC moving to and from exchanges across positive and negative flow regimes.
Coinbase Premium Index - Coinbase vs global market premium as a proxy for US spot demand pressure.
BTC US ETF Flow Monitor - US spot Bitcoin ETF daily flow, BTC-denominated accumulation, and fund leadership.
SOPR - Spent Output Profit Ratio shows whether moved coins realize profit or loss.