


🎧 Morning Brief #178 - audio debate on today’s market setup
The April recovery has been completely erased. Bitcoin Price Structure fell from +0.78 to -0.56 in three weeks - faster than it rose over five weeks. Short-term holders have started sending coins to exchanges at a loss for the first time in six weeks. Two charts show how technical degradation and STH behavior converged at one point - near Donchian Support at $74.5K.
TL;DR
Bitcoin Price Structure entered the High Bear zone after a three-week reversal, while STH shifted from profit-taking to loss realization. Price is pressed against the lower boundary of the channel. Now the nature of pressure at support will determine whether the market can avoid the next impulse lower.
Bitcoin Price Structure
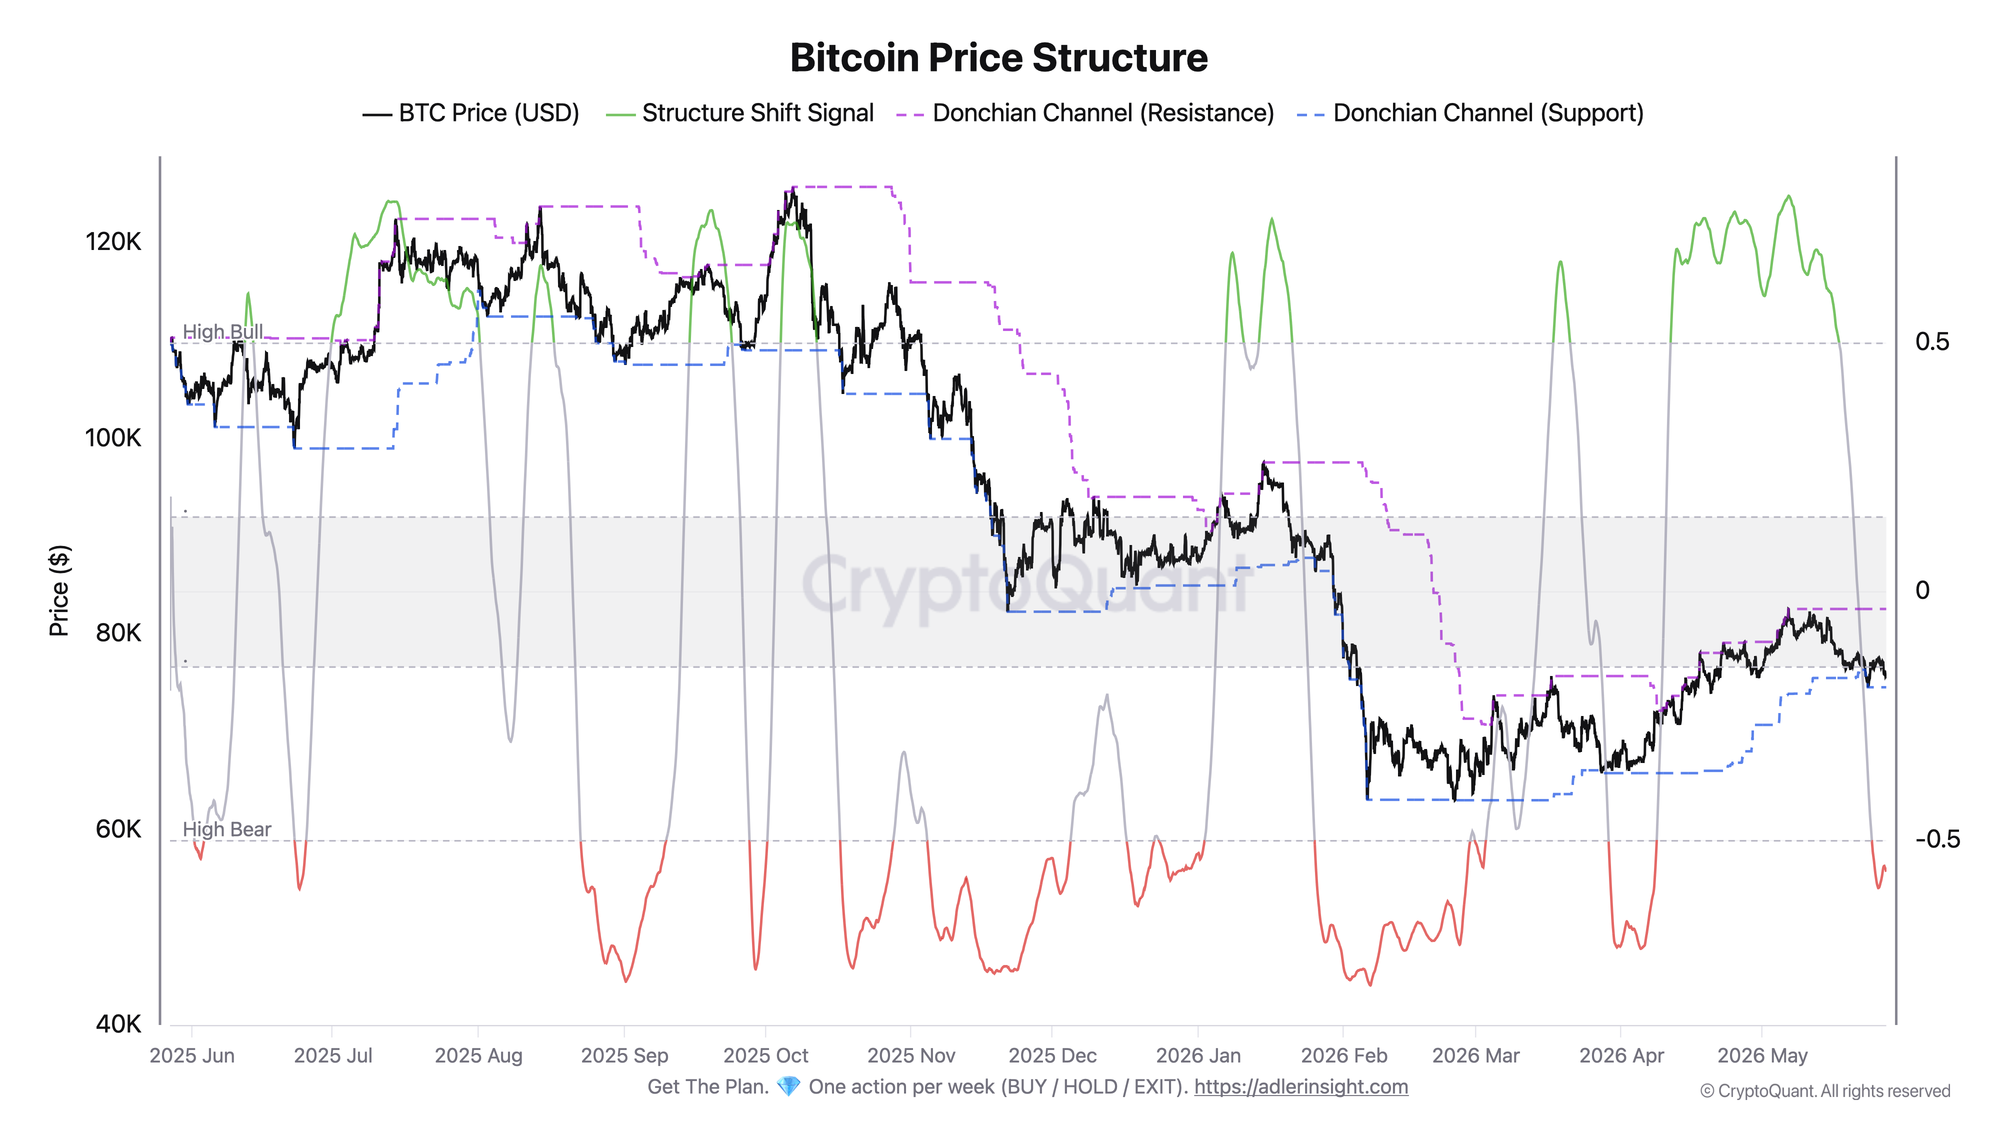
The composite structure indicator combines the EMA trend, price position inside the channel, and directional movement. Donchian Support/Resistance are calculated on a 21-day window.
The April reversal was convincing: the signal moved from -0.72 in early April, when price was near $67K, to +0.78 by May 7, when BTC reached $82.5K. This was a classic transition from High Bear to High Bull over five weeks.
But from mid-May, the move reversed, and it happened much faster. In three weeks, the signal collapsed to -0.56, returning to the High Bear zone. Price is now trading around $75.6K - about 1.5% from Donchian Support ($74.5K), while resistance remains far above, at $82.5K.
The asymmetry between the speed of breakdown and recovery is a characteristic sign of a phase where sellers control the structure. The key level now is $74.5K. A break below Donchian Support would open space toward the early-April levels ($67-68K). Holding support with a Structure Shift reversal above -0.3 would be the first sign of stabilization.
Bitcoin STH Net Profit/Loss to Exchanges
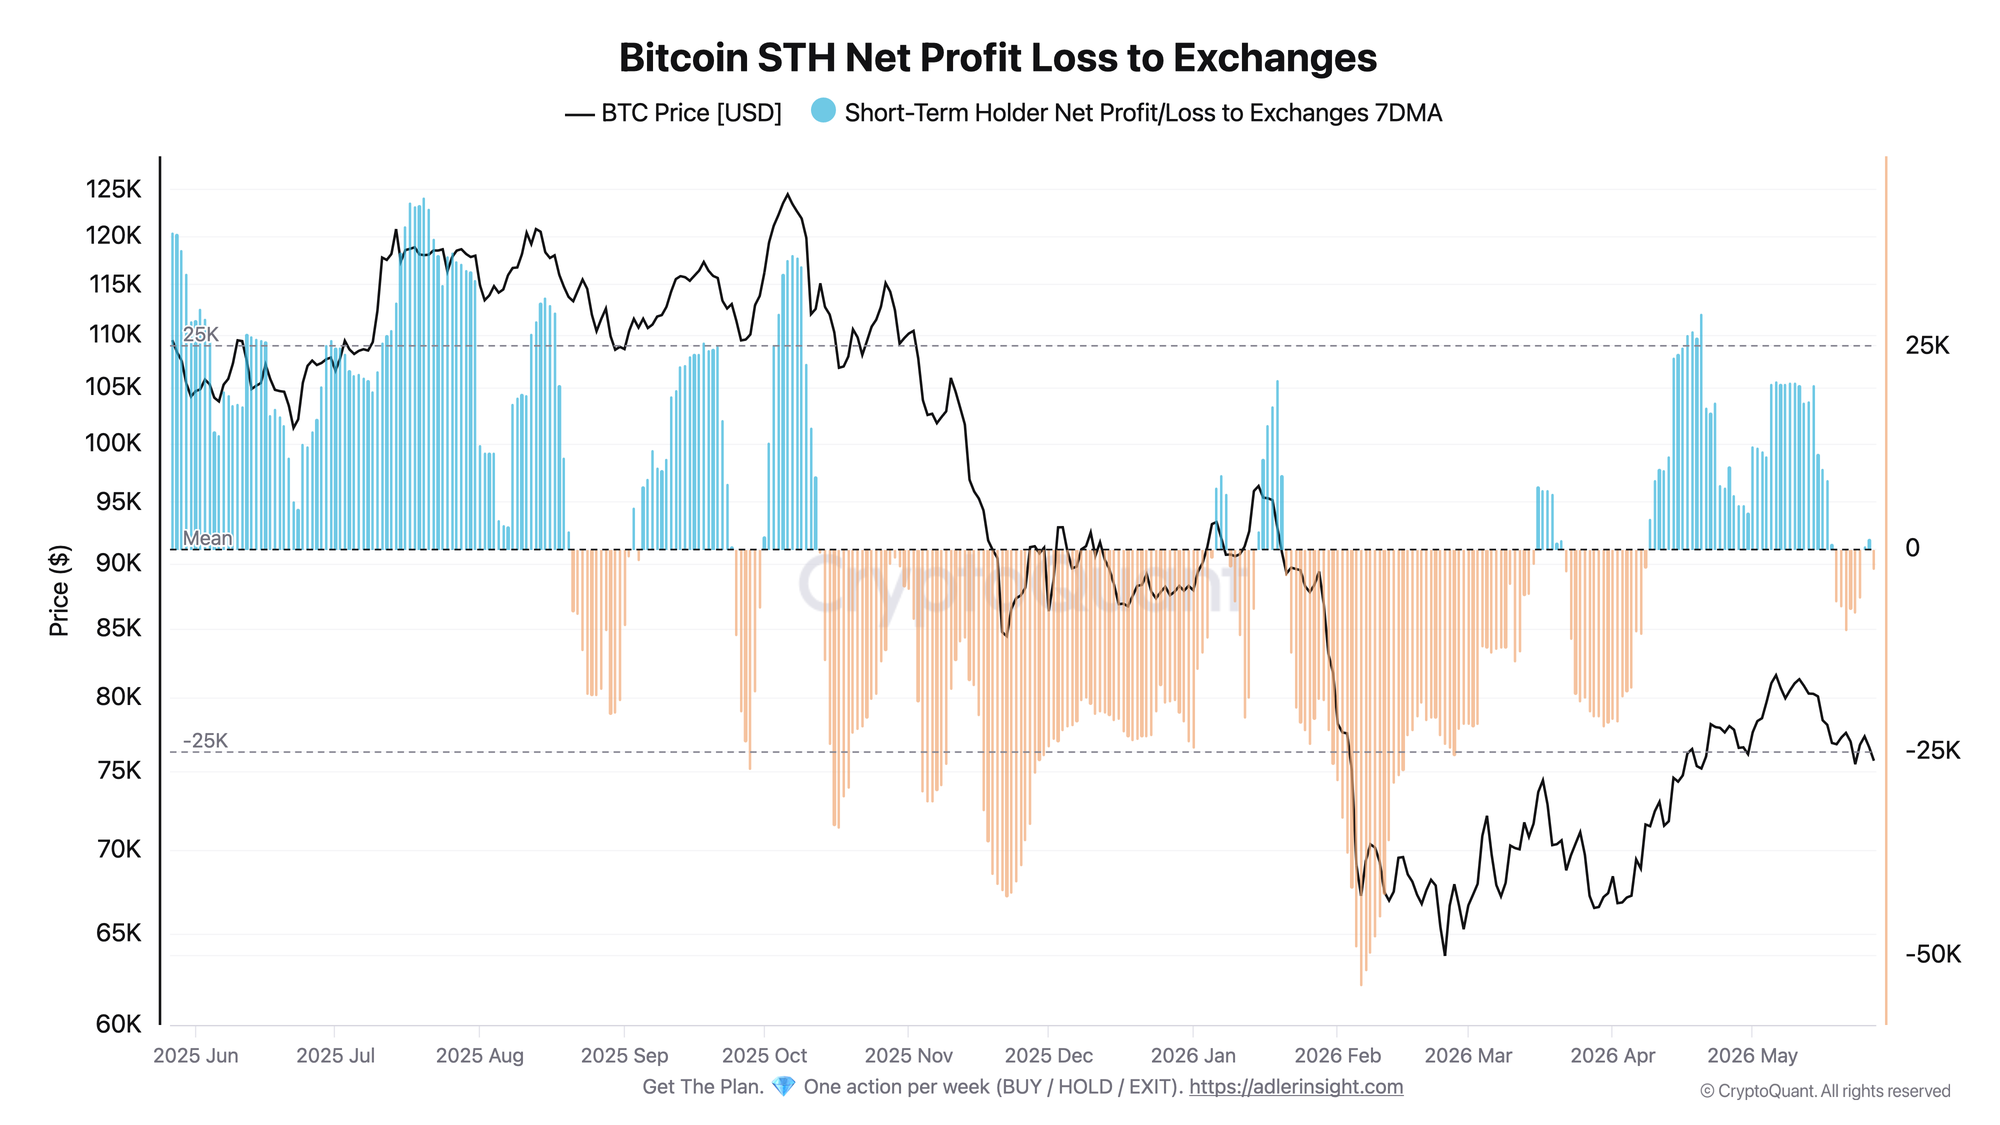
The indicator shows the net volume of BTC that short-term holders send to exchanges in profit or loss. A 7-day moving average is used alongside BTC price.
From April 9 to May 18, STH were continuously in profit-taking mode: the metric held in a range from +5K to +29K BTC. This coincided with price rising from $68K to $82K and confirmed the healthy nature of the rally - profits were being realized into strength.
The break came on May 19: STH Net Profit/Loss to Exchanges moved into negative territory (-6.5K BTC) and reached -10K BTC over the following days. Today’s value is -2.5K BTC. Pressure has eased, but the regime remains loss-driven, with brief attempts to return to zero.
The scale of current losses is still moderate. It is still far from the February capitulation, when NPL reached -53.8K BTC with price around $67K. This means the market is in the early phase of stress, not full panic.
But direction matters more than the absolute value. If STH Net Profit/Loss to Exchanges starts deepening again as price moves toward $74.5K, it will signal rising capitulation among STH who bought in the $78-82K range.
Both indicators reversed synchronously during the week of May 18-19: Structure Shift crossed below the zero line, while STH Net Profit/Loss to Exchanges turned negative for the first time in six weeks. The overlap between the technical and behavioral signals increases the significance of the current support.
Reading the signal is not enough - you need to act on it. Weekly Engine turns on-chain data into one clear decision per week, with risk caps and invalidation built in. Start free.
FAQ
Why did the structure break down faster than it recovered? The composite signal consists of three components: price position inside the channel, the EMA trend, and directional movement. During a decline, the channel position switches sharply: resistance remains at the old highs, while price quickly approaches support. At the same time, the fast EMA crosses below the slow EMA, and volatility normalization accelerates signal saturation. During recovery, everything works more slowly: price first needs to move away from support, then hold higher, and only after that does the trend component catch up. That is the asymmetry: structure breaks faster than it recovers.
Under what conditions will STH stress turn into full capitulation?
The criterion is a sustained deepening of STH Net Profit/Loss to Exchanges below -25K BTC alongside a simultaneous break below Donchian Support ($74.5K). In February, capitulation was accompanied by STH Net Profit/Loss to Exchanges in a range from -40K to -54K BTC. The current -2.5K BTC is the early stage of stress. The order-of-magnitude difference means the market still has room to stabilize if support holds.
CONCLUSIONS
The three-week reversal in Structure Shift from High Bull to High Bear coincided with STH shifting from profit-taking to loss realization. Two independent signals confirm the regime shift. Price is roughly 1.5% from Donchian Support at $74.5K, and this level is the main trigger. Holding support with a slowdown in STH loss flows would open the possibility of stabilization. A break below $74.5K with STH Net Profit/Loss to Exchanges deepening below -10K BTC would activate a move toward $67-68K - the levels where the April recovery began.
Live Charts
Explore the metrics behind this brief with live, auto-updating charts:
STH-SOPR - Short-term holder profit/loss behavior around the 1.0 breakeven threshold.
Exchange Netflow - Net BTC moving to and from exchanges across positive and negative flow regimes.
Realized Price Bands - Dynamic realized-price valuation zones from live BTC price and on-chain cost basis.
SOPR - Spent Output Profit Ratio shows whether moved coins realize profit or loss.