


🎧 Morning Brief #177 - audio debate on today’s market setup
Bitcoin recovered +2.7% from the May 23 low, but by May 26 buyer aggression in the perpetual order book had collapsed by nearly 50 points. The structure of the rally failed the test.
TL;DR
We break down the May 23-25 rally and the May 25-26 pullback through two futures microstructure indices. The logic is simple: price is still holding up, but the fuel from takers disappeared first.
Bitcoin Futures Microstructure
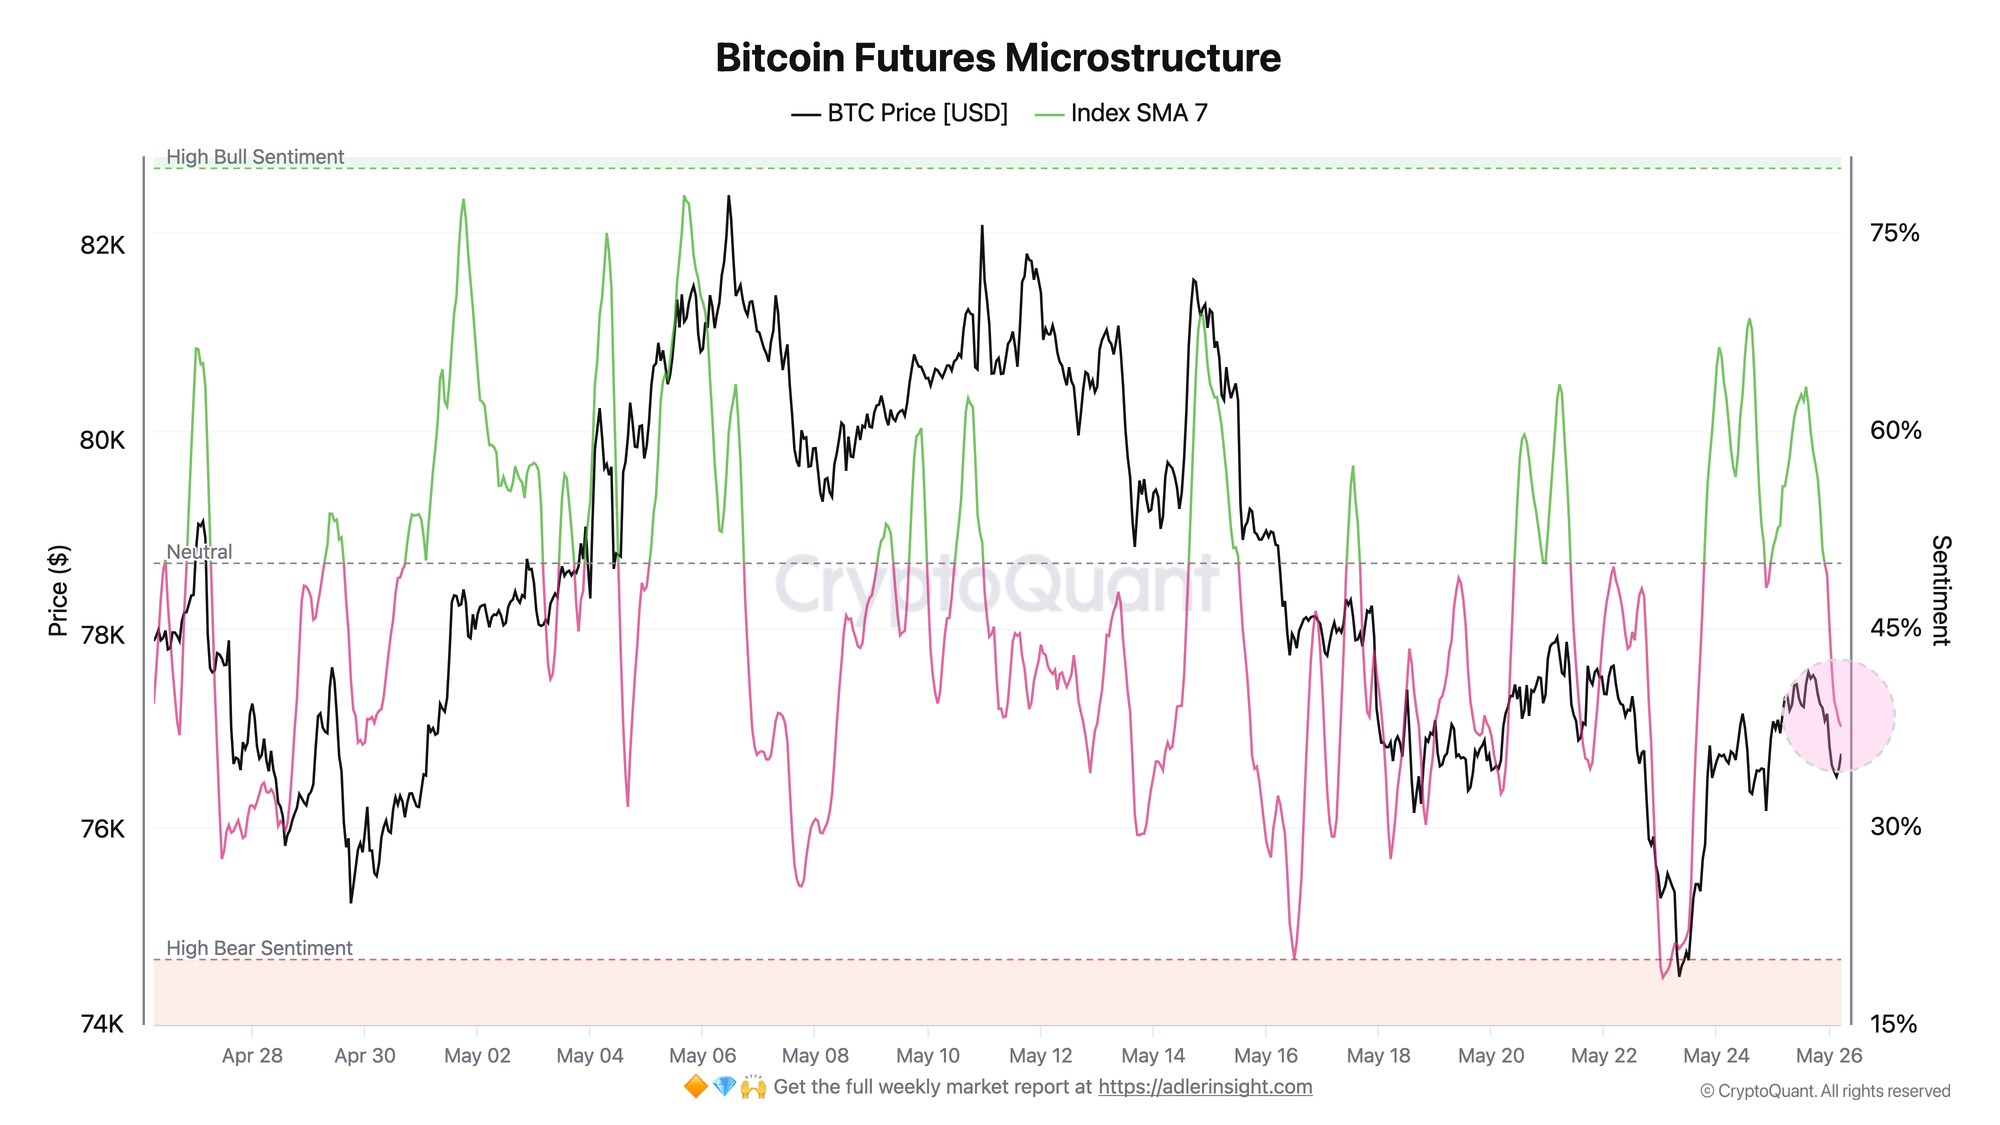
The Microstructure Composite Index (SMA-7) is an aggregate of taker flows, open interest, volume, and returns. The scale runs from 15-85% and is divided into High Bull / Neutral / High Bear zones.
At the May 23 low, the index was around 19 - deep in the High Bear zone, in sync with the price drop to 74.5K. Over the next two days, it recovered convincingly: it moved through the neutral zone and rose to 62-63, while price rebounded to 77.6K. However, on May 25-26, aggregate sentiment pulled back to 37.6 - into the lower half of the range, closer to the bearish side.
This recovery was real, but short-lived. A move back below neutral means aggregate pressure has shifted back toward sellers. The trigger for further deterioration would be an SMA-7 hold below 35 with a move toward the High Bear zone. Confirmation of improvement would be a renewed break back above neutral without a rapid pullback.
Bitcoin Taker Score
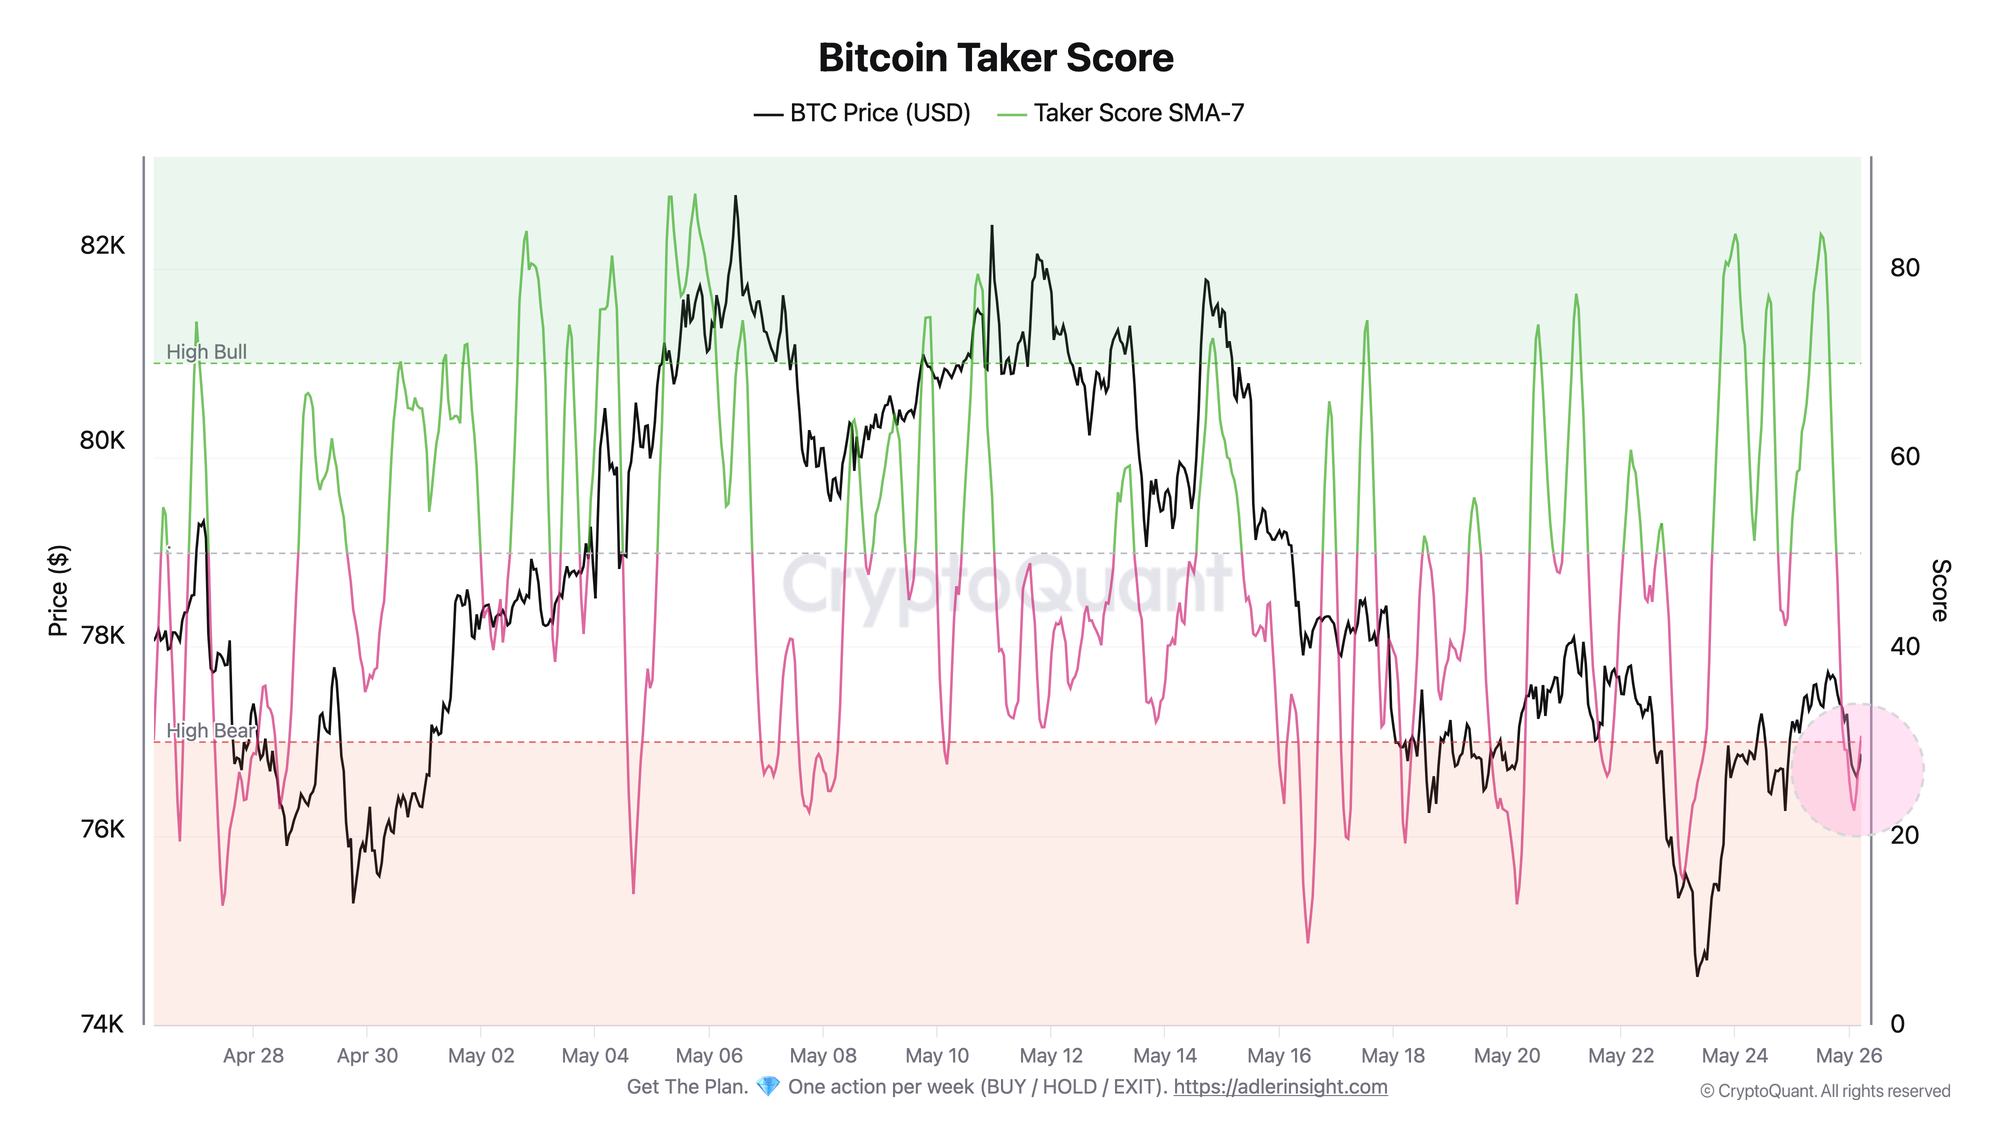
Taker Score (SMA-7) isolates the heaviest component of the composite index - the balance of aggressive buying and selling in the perpetual order book. The scale runs from 0-100 with High Bull and High Bear thresholds.
During the May 23-25 rally phase, Taker Score performed even more strongly than the composite index: it surged from 19 to 84 - deep into the High Bull zone, confirming that aggressive buyers were the main force behind the rebound. But over May 25-26, this component reversed more sharply than all the others: a drop from 84 to 31 in less than a day, almost to the very edge of the High Bear zone. Over the same window, price lost only 0.65%.
Takers exited the market faster and more deeply than the composite index declined. The flow of aggressive buying has dried up, while price is still holding mostly on inertia. This is a classic picture of demand exhaustion. A sign of stabilization would be a return and hold of the metric above neutral.
The linkage looks like this: the collapse in takers, which carry a 0.35 weight in the composite index, dragged Bitcoin Futures Microstructure back below neutral and into the red zone again. For now, the composite index only softens the picture because of the other components, but the root source of weakness is obvious - the disappearance of buyer flow. That is the main signal today.
Outperform Buy & Hold with a rules-based strategy - Start free. One weekly action, clear triggers, and invalidation levels. No guessing.
FAQ
Why is price still holding up if both indices have fallen?
Price reacts with a delay: takers shape real-time flow, while the price level itself can remain supported by residual inertia. A divergence of the form "index down - price sideways" often serves as an early warning of weakness.
What should count as a regime shift toward risk-off?
A sustained Taker Score SMA-7 in the High Bear zone together with the composite index falling below 35. As long as both indices remain above their bearish thresholds, this is more of an impulse correction than a confirmed reversal.
CONCLUSIONS
The May 23-25 rally was structurally confirmed: both indices moved out of the High Bear zone in sync, and aggressive takers became the primary driver of the rebound. But the May 25-26 pullback exposed how fragile that structure was: Taker Score collapsed from 84 to 31, dragging the composite index back below neutral to 37.6, while price itself declined only marginally. The current regime is neutral with a risk-off tilt: buyer-side fuel disappeared before price did. The main deterioration trigger is Taker Score moving into High Bear with confirmation from the composite index below 35. The main risk is that price inertia will soon give way to downside, following the already cooled microstructure.
Live Charts
Explore the metrics behind this brief with live, auto-updating charts:
Funding Rates - perpetual funding tracking long- or short-side leverage pressure
Open Interest (BTC) - total futures positioning and 7-day BTC-denominated change.
Coinbase Premium Index - Coinbase vs global premium as a proxy for US spot demand.
Exchange Netflow - net BTC moving to and from exchanges across flow regimes.
Fear & Greed Index -composite market sentiment for risk appetite and extremes.