


🎧 Morning Brief #176 - audio debate on today’s market setup
Over the past week, the local picture for BTC deteriorated: exchange netflow rose, while spot ETFs simultaneously posted outflows. This is not supply absorption, but an increase in selling pressure.
TL;DR
This brief is about how exchange inflows and ETF outflows simultaneously worsened the local supply-demand balance. The main logic is simple: sellers gained the advantage until demand returns. Combined, this creates roughly 34K BTC of local pressure: +18K BTC in net exchange inflows and around -16K BTC in ETF outflows.
Bitcoin Weekly Exchange Netflow
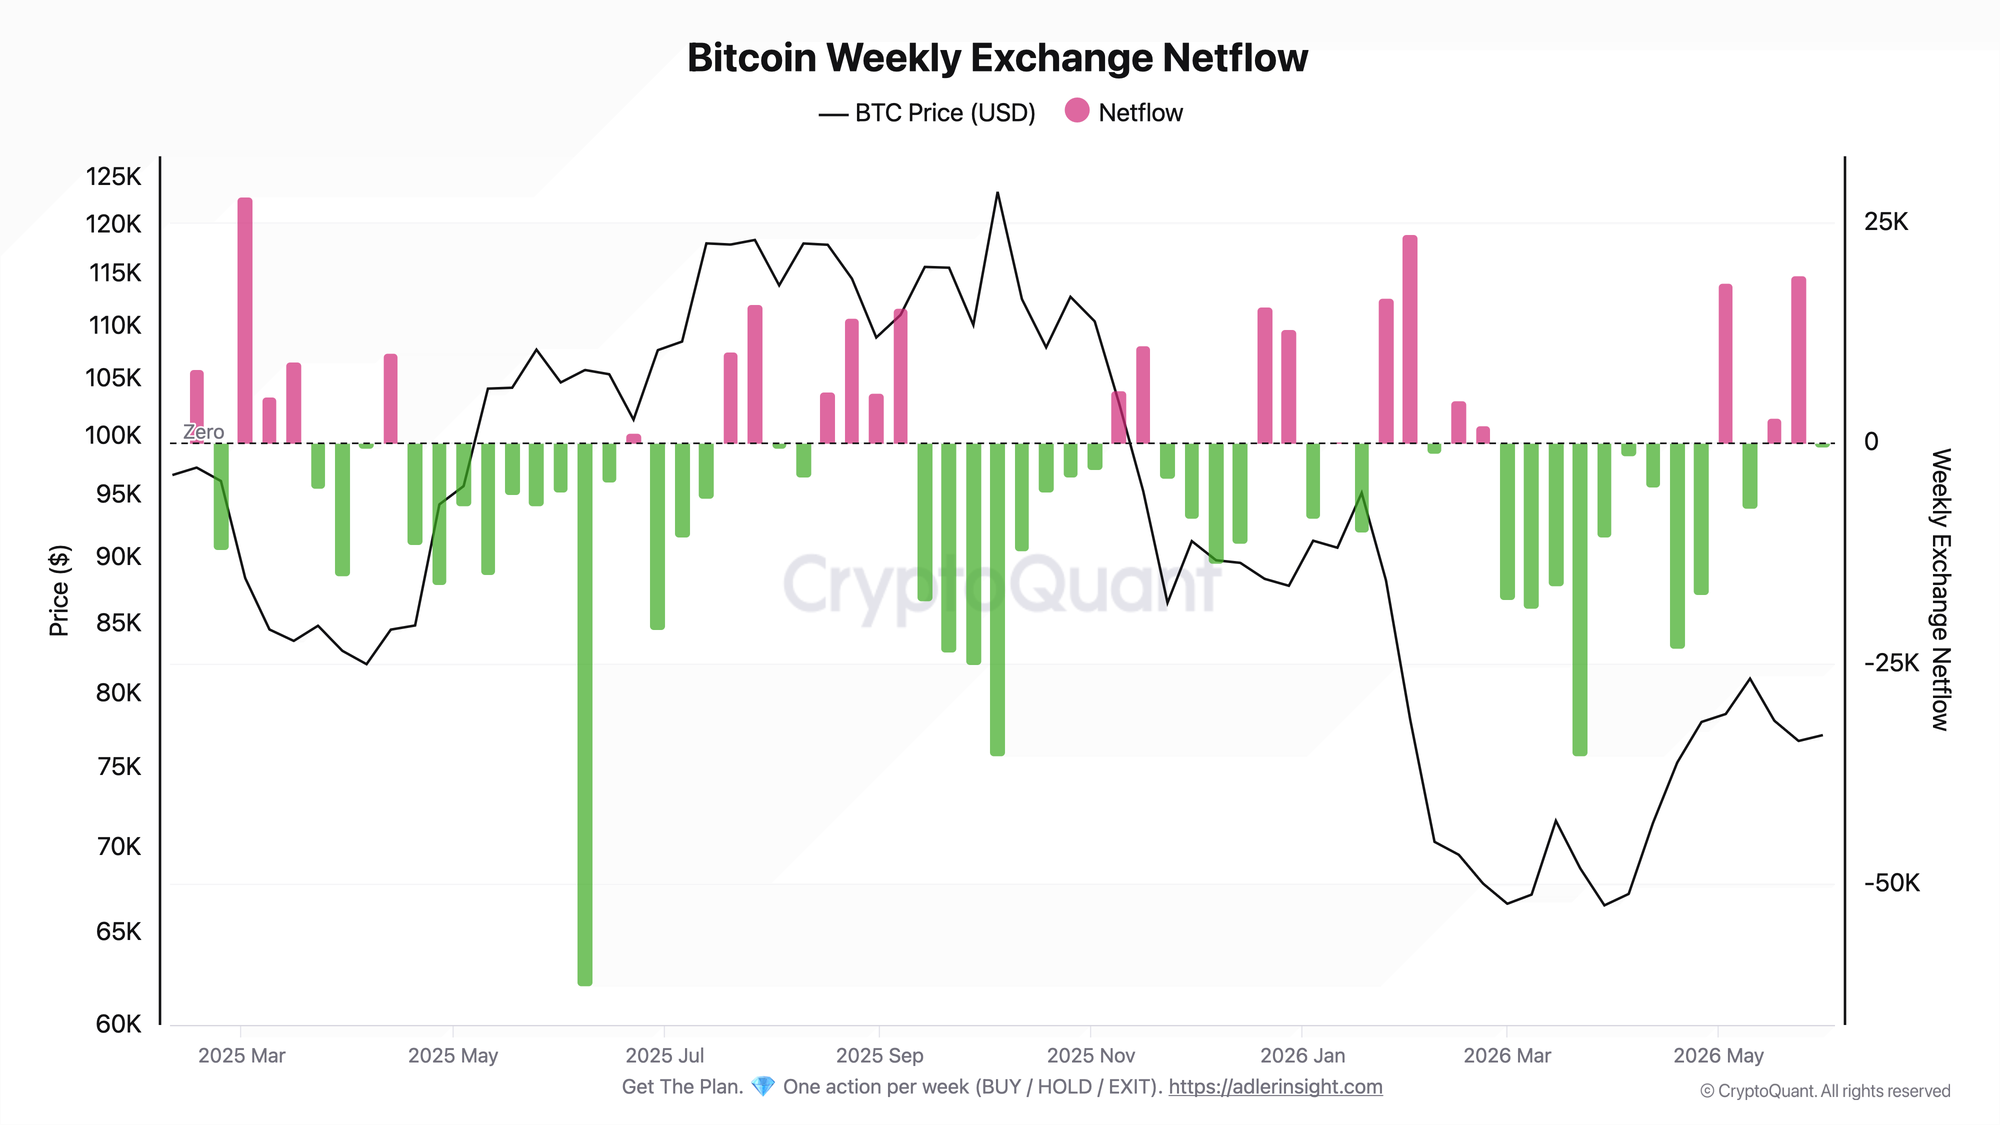
Last week, the metric rose to +18K BTC. This means more coins moved onto exchanges than were withdrawn from them. This signal shows growth in potential supply available for sale.
Conclusion: seller pressure strengthened locally. To reduce the risk, weekly netflow needs to reverse back toward the neutral zone or into negative territory; otherwise, every BTC rebound remains vulnerable to renewed selling.
Daily US Spot BTC ETF Flow
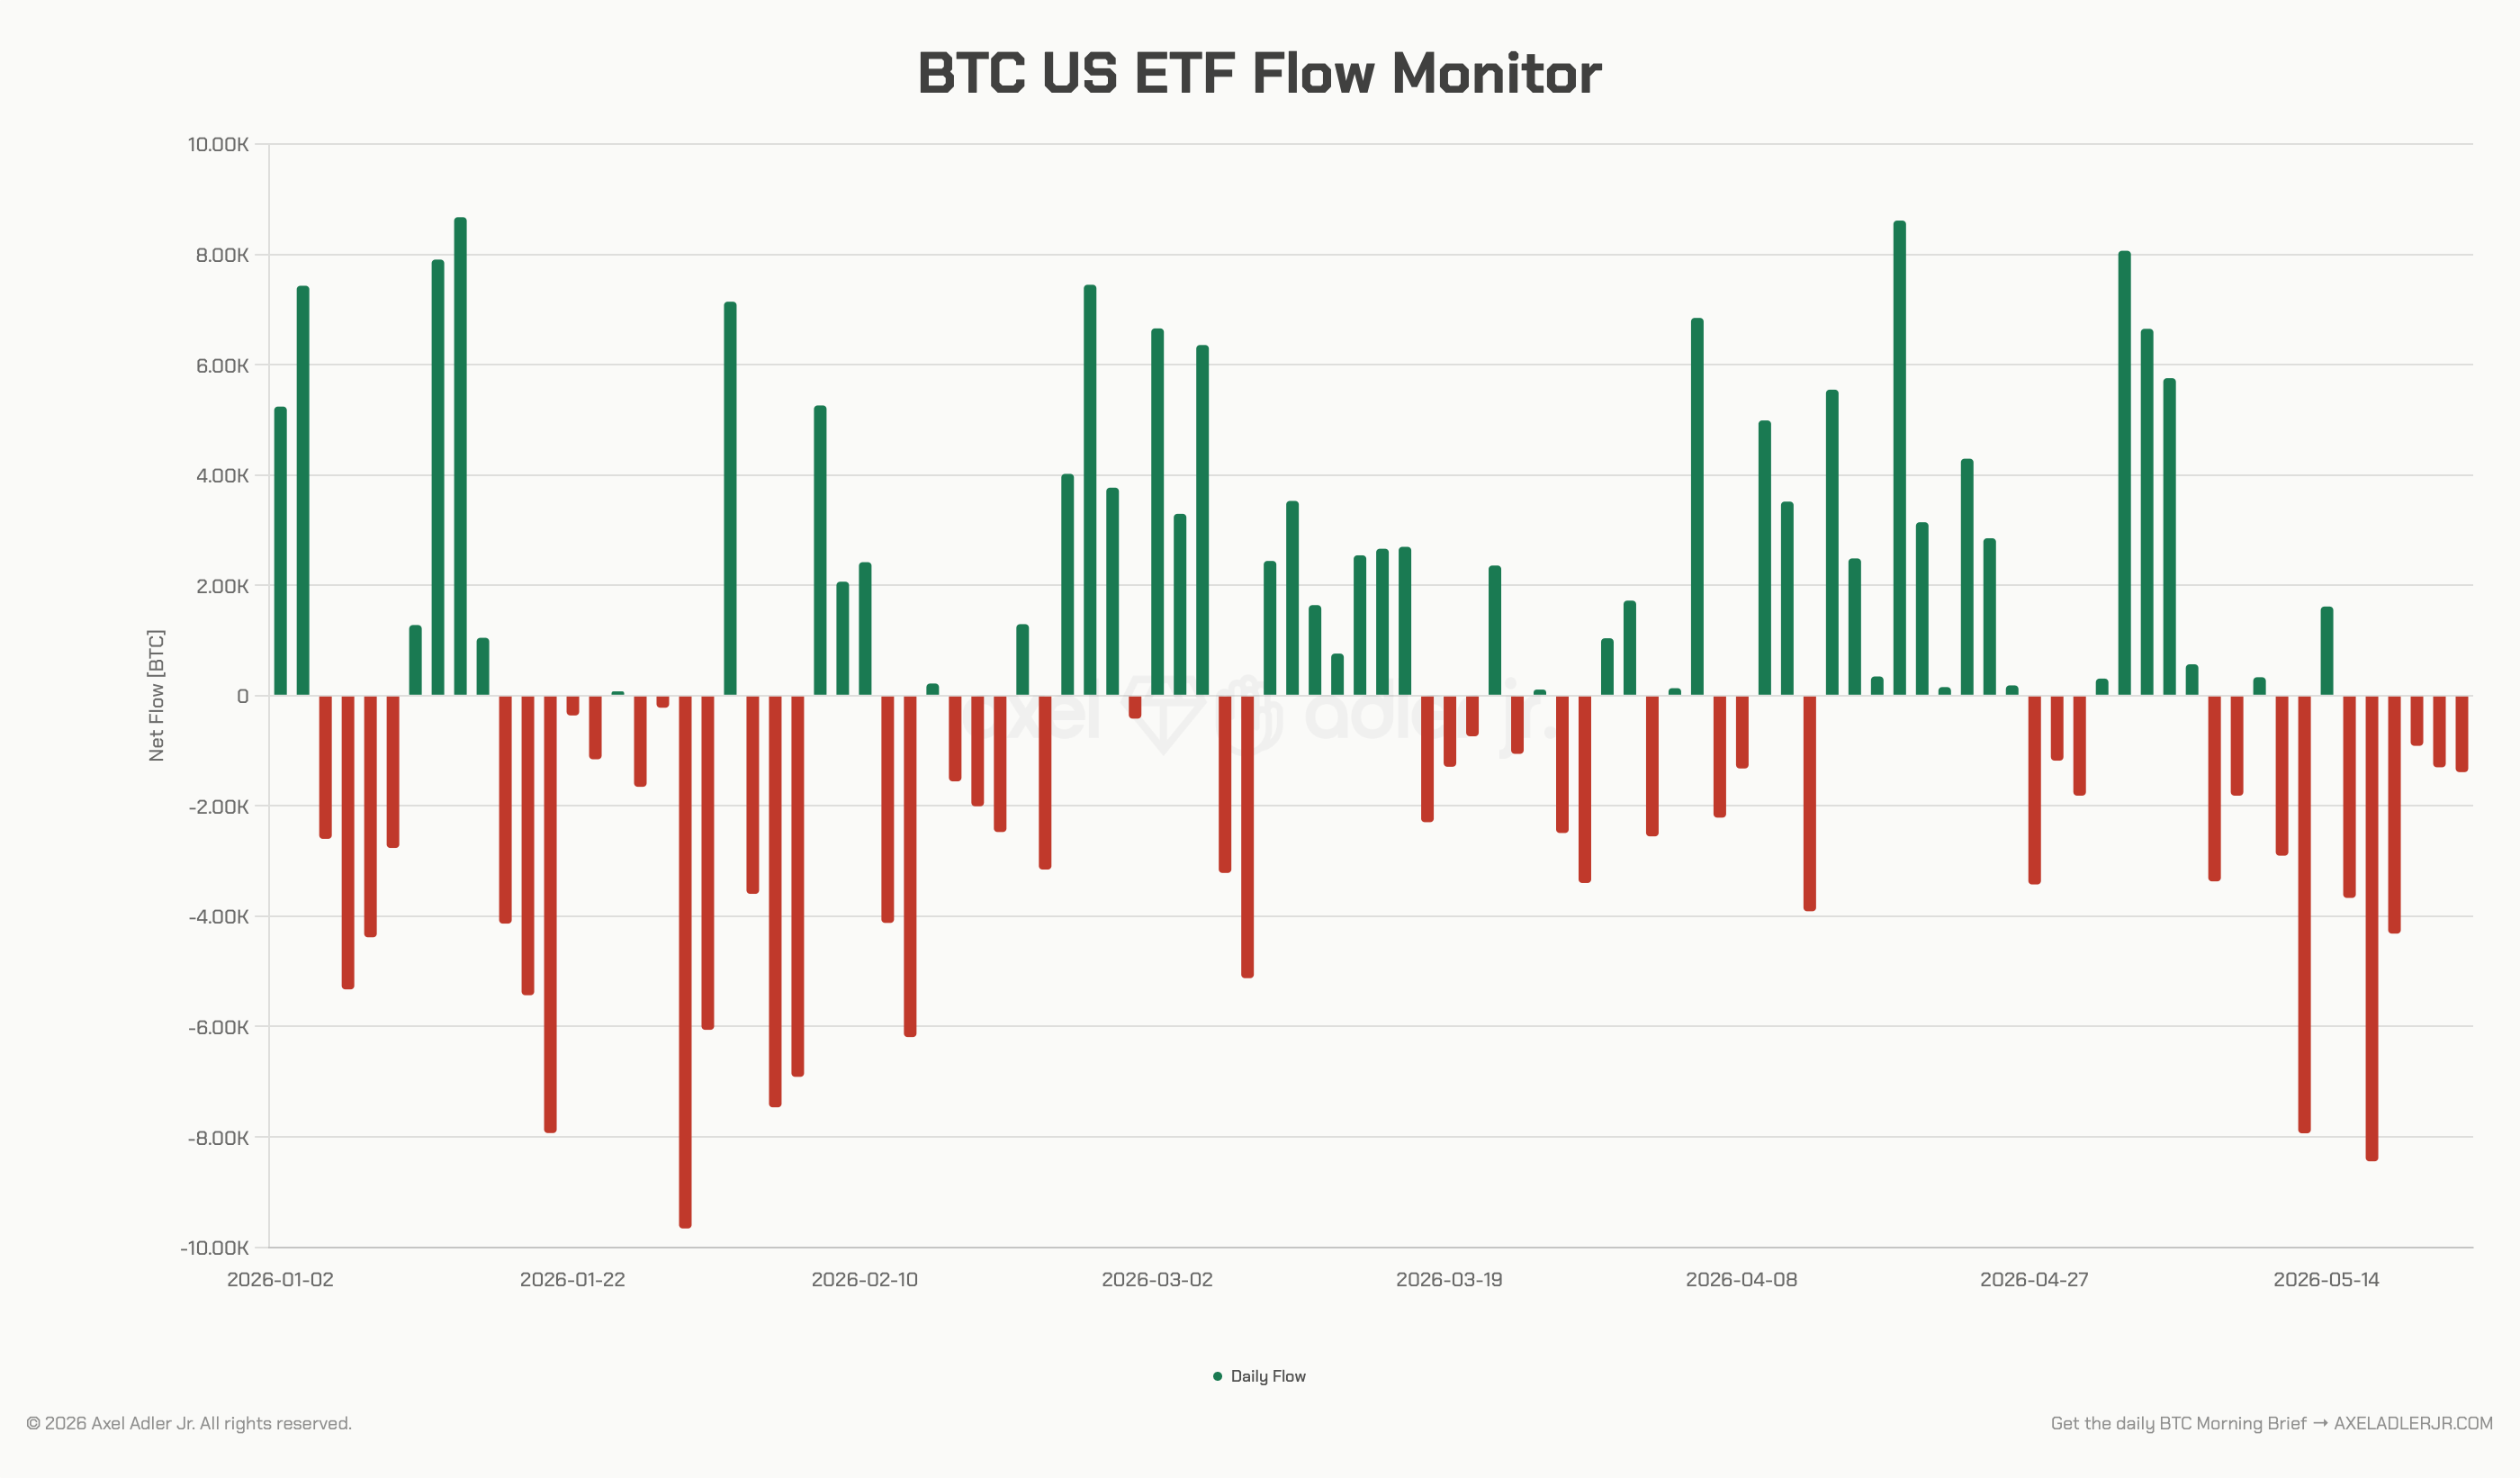
Over the past week, ETF flow was around -16K BTC. This means ETFs did not act as a source of supply absorption. On the contrary, ETF outflows added a second layer of pressure to the already positive exchange netflow.
The connection between the two charts shows the main point: +18K BTC moved onto exchanges, while ETFs simultaneously saw around -16K BTC leave. In total, this creates roughly 34K BTC of local pressure, where the institutional channel is not offsetting sellers, but strengthening the risk-off regime.
Stop monitoring dozens of BTC charts - get one clear market verdict. ADLER Terminal compresses on-chain, derivatives and macro data into a simple YES / CAUTION / NO, updated 4 times a day. Unlock access.
FAQ
Why is positive exchange netflow considered a risk? Because BTC inflows to exchanges increase the available supply for sale. This does not mean all coins will be sold immediately, but it increases the probability of price pressure when demand is weak.
What needs to change for the picture to improve? ETF flow needs to reverse back into sustained inflows, and weekly exchange netflow needs to decline. As long as ETFs remain in outflow and exchanges keep receiving net BTC inflows, the local balance remains against buyers.
CONCLUSIONS
Morning Brief 176 captures a risk-off picture in flows: weekly exchange netflow rose to +18K BTC, while U.S. spot BTC ETF flow over the same week moved to roughly -16K BTC, which together creates around 34K BTC of local pressure. This is a bad combination because exchanges received additional supply, while ETFs did not provide demand to absorb it. The main improvement trigger: a return of ETF flows to sustained inflows and a decline in exchange netflow. The main risk: continued double pressure, where BTC moves onto exchanges while the institutional channel remains in outflow.
Live Charts
Exchange Netflow - Supply pressure
Live view of the core on-chain signal in this brief: net BTC moving to and from exchanges, showing whether exchange-side supply pressure is rising or fading.
BTC US ETF Flow Monitor - ETF demand
Daily US spot Bitcoin ETF flows, the second side of this week’s pressure setup, showing whether institutional demand is absorbing or adding to net supply.
Coinbase Premium Index - US spot demand
Coinbase versus global market premium as a proxy for US spot demand, helping confirm whether US buyers are stepping back in.
STH-SOPR - Short-term holder behavior
Short-term holder profit and loss behavior around the 1.0 breakeven threshold, useful for checking whether recent selling pressure is coming from weaker hands.
SOPR - Realized selling pressure
Spent Output Profit Ratio shows whether moved coins are being realized at profit or loss, helping separate simple exchange inflows from actual selling behavior.
Funding Rates - Leverage confirmation
Perpetual futures funding helps confirm whether the risk-off regime is also spreading into leveraged positioning.