
🎧 Morning Brief #201 - audio debate
Spot Bitcoin ETFs have shifted from being the engine of the cycle to becoming a source of pressure on the market. The first pair of charts shows how weekly flows turned sustainably negative and pulled the cumulative curve lower. The second shows that 30-day momentum has fallen to its lowest level in the product's entire history.
TL;DR
A brief on how demand from spot Bitcoin ETFs has completely dried up and turned into a sustained outflow. As long as momentum stays near historical lows, the market has no institutional fuel for an upside reversal.
Weekly Flow & Cumulative Flow
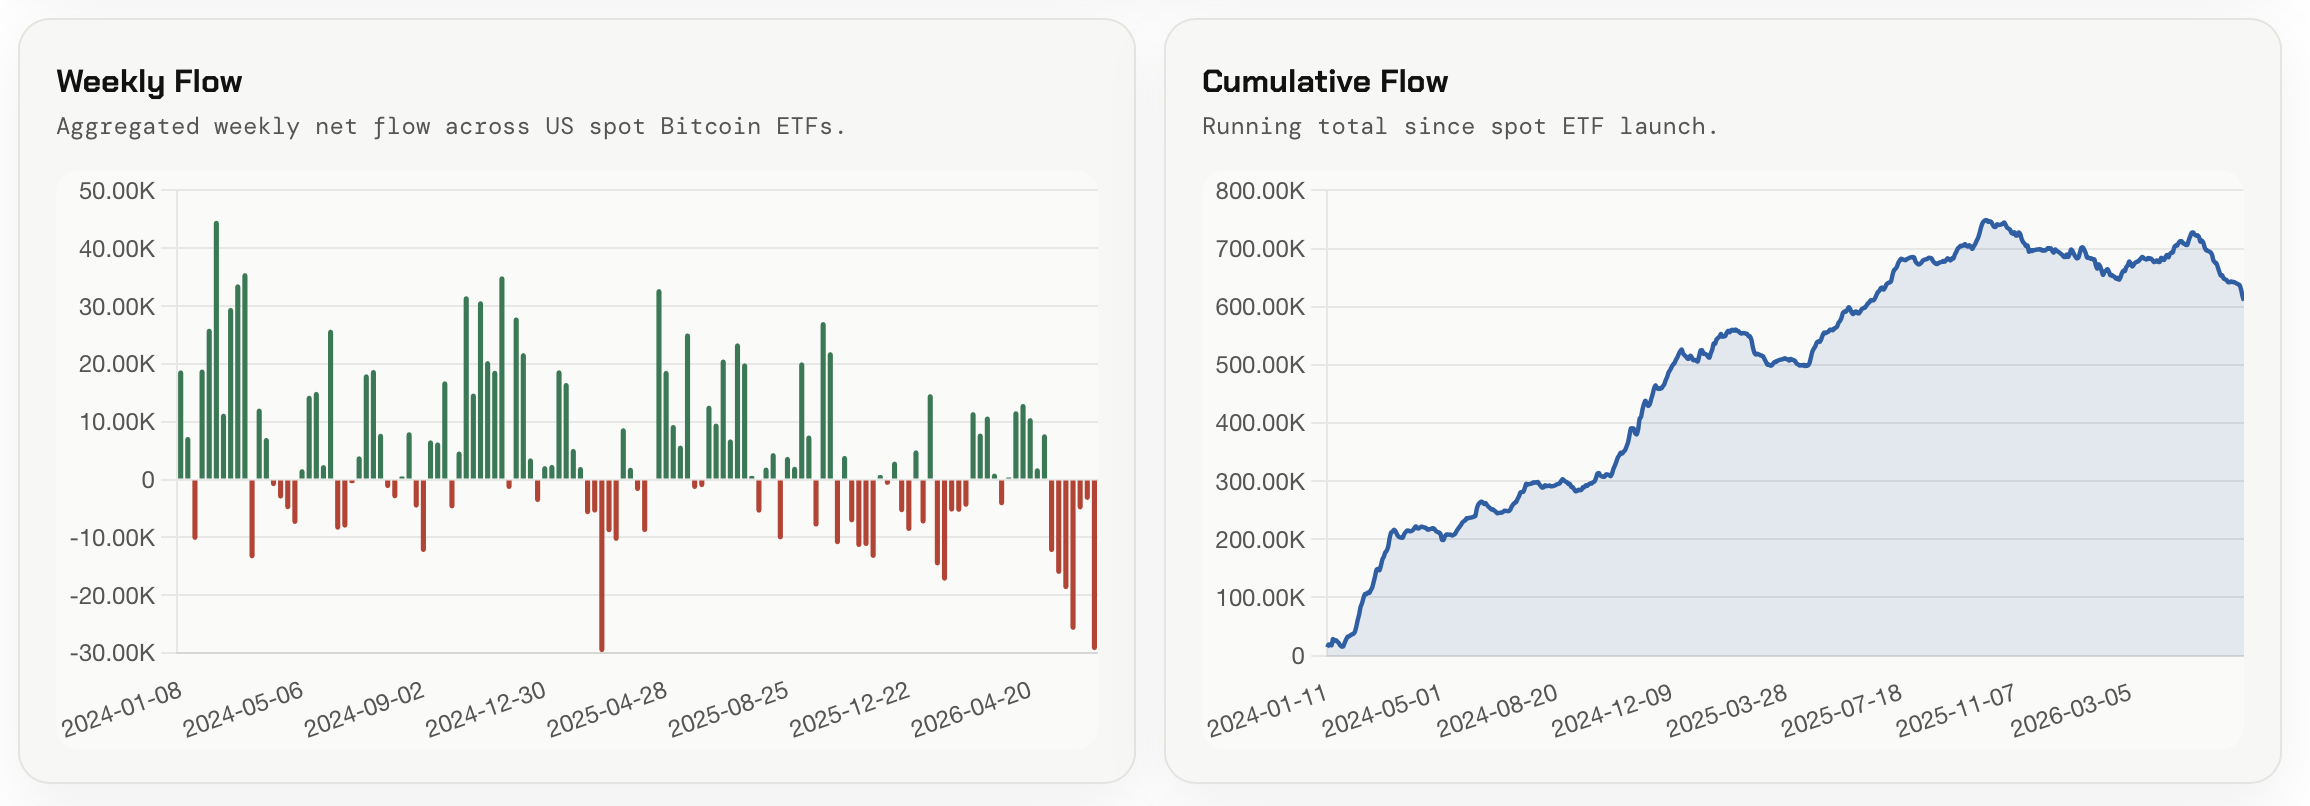
The left panel shows the aggregated weekly net flow across spot ETFs. The right shows the cumulative total since launch in BTC.
On the weekly panel, all of 2024 and most of 2025 were dominated by green bars, while the right edge of the chart is now almost entirely red. The latest bars are among the deepest in the series' history. The cumulative curve confirms this directly: after a long rise, it has shifted into a clear downtrend. The peak was recorded on October 13, 2025 at 745.89K BTC, and by June 26, 2026 the figure had fallen to 610.28K BTC. That means about 135K BTC left the funds, or roughly 18% of the accumulated position, in just over eight months.
The trigger for improvement would be a return of weekly bars to the green zone and stabilization in Cumulative Flow with the formation of a horizontal base.
Momentum & 4-Week Aggregate Flow
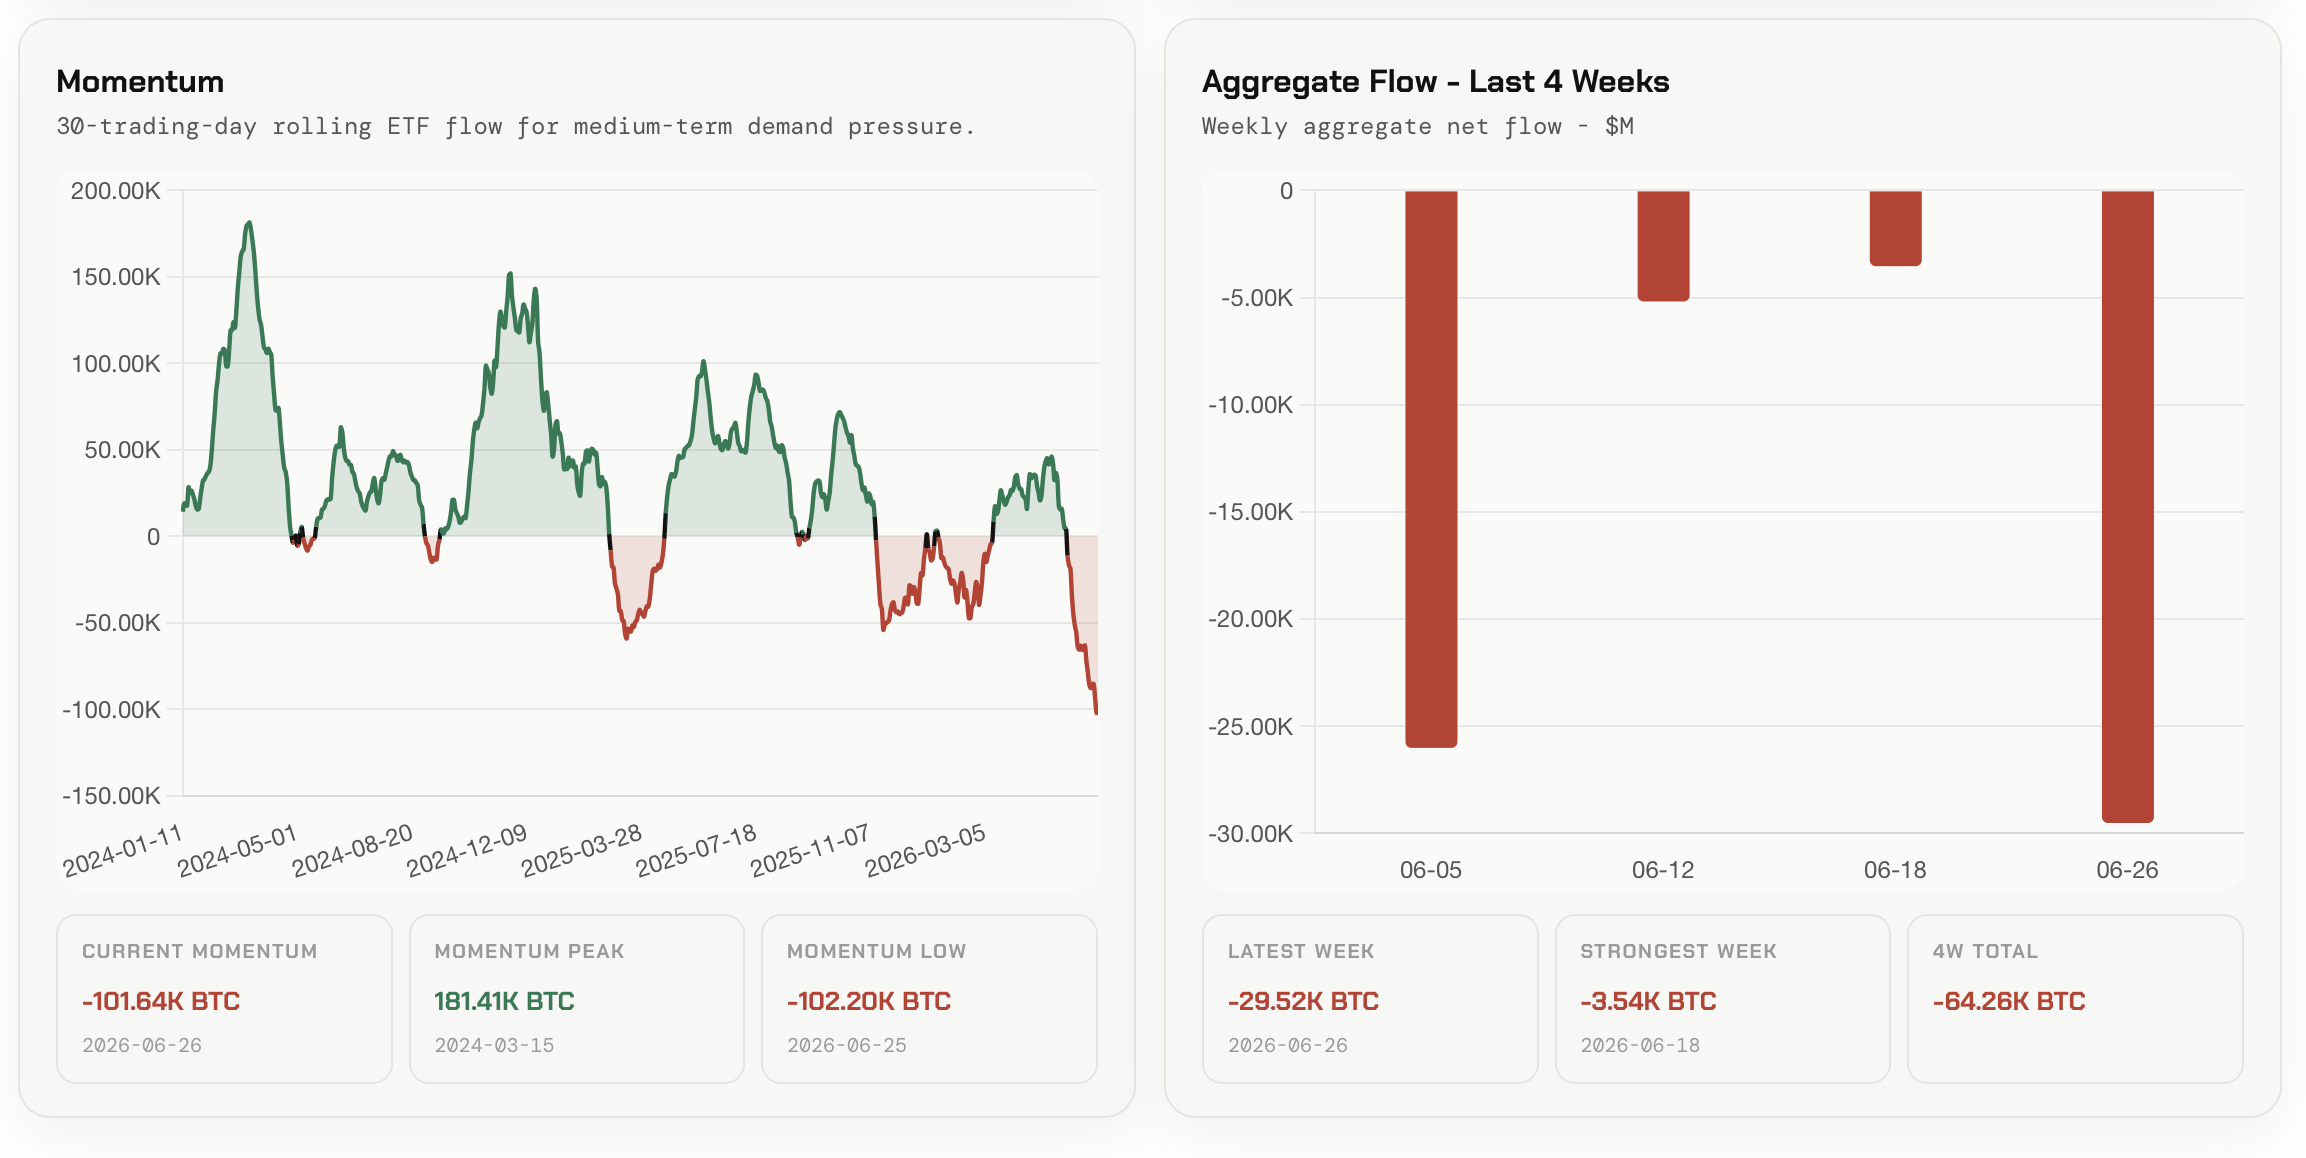
The left panel shows the 30-day moving flow as an indicator of medium-term demand pressure. The right shows weekly net flow over the past month.
Momentum on the left panel has broken below the entire previous range: the current reading stands at -101.64K BTC, with the historical low at -102.20K BTC recorded on June 25, 2026. For comparison, peak momentum reached +181.41K BTC in March 2024, at the start of the ETF era. The right panel shows why this happened: all four of the most recent weeks closed negative, for a total of -64.26K BTC. The latest week came in at -29.52K BTC, and even the strongest week of the month still remained negative at -3.54K BTC.
A regime reversal signal will appear only if momentum moves back above zero and at least one week posts a net inflow.
Stop holding through every crash - start your 7-day free trial. Weekly Engine tells you when to stay in, when to step aside and when risk is rising.
FAQ
What exactly has changed if ETFs had already shown individual weeks of outflows before?
Previously, outflows were just episodes inside a rising trend. Now weekly flow, monthly momentum, and Cumulative Flow itself have all moved into negative territory. That means the pressure has shifted from tactical to structural.
What level would signal a regime change?
The key threshold for momentum is zero. A move back above zero in the 30-day moving flow together with the first positive week would be the first objective signal of demand recovery.
CONCLUSIONS
The aggregate ETF position has pulled back by 135K BTC from the October peak, while 30-day momentum has settled near the historical low around -102K BTC. This creates a strong risk-off regime in terms of institutional demand. The main trigger for improvement is a move back above zero in momentum and the first week with a net inflow. The main risk is that if outflows continue at this pace, the market will lose its main source of structural bid and price pressure will intensify.
Live Charts
Explore the metrics behind this brief with live, auto-updating charts:
BTC US ETF Flow Monitor - US spot Bitcoin ETF daily flow, BTC-denominated accumulation, and fund leadership.
Exchange Netflow - Net BTC moving to and from exchanges across positive and negative flow regimes.
Coinbase Premium Index - Coinbase vs global market premium as a proxy for US spot demand pressure.
Liquidity Flows - All exchange-flow, ETF, and spot-demand charts in one view.