
🎧 Morning Brief #202 - audio debate
Price is falling toward the cost basis of long-term holders, but LTH themselves are not distributing: their holdings are setting new highs while spending remains subdued. The two charts show a rare divergence - MVRV compressing to a three-year low against a backdrop of record accumulation.
TL;DR
A brief on BTC approaching the LTH cost basis and why long-term holder behavior points to the market nearing the final phase of the bear cycle.
Bitcoin Long-Term Holder MVRV
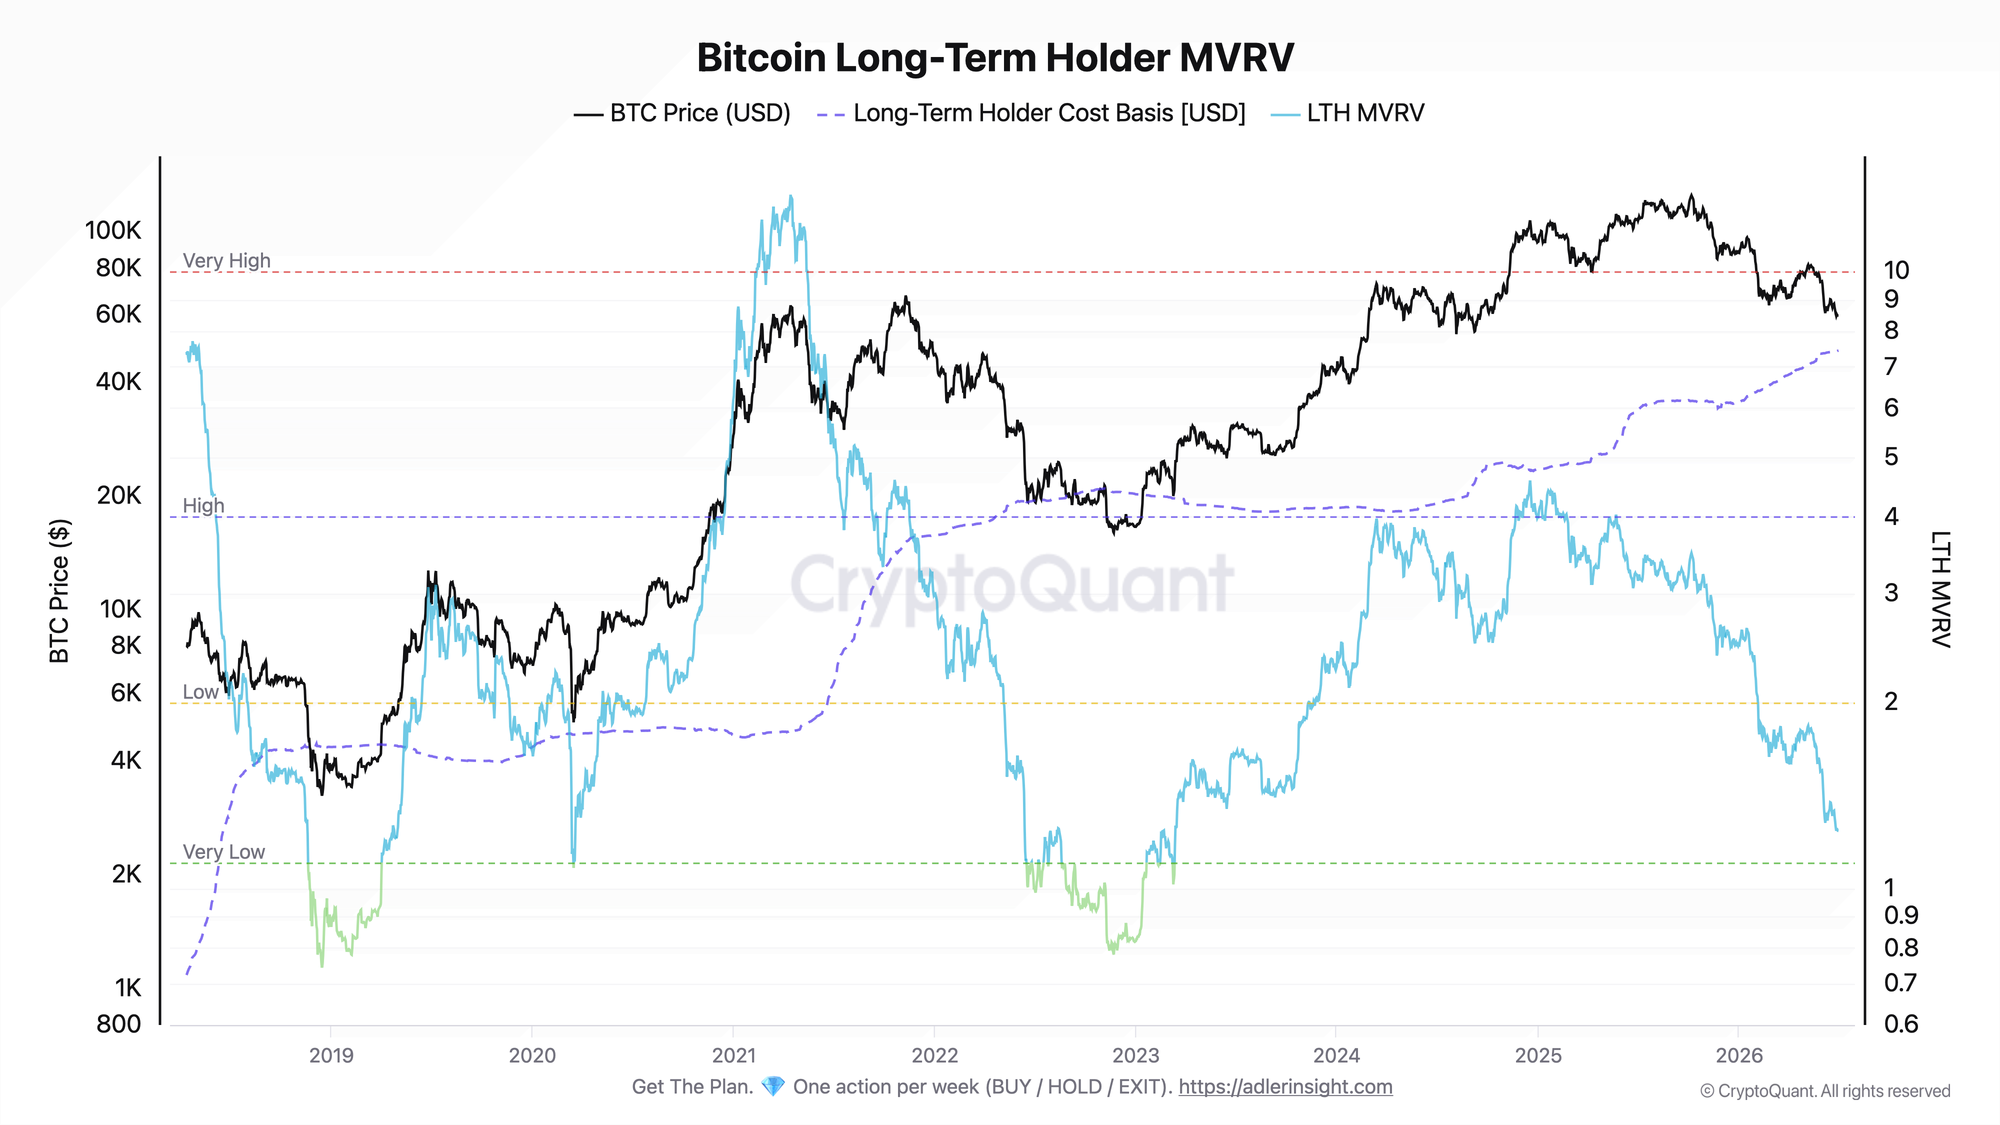
This metric reflects the ratio of the market value of LTH coins to their average purchase price, or cost basis.
LTH MVRV has compressed to 1.24 - the lowest level in the past three years - moving down from the Low zone toward the Very Low zone. The cost basis of long-term holders has risen to 48.4K and continues to climb, while BTC price has pulled back to 59K. As a result, the average long-term holder is now up just 24%, while the gap to cost basis has narrowed to 19%. The MVRV line has not yet entered the green capitulation zone, but it is clearly moving in that direction.
When MVRV approaches 1.0, the market has historically been near cyclical lows. The bottom confirmation trigger is the line entering the Very Low zone. The deterioration trigger is price breaking below the LTH cost basis, which would push the average pool of long-term coins into loss.
Bitcoin Long-Term Holder Spending Binary Indicator
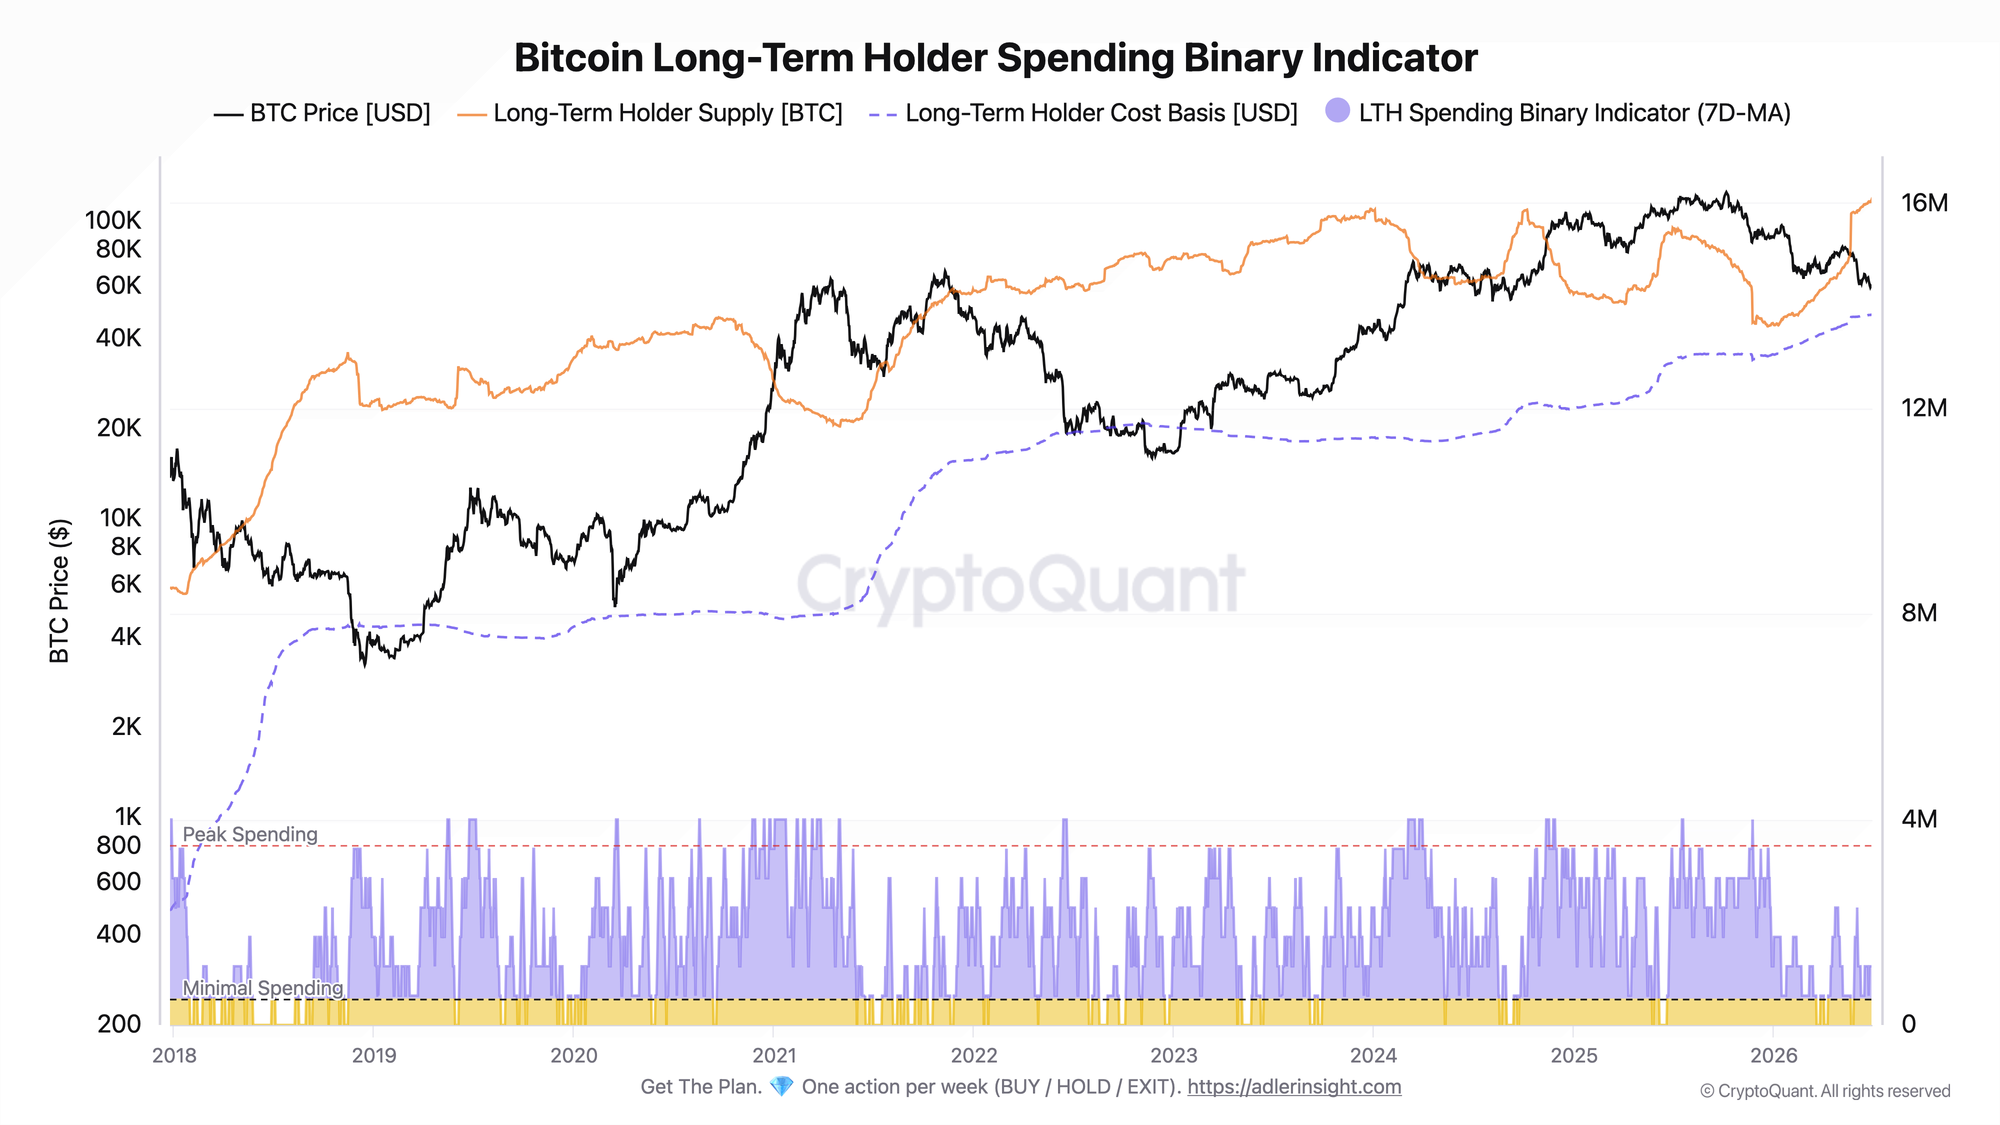
The indicator tracks days when LTH supply declines, meaning coins are being spent, as a 7-day average. The orange line shows the aggregate holdings of long-term holders.
LTH supply has reached a new all-time high and remains near 16.1M BTC, continuing to rise from levels below 14.4M just a quarter ago. At the same time, the Spending Binary Indicator remains in the lower part of the range, closer to the Minimal Spending zone: spending spikes are brief and do not turn into sustained distribution. In other words, as price falls, long-term holders are not taking profits or unloading, but continue to absorb supply.
This kind of behavior is typical of a late-stage correction. The signal would deteriorate if the indicator begins to hold persistently in the Peak Spending zone while the orange line also turns lower - that would point to the start of distribution.
The spending chart adds context to the MVRV picture: the compression in the ratio is being driven by falling price, not by coins leaving the hands of long-term holders. The key signal today is the divergence between weakening price and a strengthening LTH cohort.
Outperform Buy & Hold with a rules-based strategy - Start free. One weekly action, clear triggers, and invalidation levels. No guessing.
FAQ
Why does MVRV compressing to a three-year low not mean an immediate bottom? LTH MVRV at 1.24 points to proximity to the historical bottoming zone, but the final cycle low has typically formed only once the ratio entered the Very Low zone, closer to 1.0. For now, there is still some cushion above cost basis.
What will mark the boundary for a regime shift? The key threshold is the LTH cost basis around 48.4K. Holding above that level while spending remains minimal supports the bear market culmination scenario. A sustained break below it, together with rising coin spending, would signal capitulation from the most resilient cohort.
CONCLUSIONS
The combined picture from the two charts points to a late bear market regime: LTH MVRV has compressed to a three-year low and is approaching the capitulation zone, but record and still rising LTH supply together with subdued spending suggests that long-term holders are absorbing rather than distributing. The main reversal trigger is MVRV entering the Very Low zone while price holds above the 48.4K cost basis. The main risk is a break below that cost basis alongside a simultaneous spike in coin spending, which would push the average LTH pool into loss and open the door to true capitulation.
Live Charts
Explore the metrics behind this brief with live, auto-updating charts:
MVRV Ratio - Market value vs realized value to identify valuation regimes and cycle risk.
Realized Price - Aggregate on-chain cost basis compared with BTC price and long-term trend.
LTH vs STH Supply - Supply split between long- and short-term holders to track accumulation and distribution.
LTH-SOPR - Long-term holder profit/loss realization around the 1.0 breakeven threshold.
Supply in Loss - Share of supply held at a loss to flag stress and capitulation zones.