
🎧 Morning Brief #200 - audio debate
Quarterly realized P/L has remained negative for a fifth straight month, repeating the pattern seen in the early phases of past bear cycles. At the same time, realized price by holder group shows where the market's key support now sits and how far the current drawdown still is from the 2022 capitulation.
TL;DR
Net realized P/L is persistently negative, which means the market is systematically locking in losses. But the cost basis of most holder cohorts is still below the current price, so for now this looks like a controlled decline rather than a full capitulation.
Bitcoin Net Realized Profit/Loss (90D MA)
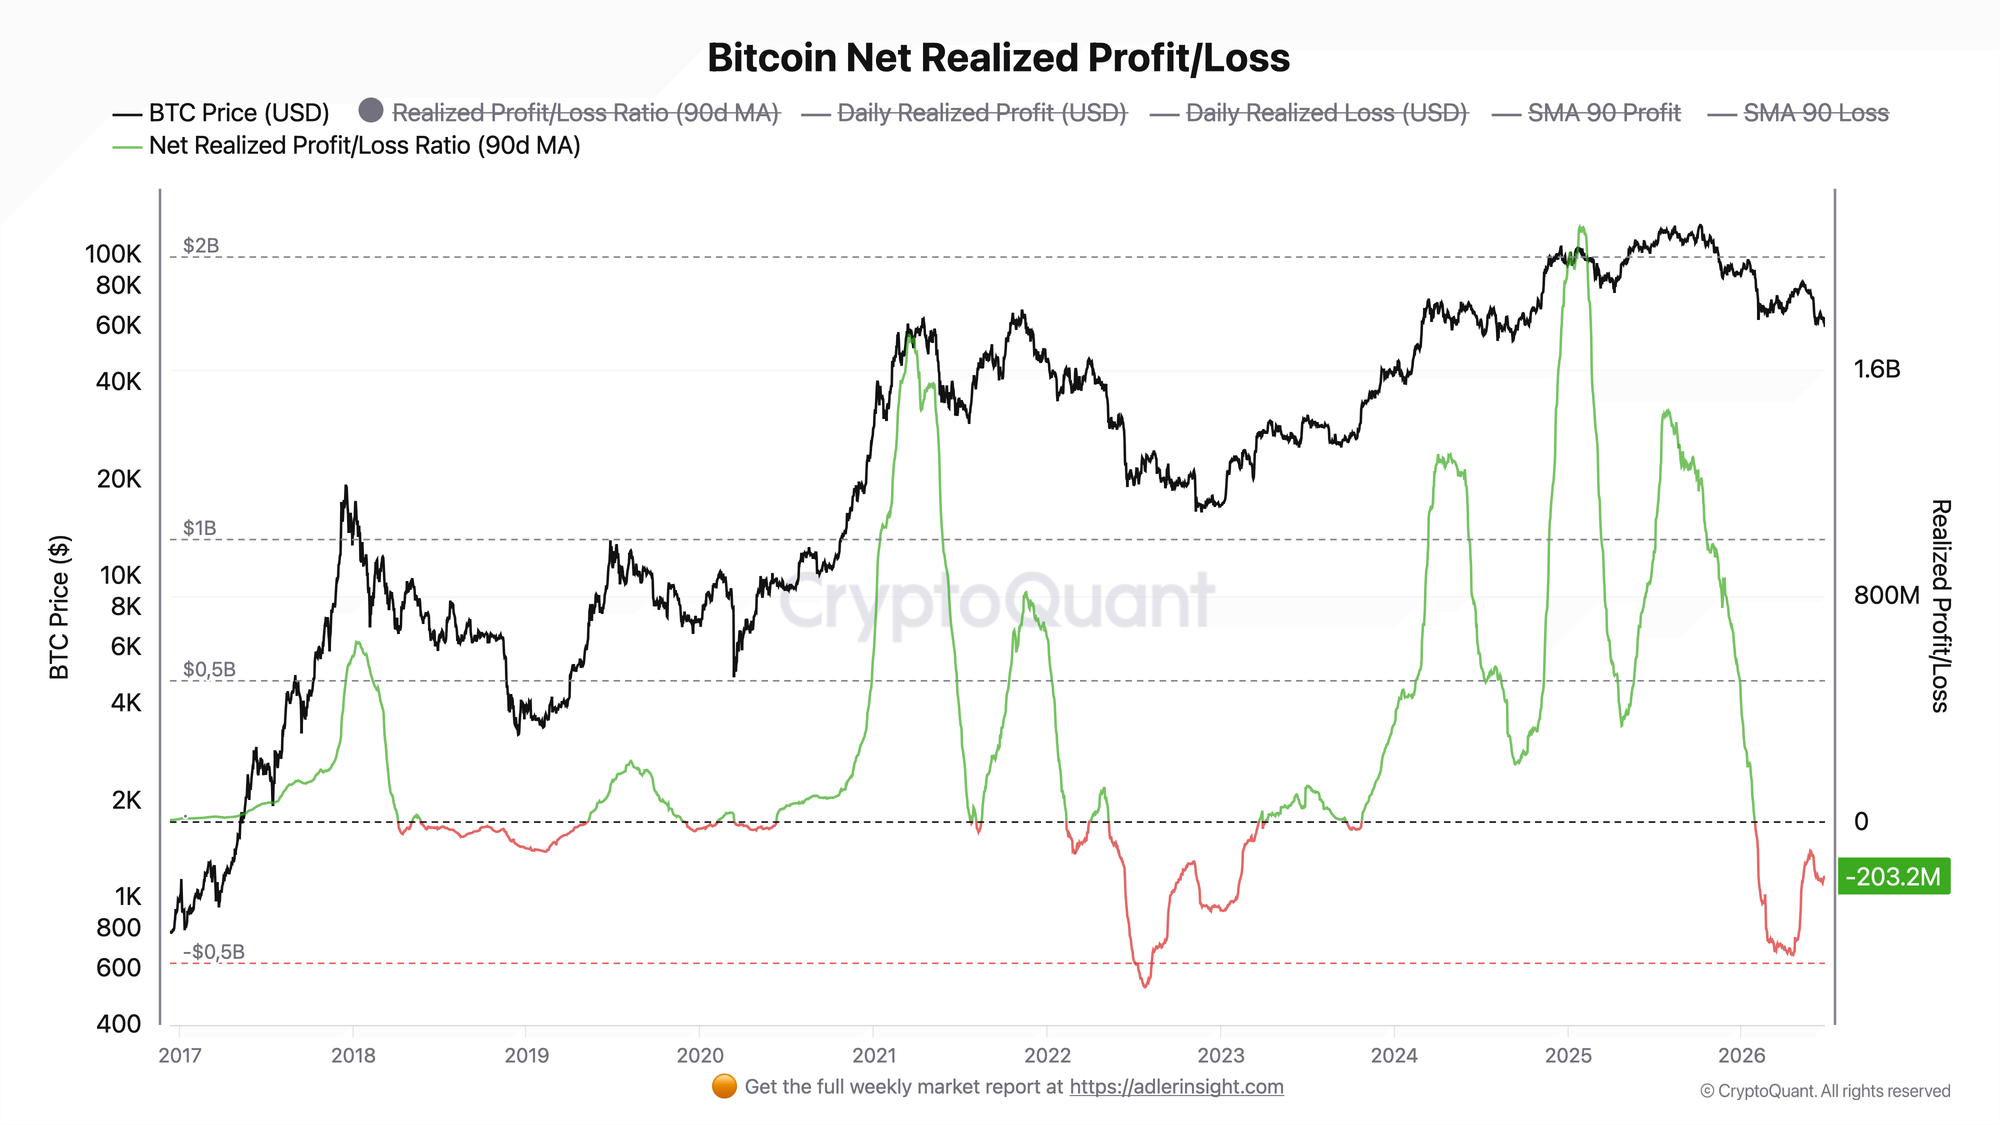
The metric reflects the difference between realized profit and realized loss, smoothed by a 90-day moving average.
The indicator moved into negative territory in late January 2026 near $84K and has not returned to positive since. In the spring, the metric fell to nearly -0.47B - the low of the current cycle. It then partially recovered to around -120M by late May, but the June price decline from around $73K to $60K pushed it lower again. The current reading is -203.2M.
This five-month negative regime means the market is systematically realizing losses - just as it did in past bear cycles. In terms of depth, the current drawdown has already exceeded the local lows of 2023, but it is still clearly milder than the 2022 capitulation, when the metric dropped to around -0.6B. The improvement trigger is a return to zero. The deterioration trigger is a fresh break below the spring low.
Bitcoin Realized Price by Balance
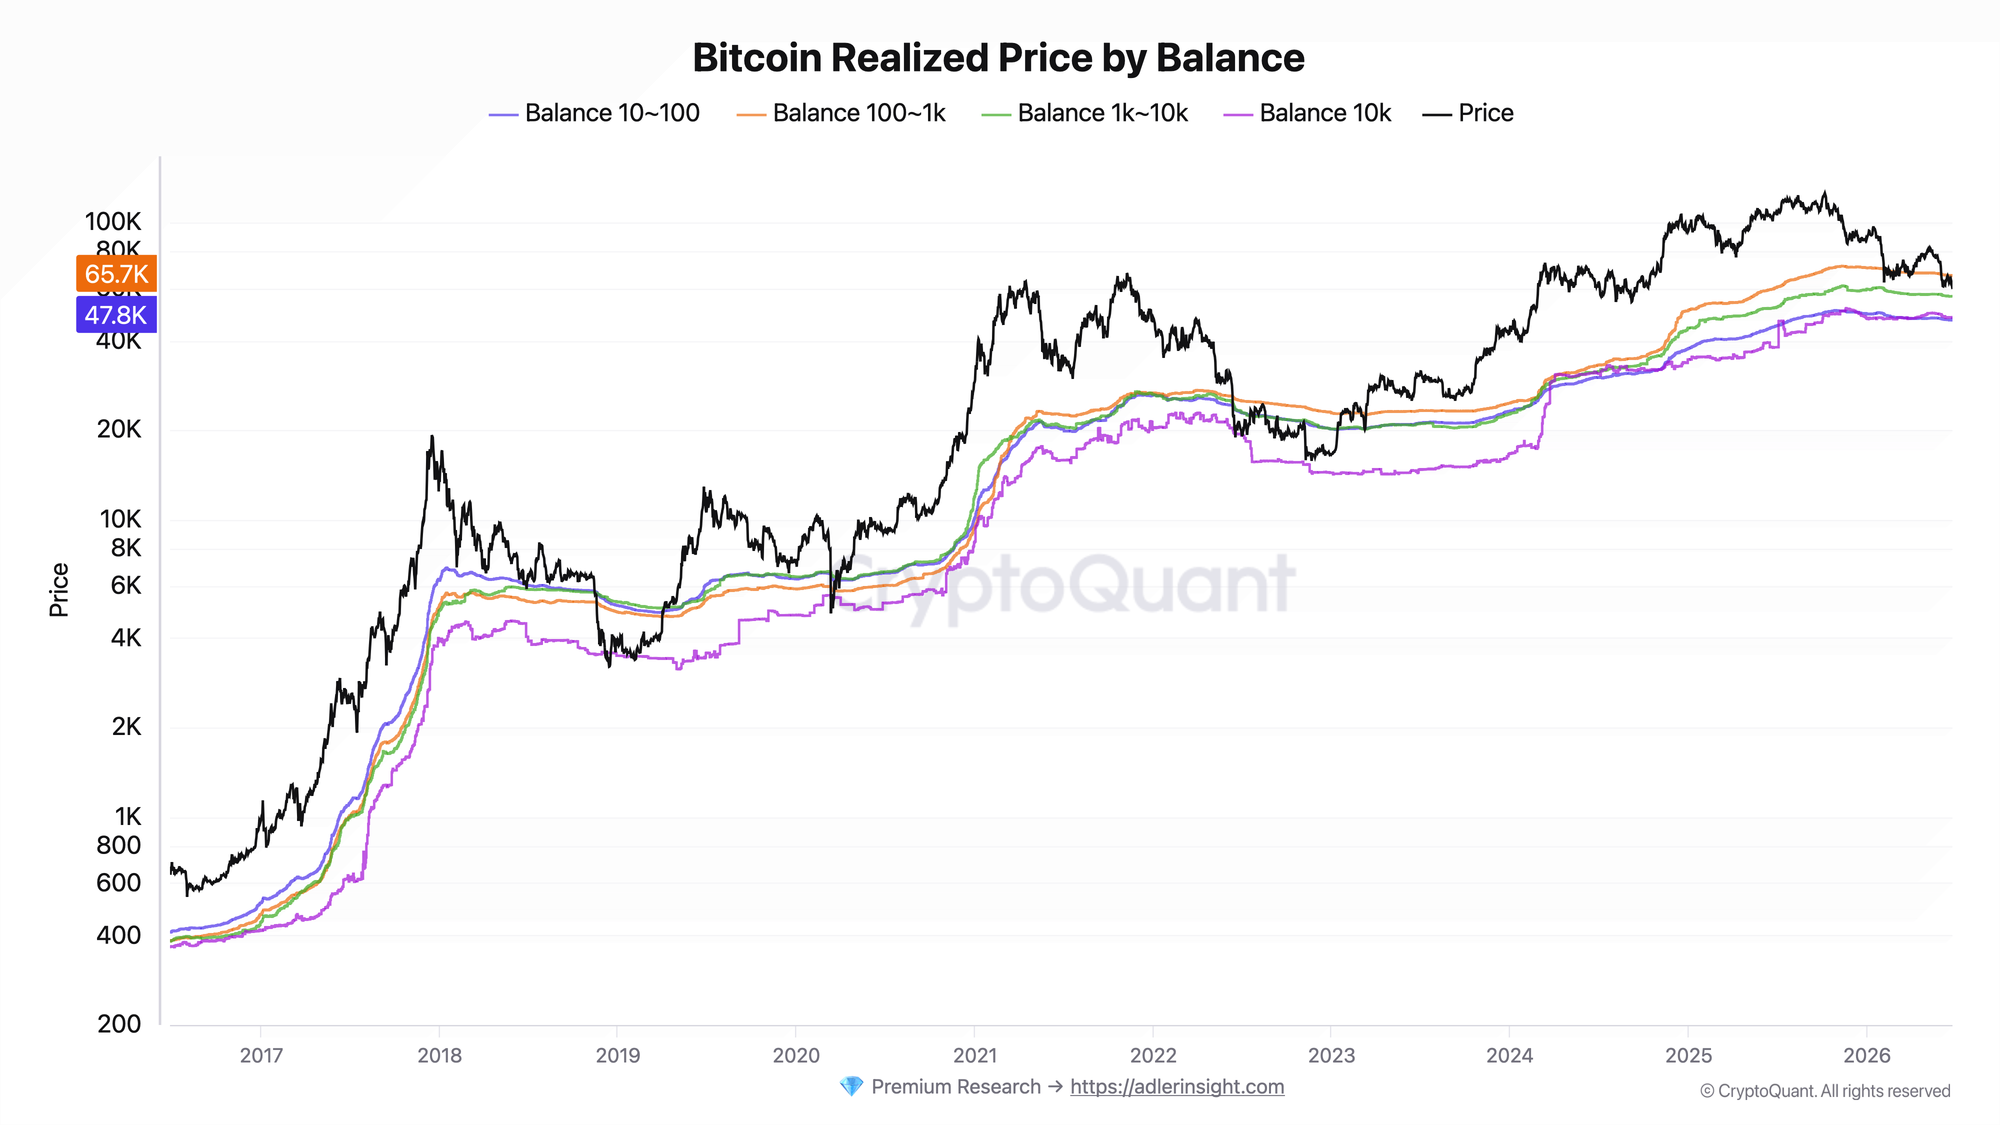
The lines reflect the average accumulation price for the 10-100, 100-1k, 1k-10k, and 10k+ BTC cohorts.
At a price of around $59.7K, most groups are still holding above their cost basis: whales with 10k+ are at $48.1K, smaller addresses with 10-100 are at $47.8K, and large wallets with 1k-10k are at $56.5K. The only cohort still underwater is the 100-1k group, with a realized price of $65.7K - the current price is about 9% below that level. As a result, the cost basis cluster forms a support zone in the ~$48K-$56K range.
As long as price holds above that support, the bulk of strong hands remains in profit, which means the risk of cascading loss realization stays limited. At the same time, the $65.7K cost basis of the 100-1k cohort has turned into the nearest overhead resistance and explains where the main flow of loss-taking is coming from.
This chart adds context to the first one: negative realized P/L is currently being driven mainly by recent buyers in the 100-1k cohort, while the core holder base has not yet moved into a loss position. Unlike 2022, when price dropped below the cost basis of nearly every group, the current drawdown is still holding above key support. The main level to watch is the $48K-$56K range.
Stop holding through every crash - start your 7-day free trial. Weekly Engine tells you when to stay in, when to step aside, and when risk is rising.
FAQ
Why is realized P/L negative if whales and smaller addresses are still in profit?
The metric captures only actually realized transactions, and the main volume of loss-taking right now is coming from recent buyers in the 100-1k cohort, whose $65.7K cost basis remains above the market. Strong hands are still in profit, but they are barely selling, so their unrealized gains do not offset the losses being locked in by active sellers.
What would signal a regime change?
A return of Net Realized P/L (90D MA) to zero and above would confirm that the wave of loss-taking is fading. A break below the $48K-$56K support zone, by contrast, would push the next holder cohorts into losses and move the market closer to a scenario resembling the 2022 capitulation.
CONCLUSIONS
Quarterly realized P/L has now remained negative for a fifth straight month at -203.2M, confirming a regime of systematic loss realization. But realized price by group shows that the core holder base - whales, smaller addresses, and large wallets - still remains above its cost basis, while only the 100-1k cohort is underwater. That is exactly what sets the current drawdown apart from the full capitulation of 2022, when nearly all groups fell below cost basis. The market's base status is risk-off with signs of a controlled decline, not capitulation. The main improvement trigger is a return of Net RPL to zero. The main risk is a break below the $48K-$56K support zone, which would push the next cohorts into losses and open the way to a deeper phase of decline.
Live Charts
Explore the metrics behind this brief with live, auto-updating charts:
SOPR - Spent Output Profit Ratio shows whether moved coins realize profit or loss.
Realized Price - Aggregate on-chain cost basis compared with BTC price and long-term trend.
Supply in Loss - Share of supply held at a loss to flag stress and capitulation zones.
STH-SOPR - Short-term holder profit/loss behavior around the 1.0 breakeven threshold.
Realized Price Bands - Dynamic realized-price valuation zones from live BTC price and on-chain cost basis.