
🎧 Morning Brief #199 - audio debate
Strategy (MSTR) - the largest corporate holder of Bitcoin and its main leveraged proxy - has fallen into one of the deepest drawdowns in its history, while the average cost basis of its treasury has moved above the spot price of BTC. These three charts show how much deeper the stock is falling relative to the underlying asset and why the regime shift at the largest corporate buyer matters for Bitcoin itself.
TL;DR
This brief is about how MSTR's deep drawdown and Strategy's shift from aggressive buying to defense are changing the role of the largest corporate BTC buyer. The logic is simple: the longer this proxy stock trades deeply underwater, the higher the risk that the burden of dividends and debt will eventually reach Bitcoin itself.
Bitcoin and Strategy (MSTR)
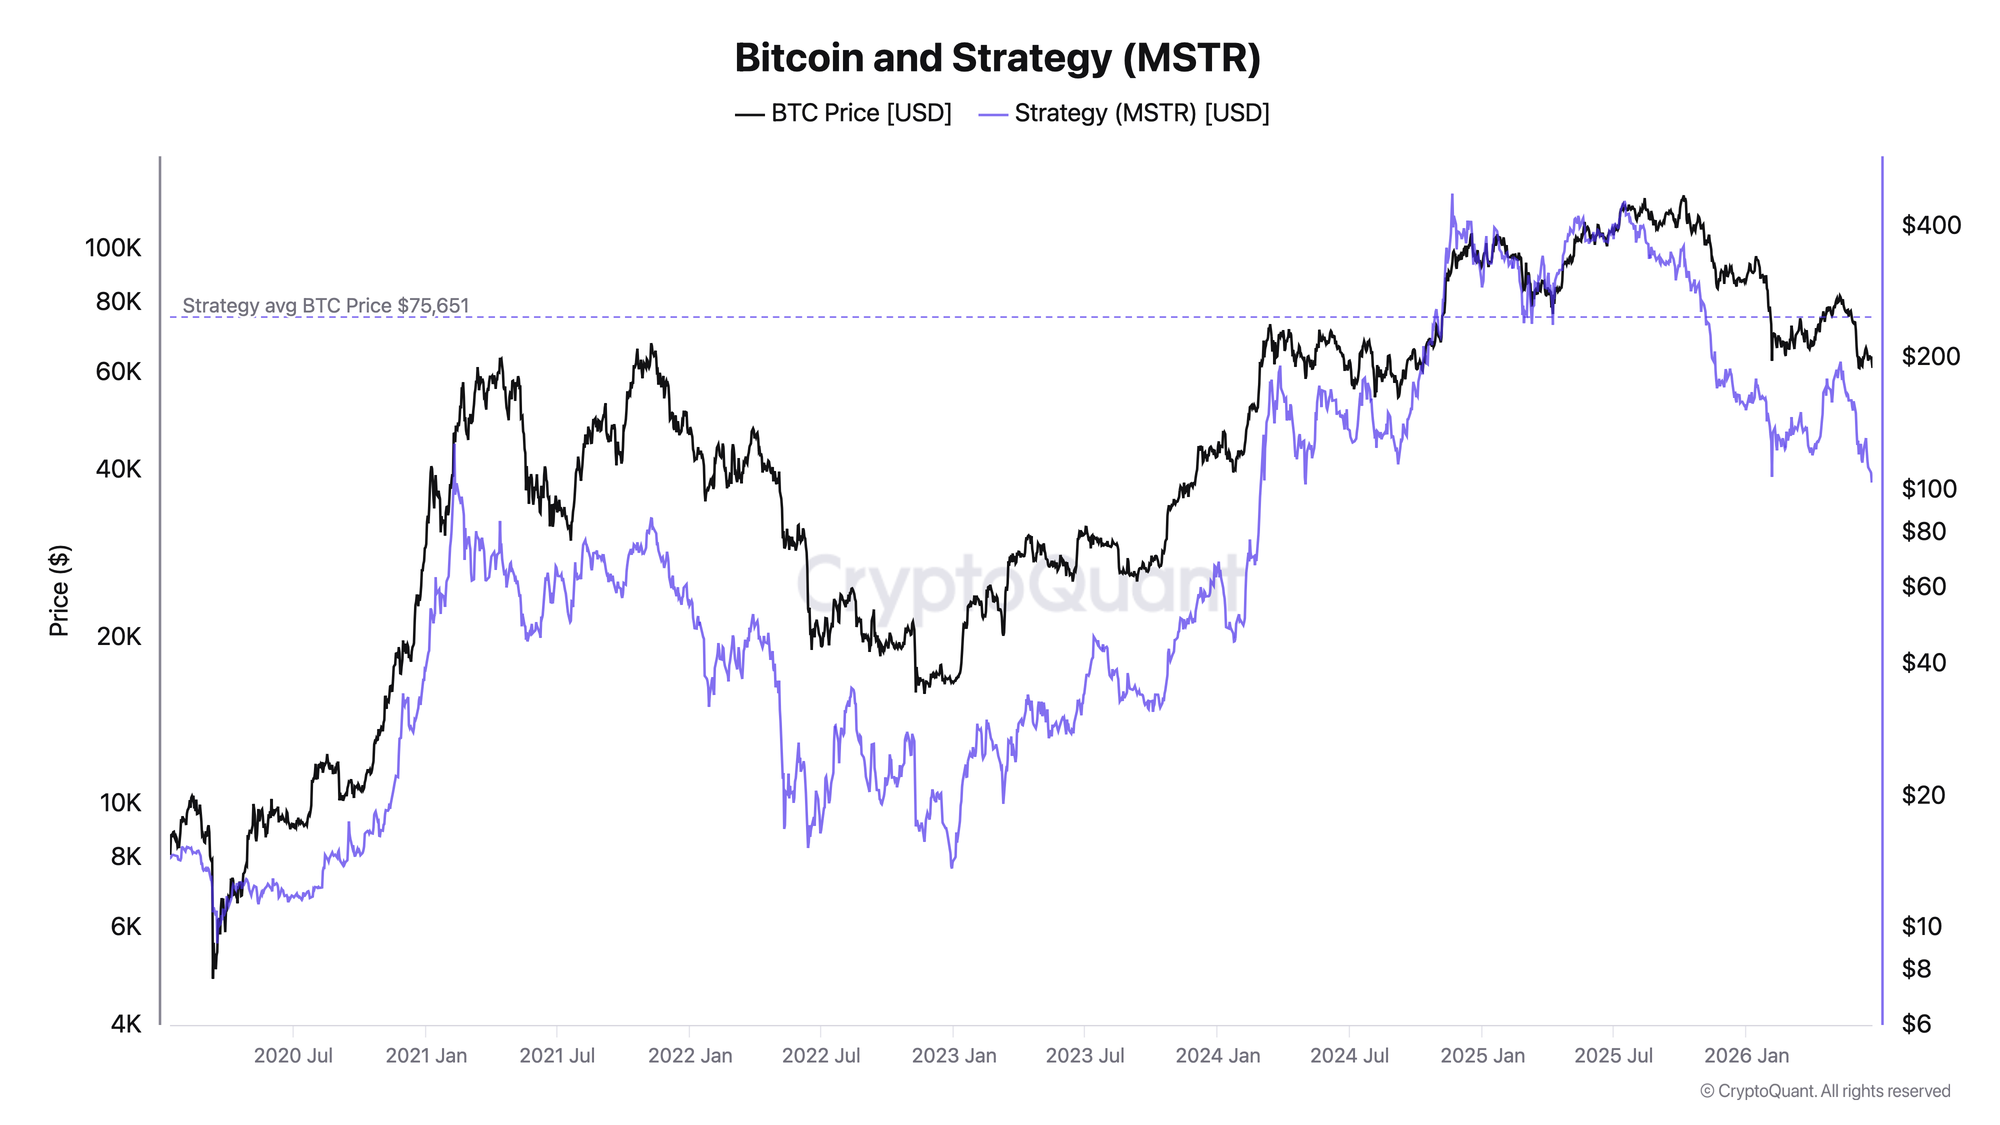
BTC price and MSTR share price.
The chart shows that since launching its Bitcoin treasury in 2020, MSTR has behaved like BTC with amplified beta: in bull phases the stock rises above the underlying asset, and in bear phases it falls deeper and faster. After the peak of the 2024-2025 cycle, both curves turned lower, but the purple MSTR line pulled back much more sharply than BTC, and both now trade well below their cycle highs. The key point is that the current BTC price has fallen below the average cost basis of Strategy's treasury: with 847,363 BTC at an average entry price of $75,651 and a total cost of $64.1 billion (strategy.com/btc, strategy.com/purchases), the position is underwater for the first time since the 2022 bear market.
An underwater treasury does not force selling on its own, but it does change how the company behaves. When the stock's premium to net Bitcoin assets collapses, the fuel for aggressive buying runs out. The key deterioration trigger is BTC holding below Strategy's cost-basis zone, because that increases pressure on its capital-raising model through ATM issuance.
Bitcoin and Strategy (MSTR) Drawdown
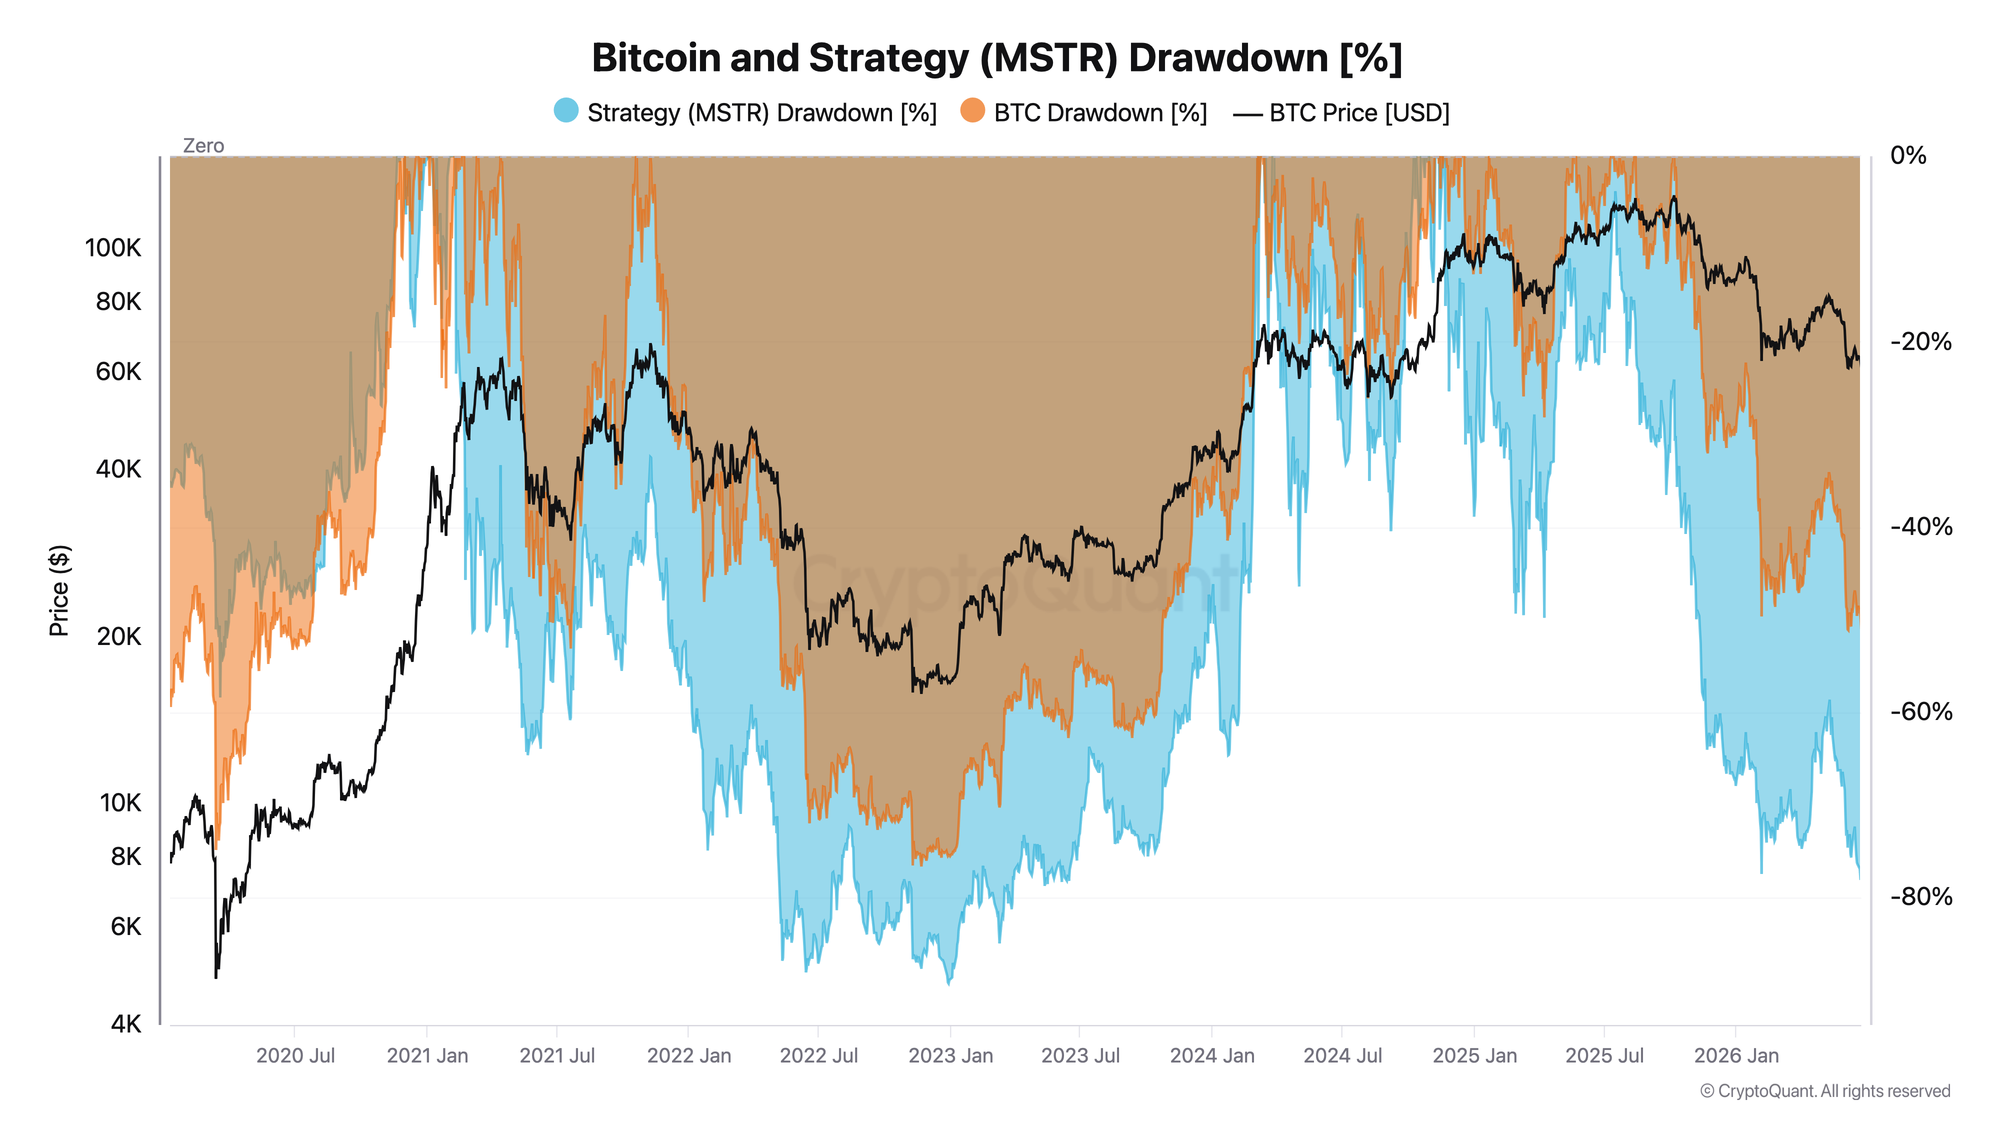
MSTR drawdown (blue) and BTC drawdown (orange) from their highs, in percentage terms.
MSTR is now down -78%, while Bitcoin is down -51% from its peak. That is a deep decline, but it still has not reached the extreme of the previous cycle: at the 2022 bottom, MSTR's drawdown reached -89% versus -77% for BTC. For contrast, during the Covid crash in March 2020 the picture was the opposite - Bitcoin fell harder, down -75%, while MSTR lost less, around -58%, because the company had not yet become a Bitcoin treasury at that point. Since 2021, the blue curve has consistently traded below the orange one - that is exactly what the leverage embedded in MSTR's structure looks like.
The depth of the current drawdown is comparable to past bear phases, but there is still room before the historical bottom at -89%. A capitulation signal in the stock would be an expansion of the drawdown into the -85% to -90% zone.
MSTR-BTC Drawdown Spread
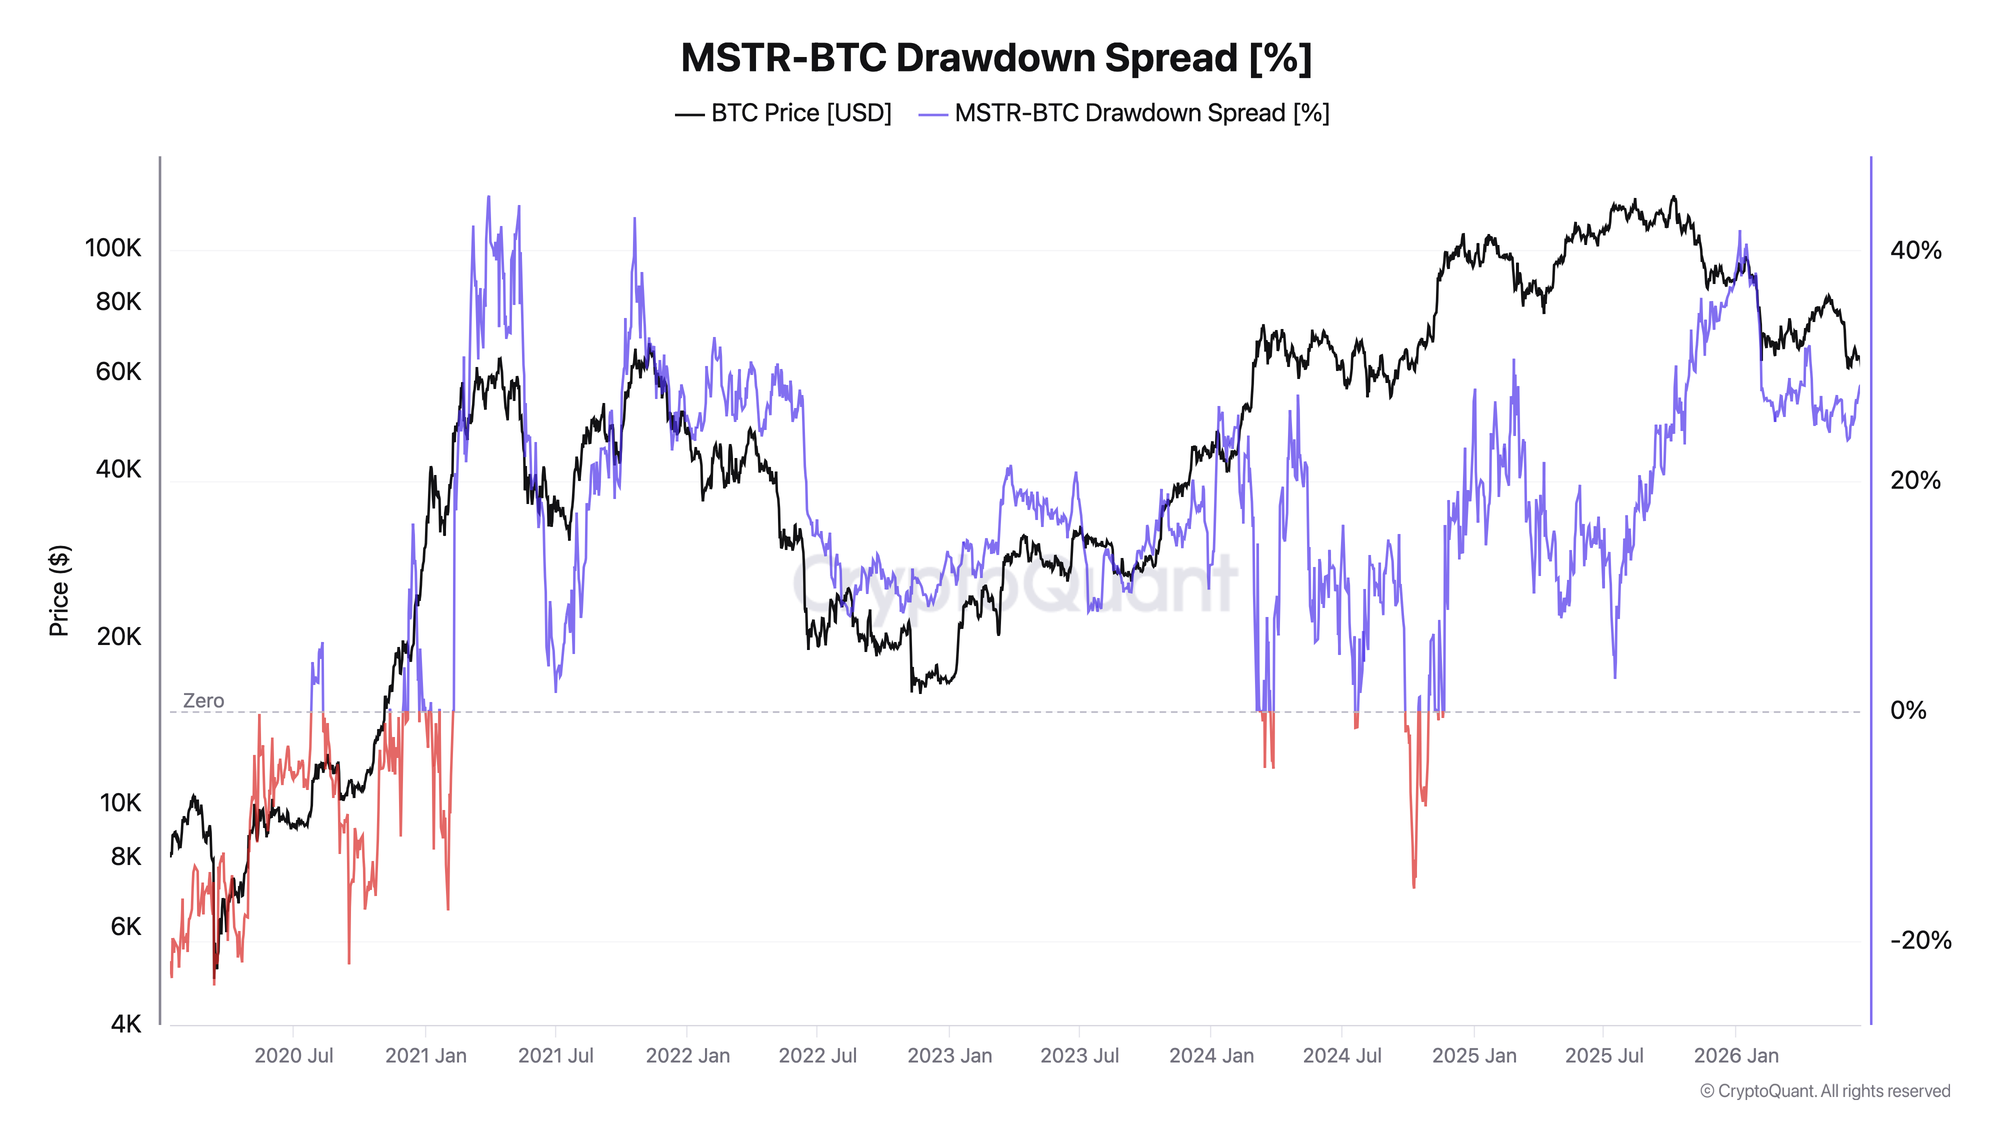
Drawdown spread: positive values mean MSTR has fallen more deeply than BTC, while negative values, marked in red, mean the decline was milder.
The spread is currently holding around +28 percentage points: the stock is underwater by roughly 28 percentage points more than the underlying asset. The red sections of the chart - 2020 and a few episodes in 2024 - were rare periods when MSTR fell less than Bitcoin. But for most of the time since 2021, the spread has remained positive, and it has now climbed back toward the upper end of its historical range.
Conclusion: a high and rising spread means that in a risk-off phase, MSTR acts as a downside amplifier.
Taken together, the three charts show the following picture. The price chart captures the turn lower and BTC's move below the average cost basis of the treasury. The drawdown chart shows the scale of the decline -78% versus -89% at the 2022 bottom. The spread confirms that MSTR's underperformance versus BTC has once again moved toward the upper end of its historical range. But the main issue today is not just the depth of the drawdown, it is the regime shift at the company: weekly BTC purchases have been cut by roughly two-thirds, of the $335.5 million raised through stock sales less than 11% went into Bitcoin, and the rest was directed into a dollar reserve, which stood at $1.4 billion as of June 21. In late May, Strategy also made its first net Bitcoin sale since 2022 - 32 BTC to cover STRC dividend payments (strategy.com/credit, strategy.com/data).
Stop holding through every crash - start your 7-day free trial. Weekly Engine tells you when to stay in, when to step aside, and when risk is rising.
FAQ
Why does Strategy's underwater treasury matter for the BTC market, and not just for MSTR shareholders?
For several years, Strategy has been one of the largest market makers of demand, converting stock issuance into Bitcoin purchases. When the price falls below cost basis and the stock's premium to Bitcoin assets compresses, the ATM issuance mechanism becomes less effective and the largest structural buyer slows down. At that point, the market loses part of its marginal bid.
What trigger separates manageable stress from real pressure on Bitcoin?
As long as the company is covering its obligations through stock sales and its dollar reserve, there is no direct pressure on spot. The breaking point would be a shift from selling stock to systematically selling Bitcoin itself to service preferred dividends and interest on debt. That is when corporate stress would turn into a source of BTC supply.
CONCLUSIONS
The shares of Bitcoin's largest leveraged proxy are down -78%, its treasury has gone underwater for the first time since 2022, and the drawdown spread versus BTC has moved close to extreme levels. Against a backdrop of reduced purchases, the first net BTC sale since 2022, and a growing dollar reserve, the overall regime for the MSTR/BTC relationship remains risk-off. At the same time, the structural risk is still limited: Strategy's debt is now almost entirely convertible and carries no margin-call risk, so the base case is the loss of a marginal buyer and reflexive pressure through premium compression, not a cascading liquidation. The main trigger to watch is a shift from selling stock to selling Bitcoin itself to service preferreds and debt. The main risk is BTC holding below the treasury cost basis of $75K, and a full collapse of MSTR's premium, which would block ATM issuance as a source of liquidity.
Live Charts
Explore the metrics behind this brief with live, auto-updating charts:
Realized Price - Aggregate on-chain cost basis compared with BTC price and long-term trend.
MVRV Ratio - Market value vs realized value to identify valuation regimes and cycle risk.
BTC US ETF Flow Monitor - US spot Bitcoin ETF daily flow, BTC-denominated accumulation, and fund leadership.
Supply in Loss - Share of supply held at a loss to flag stress and capitulation zones.
Fear & Greed Index - Composite market sentiment for risk appetite and sentiment extremes.