
🎧 Morning Brief #198 - audio debate on today’s market setup
A breakdown of BTC’s derivatives setup after the price fell from May’s $81K to $62K. Two oscillators show the same picture from different angles: the aggressive taker demand that had been pushing the market higher has dried up, while liquidation pressure has shifted entirely toward longs.
TL;DR
A brief on how bullish demand has run out and momentum is shifting to sellers: Net Taker has pulled back to zero, while long positions dominate liquidations.
Bitcoin Net Taker Volume Oscillator
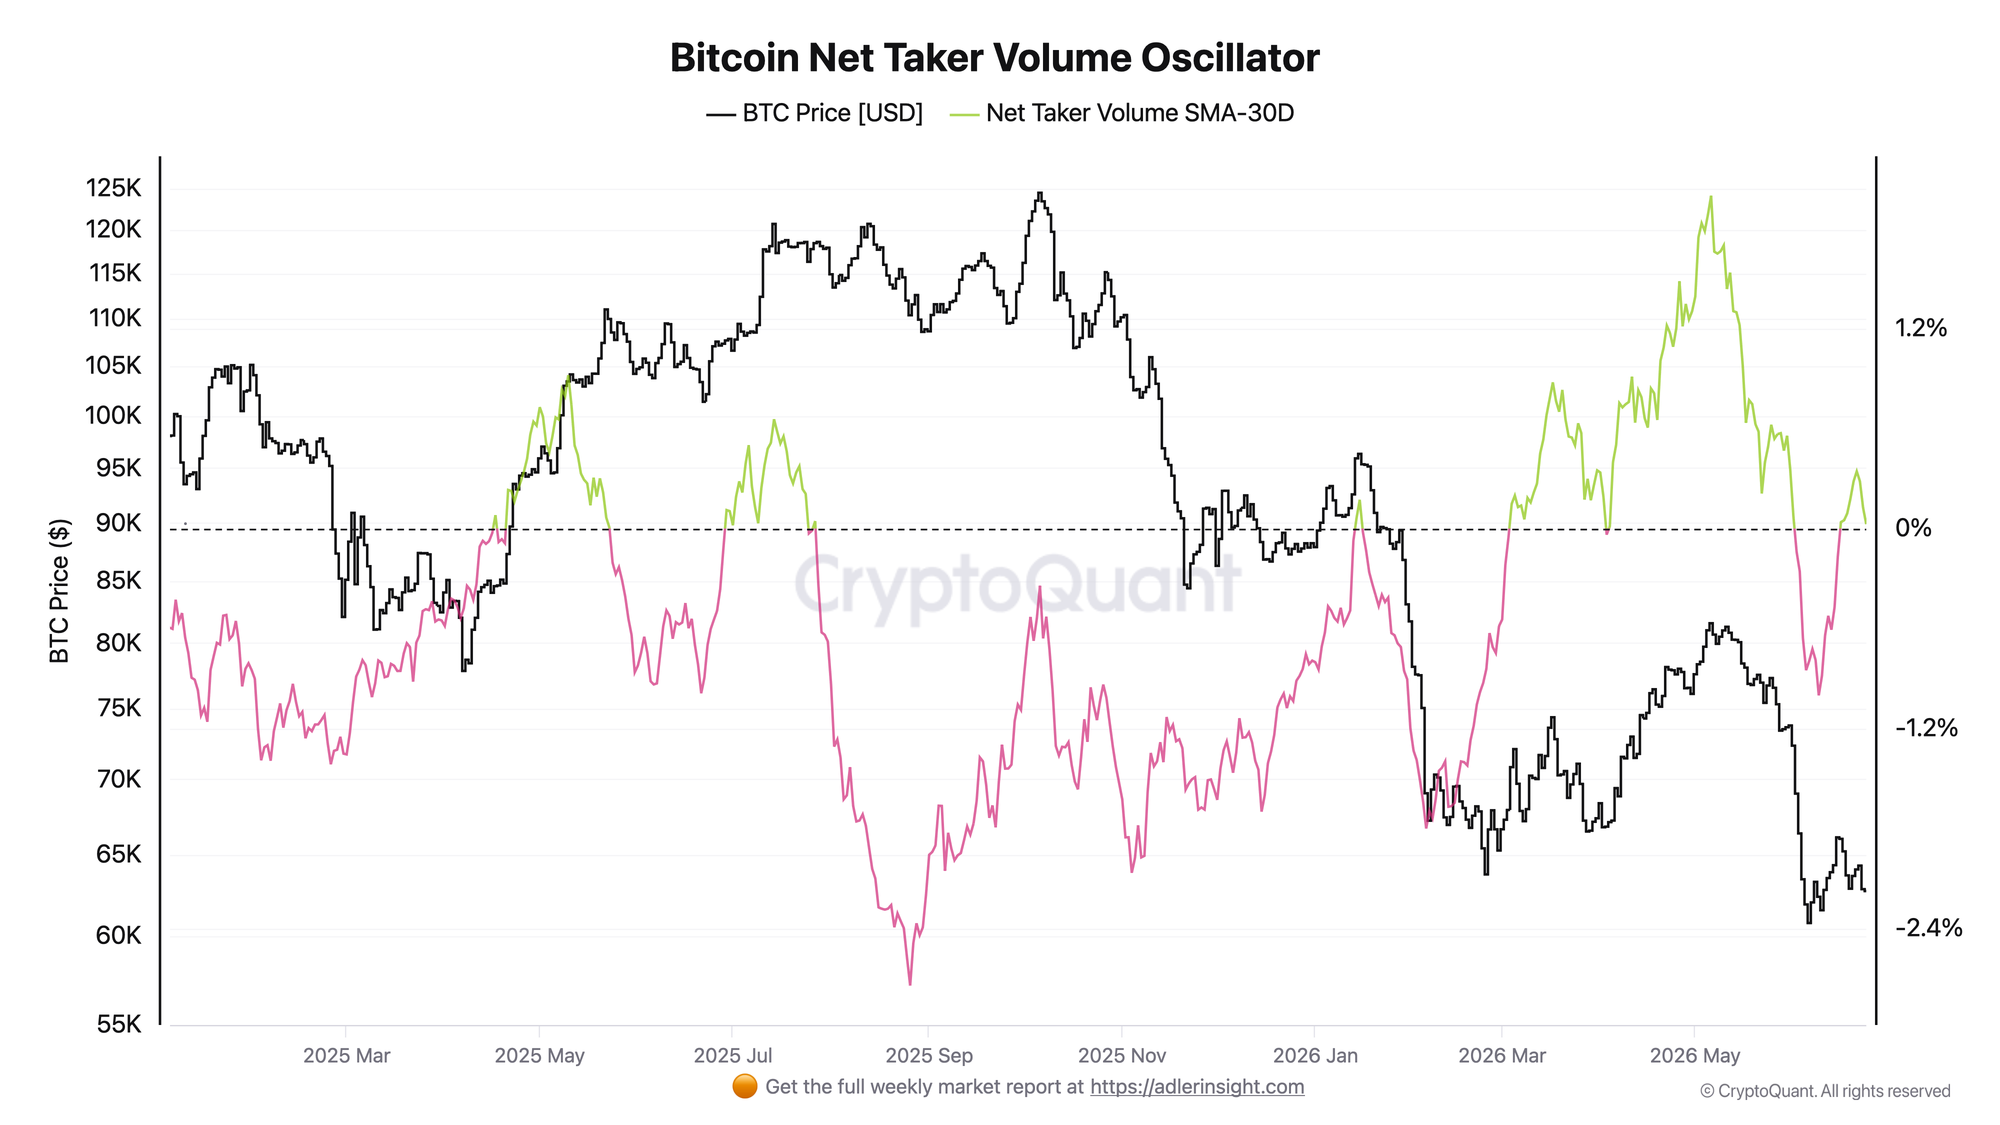
The metric reflects net taker volume - market buys minus market sells - smoothed by a 30-day moving average.
Two months ago, the line was holding firmly in positive territory, and by mid-May it had climbed to a peak of +1.7%. That aggressive demand is what pushed price toward local highs. In early June, during the selloff, the indicator dropped into negative territory to -0.9%, and has now bounced back and stalled right at the zero mark. Over the same period, price moved from $81K to $62K.
As long as Net Taker does not establish itself firmly above zero, there is no bullish fuel in the market. Right now, this is a balance with no initiative from the demand side.
Bitcoin Futures Long Short Liquidations Dominance
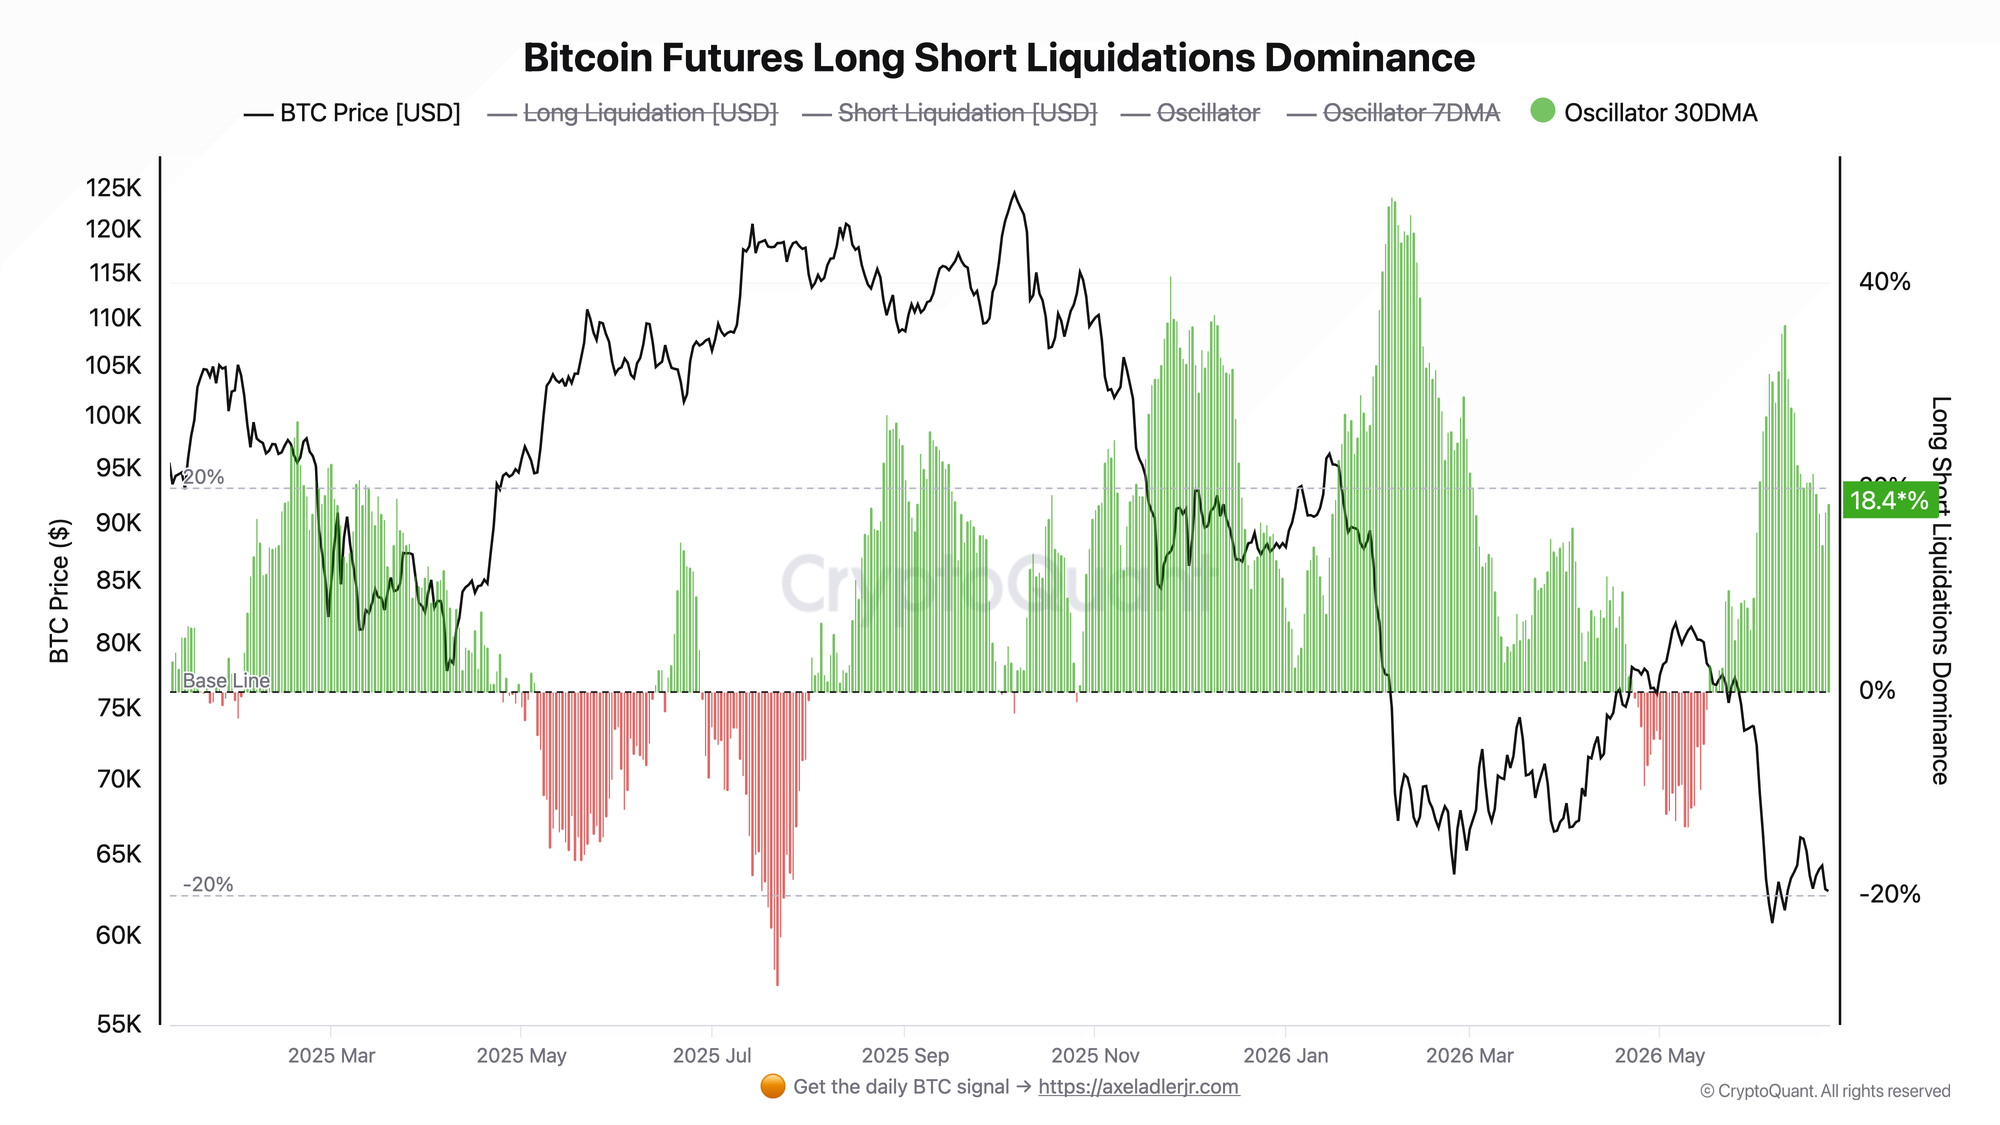
The oscillator shows which side is being liquidated more aggressively. A positive green zone means longs are under the main pressure.
Right now, the indicator is holding firmly in the green zone at +18.4%, meaning long positions are clearly dominating liquidations. The contrast with spring is obvious: as recently as mid-May, the oscillator had moved into negative territory to around -13%, when rising prices were flushing out shorts. After the price drop, the picture flipped, and now it is buyers who are under pressure.
The dominance of long liquidations means the pressure is moving from the top down: every attempt at a rebound is more likely to trap new buyers than trigger a sustainable reversal. As long as the oscillator stays in the green zone, the initiative remains with sellers.
Taken together, these two indicators point to the same picture: taker demand has been wiped out, while long liquidations dominate. There is no bullish fuel, and long positions continue to take the main hit. The key takeaway today is simple: the market has not found a buyer, and the path of least resistance still points lower.
Outperform Buy & Hold with a rules-based strategy - Start free. One weekly action, clear triggers and invalidation levels. No guessing.
FAQ
What does Net Taker returning to zero mean? Market sellers have run out of steam, but an aggressive buyer has still not shown up. This is not a sign of strength, but a state of balance in which the market needs a new catalyst.
What trigger would change the regime? A clear move by Net Taker back above zero together with the liquidation oscillator returning to the baseline would signal that demand is recovering. The opposite scenario - the green zone holding in long liquidations while taker volume slips back into negative territory - would point to further downside.
CONCLUSIONS
The derivatives picture after the move down to $62K reads clearly enough: bullish demand has been wiped out - Net Taker is stuck around zero after its spring peak - while long liquidations still dominate, with the oscillator holding in the green zone at +18.4%. Buyers have not returned to the market, and long positions continue to be flushed out. In this setup, empty demand combined with dominant long liquidations leaves room for the market to move lower. The current regime is neutral with a bearish tilt. Fuel is now on the side of the shorts. The main reversal trigger is a sustainably positive Net Taker alongside normalized liquidations. The main risk is continued pressure on longs together with another move by taker volume back into negative territory, which would open the door to lower levels.
Live Charts
Explore the metrics behind this brief with live, auto-updating charts:
Funding Rates - Perpetual futures funding to track long-side or short-side leverage pressure.
Open Interest (BTC) - Total futures positioning and 7-day BTC-denominated change.
Coinbase Premium Index - Coinbase vs global market premium as a proxy for US spot demand pressure.
Fear & Greed Index - Composite market sentiment for risk appetite and sentiment extremes.
BTC US ETF Flow Monitor - US spot Bitcoin ETF daily flow, BTC-denominated accumulation, and fund leadership.