
🎧 Morning Brief #197 - audio debate on today’s market setup
Price pulled back to the $62K level, and the market has moved back into unrealized loss. The two charts separate price pain from real capital outflow: aNUPL shows how painful the current price is for holders, while Realized Cap Drawdown shows which group is actually seeing its invested capital shrink.
TL;DR
This brief is about short-term holders moving into loss while capital inside the STH group is shrinking sharply. At the same time, the LTH group shows almost no drawdown. The logic is simple: the pain is real, but it is concentrated in weak hands. The market structure does not yet look like a full cycle-wide capitulation.
Bitcoin Adjusted Net Unrealized Profit/Loss
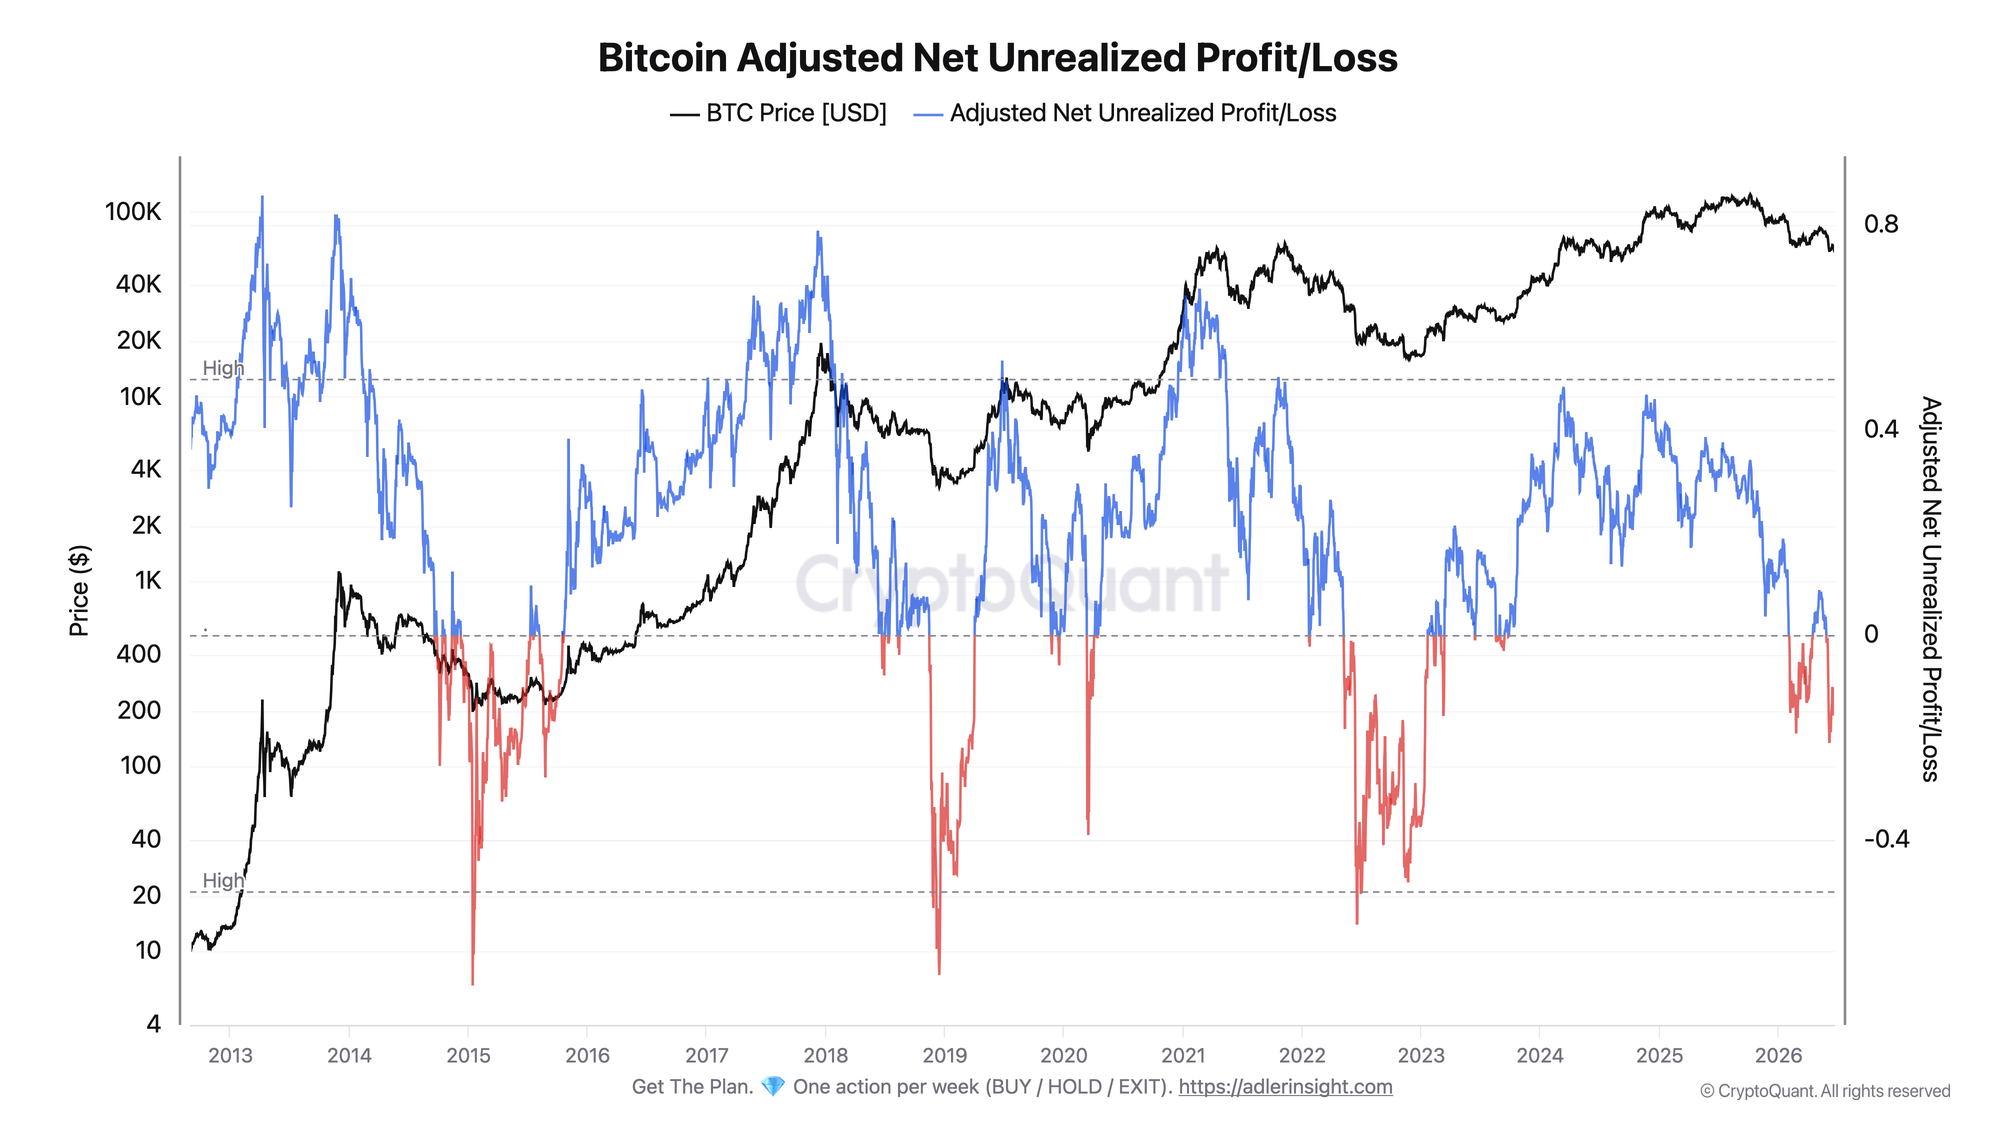
The aNUPL metric shows whether the market is, on average, in unrealized profit or unrealized loss.
The aNUPL line broke below zero and stayed in negative territory. The current value is -0.14 versus a level near zero one month ago. Roughly half of the last three months have been spent below zero, meaning the market did not simply touch the loss zone briefly, but has been under pressure for a sustained period. At the same time, the metric has not yet reached the deep capitulation extremes of past cycles, where aNUPL moved toward the -0.4 zone.
This means price is already painful for the market, but the pain is not yet extreme by the standards of previous cycles. A deterioration in the regime would be confirmed by a move in aNUPL toward -0.3 and below.
Bitcoin STH vs LTH Realized Cap Drawdown
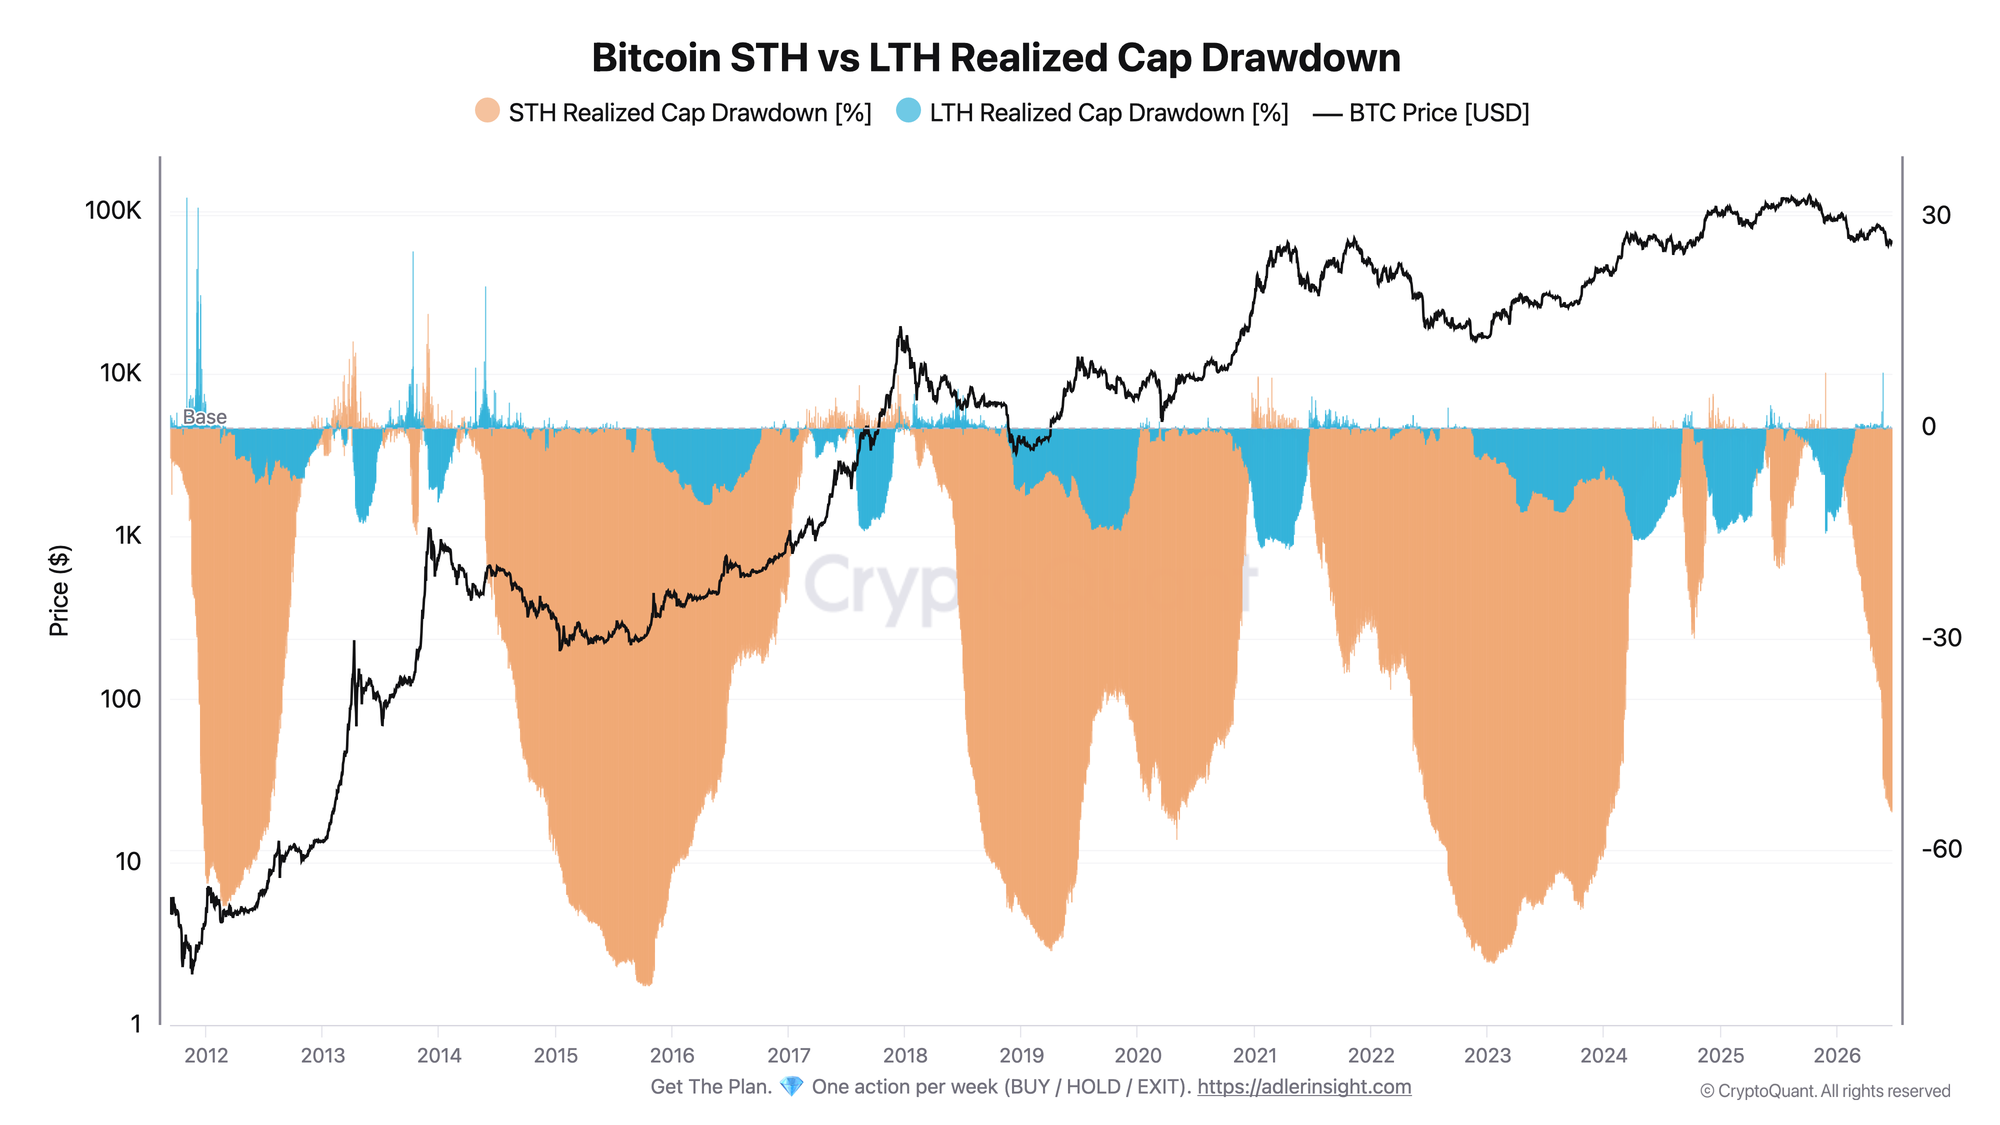
Realized Cap Drawdown shows how far the amount of money invested in each group’s coins has fallen from its peak. STH and LTH are tracked separately.
STH Realized Cap Drawdown has deepened to -56%. Three months ago, it was at the -26% level. This is a major deterioration: capital is actually leaving the STH group. The orange area has expanded sharply lower, confirming capitulation among weak hands.
Against this backdrop, LTH Realized Cap Drawdown remains near zero. This is an important part of the signal: stress is present, but it has not yet turned into a mass capital exit from the LTH group.
The second chart explains the first one. Negative aNUPL is not the result of even capitulation across the whole market, but mainly of sharp compression in STH. The key point today: the pain is targeted, weak hands are exiting, but the LTH group is still holding up.
Reading the signal is not enough - you need to act on it. Weekly Engine turns on-chain data into one clear decision per week, with risk caps and invalidation built in. Start free.
FAQ
Why look at NUPL and Realized Cap Drawdown together?
NUPL shows how painful the current price is. Realized Cap Drawdown shows whether capital is actually leaving a specific group. Together, they separate simple price pain from real capitulation.
What would trigger a regime shift?
A move in LTH Realized Cap Drawdown noticeably below zero would mean stress has become deeper and moved beyond weak hands. A return of aNUPL above zero, on the other hand, would confirm that pressure is easing.
CONCLUSIONS
The combination of the two charts shows targeted stress. aNUPL below zero confirms unrealized losses, while Realized Cap Drawdown clarifies exactly where capital is shrinking. Right now, the main hit is in STH: the drawdown is -56%. LTH, meanwhile, remains close to zero.
This is a risk-off regime, but not full capitulation. The pressure is real, weak hands are exiting, but the market structure is still holding. The main trigger for deterioration is a move in LTH Realized Cap Drawdown noticeably below zero. The main risk is a prolonged hold of aNUPL in negative territory, because extended pain gradually transfers exhaustion from weak hands to the more resilient part of the market.
Live Charts
Explore the metrics behind this brief with live, auto-updating charts:
NUPL - Net unrealized profit/loss across holders, mapped into cycle sentiment phases.
STH-SOPR - Short-term holder profit/loss behavior around the 1.0 breakeven threshold.
Realized Price - Aggregate on-chain cost basis compared with BTC price and long-term trend.
MVRV Ratio - Market value vs realized value to identify valuation regimes and cycle risk.
Fear & Greed Index - Composite market sentiment for risk appetite and sentiment extremes.