
🎧 Morning Brief #196 - audio debate on today’s market setup
Price is consolidating around $64K after pulling back from the October highs, and the main question now is simple: is a bottom forming. Two on-chain views give different answers. Long-term holder realized supply is moving toward the levels where bottoms have historically formed, but the sales pressure indicator, which captures final capitulation, has not produced a signal for a record-long period.
TL;DR
This brief looks at whether the current phase resembles bottom formation. LTH supply is maturing in the right direction, but the capitulation stress that confirmed previous cycle-bottom zones is still absent.
Bitcoin LTH Realized Supply (Total)
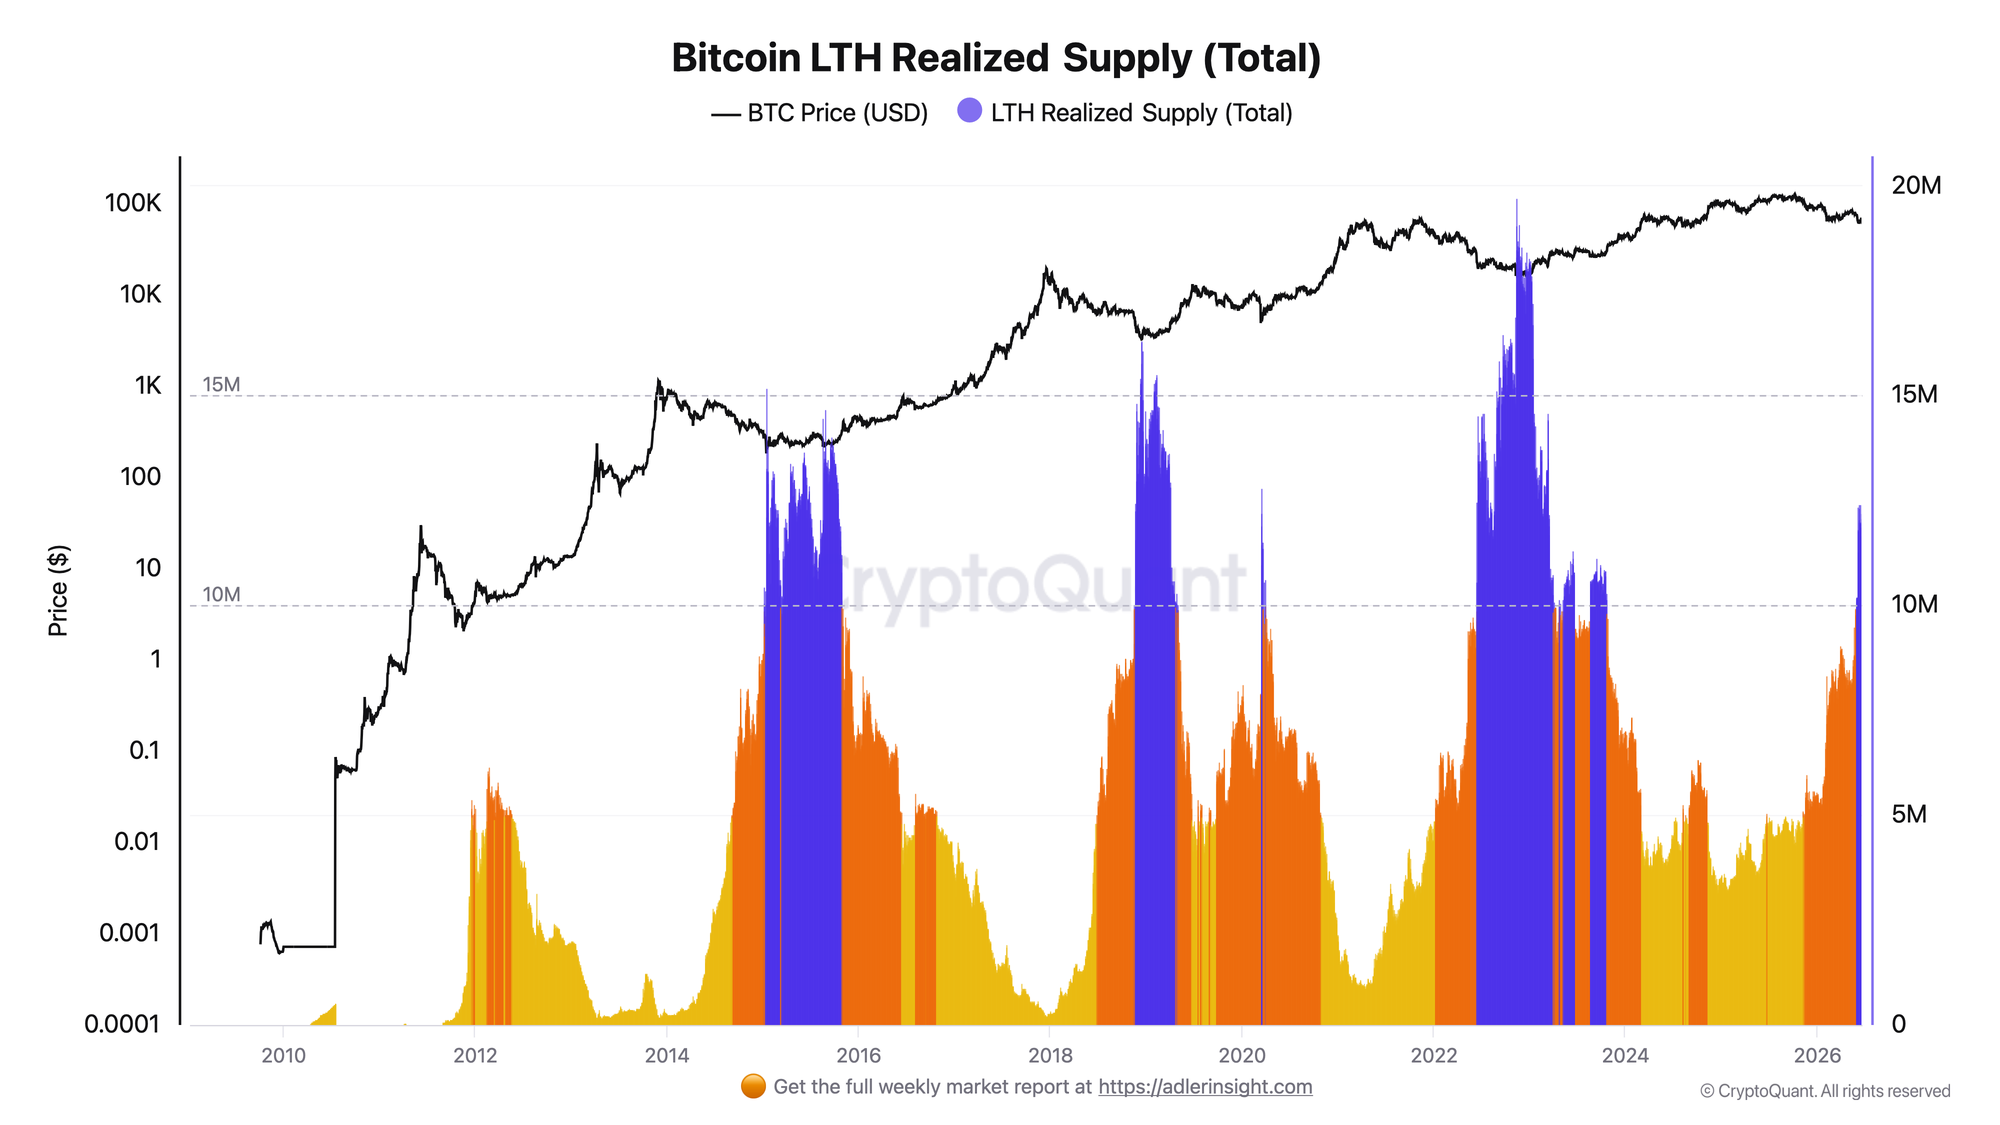
The metric reflects the total realized supply of coins that have matured into the long-term holder cohort. Historically, strong spikes in this indicator occurred during cycle-bottom phases.
The metric is currently at 12.17M. In early June, it reached a local cycle high of 12.42M, then declined slightly, but remained in a zone of strong year-over-year growth. Over the past year, LTH Realized Supply has more than doubled, pointing to active supply maturation and a transition of coins into a more resilient holder cohort.
However, the current zone is still below the levels seen during previous bear-market capitulation phases. At the 2015 bottom, the metric was around 15M. At the 2018-19 bottom, it was around 16M. At the 2022-23 bottom, it was around 19.7M.
Conclusion: supply maturation is moving in the right direction, but the confirmation threshold has not been reached yet. A stronger signal would appear if the metric moves into the 15M+ zone, where supply maturation coincided with seller exhaustion in previous cycles.
Bitcoin: Sales Pressure
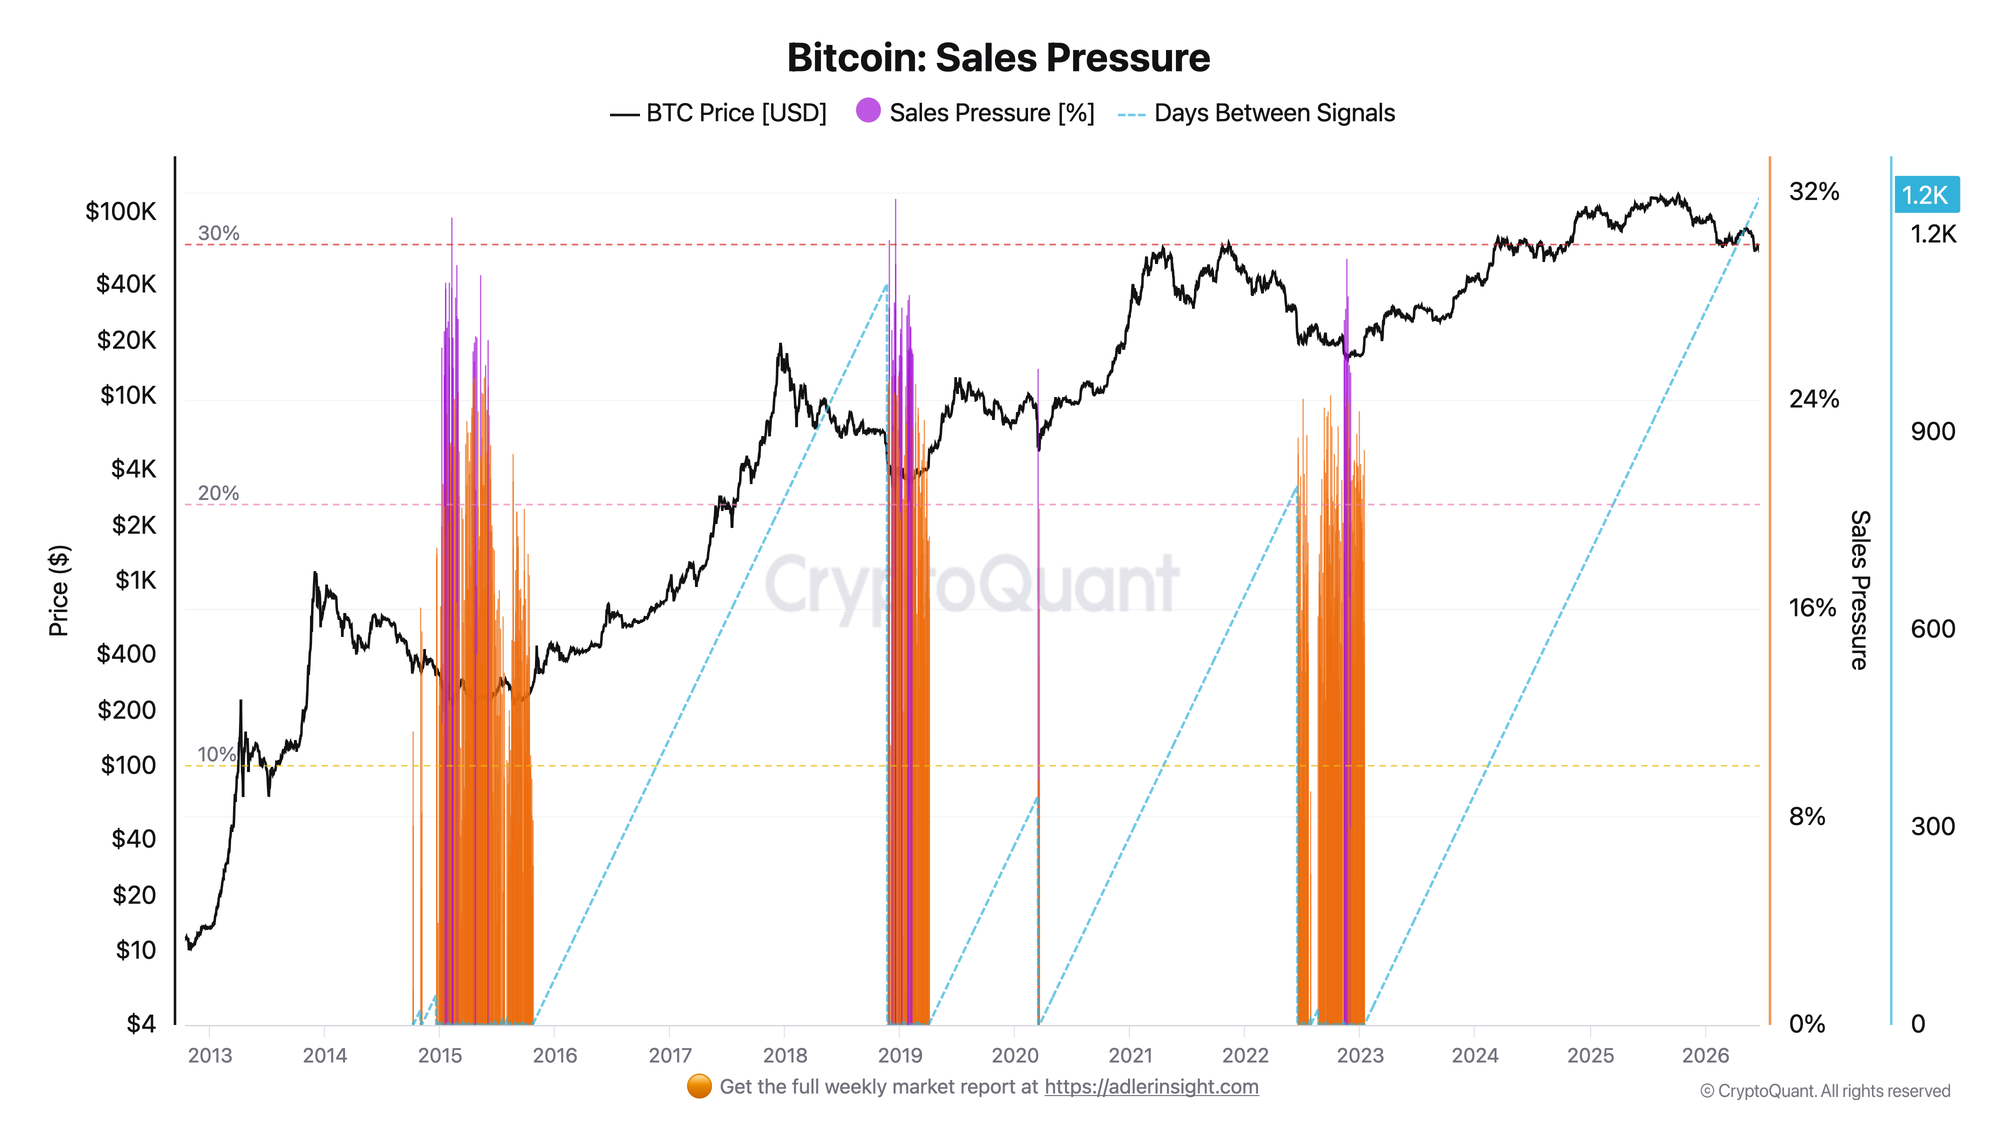
The metric only activates when NUPL is negative, meaning the market as a whole is in loss, and it measures SOPR deviation from one. That is why it lights up specifically during stress phases, when selling happens through realized losses.
Right now, the metric has not activated, and the counter of days without a signal has reached 1256. This is the longest period in Bitcoin’s entire history. The last signal was on January 13, 2023, in the final stage of the previous bear-market cycle.
All previous clusters came with series of sales pressure signals. In 2015, 2018-19, 2020, and 2022, peaks ranged from 15% to almost 32%. The historical maximum was around 32% in December 2018, right in the cycle-bottom zone.
Connection
The LTH Realized Supply chart points to supply maturation toward a cycle-bottom structure. But the Sales Pressure chart does not confirm it: final capitulation stress has been absent for 1256 days.
This is the main divergence in the current market. Formal signs of "looks like a bottom" are present only on the supply side, while the capitulation indicator remains silent. That is why the current structure looks more like a phase of holding and supply maturation without a final stress signal.
Protect capital first. Capture upside second - start 7 days free. Built for long-term investors who want performance, not stress.
FAQ
If LTH supply is rising like in previous cycles, why is this not a bottom yet? Because supply maturation is only half of the pattern. In previous cycles, it was accompanied by capitulation: negative NUPL and series of sales pressure signals. That second half is missing now.
What would trigger a regime change? NUPL moving into negative territory and a Sales Pressure signal appearing. That would activate the capitulation scenario. On the supply side, the key threshold is LTH Realized Supply moving into the 15M+ zone.
CONCLUSIONS
The picture remains mixed. Long-term holder realized supply is maturing toward a bottom-formation structure: it is now at 12.17M versus 15-20M in previous cycles. But the sales pressure indicator has not produced a signal for 1256 days.
By the classic standards of 2015, 2018, and 2022, this is not a capitulation bottom. The market is in a phase of holding and supply maturation. The main trigger for change is LTH Realized Supply moving into the 15M+ zone together with the first non-zero Sales Pressure signal in more than three years.
Live Charts
Explore the metrics behind this brief with live, auto-updating charts:
NUPL - Net unrealized profit/loss across holders, mapped into cycle sentiment phases.
SOPR - Spent Output Profit Ratio shows whether moved coins realize profit or loss.
STH-SOPR - Short-term holder profit/loss behavior around the 1.0 breakeven threshold.
Realized Price - Aggregate on-chain cost basis compared with BTC price and long-term trend.
MVRV Ratio - Market value vs realized value to identify valuation regimes and cycle risk.