


🎧 Morning Brief #195 - Deep Dive
Today we are looking at two slices of the market: where the price support sits based on the adjusted realized cost basis, and whether fresh capital is entering the network. Price is holding above key support, but there is no fuel for growth from new demand.
TL;DR
Price is compressing toward Adjusted Realized Price as the main support zone, while the change in new capital inflow has turned negative. For now, the market is being held by old hands, not fresh demand.
Bitcoin Adjusted Realized Price
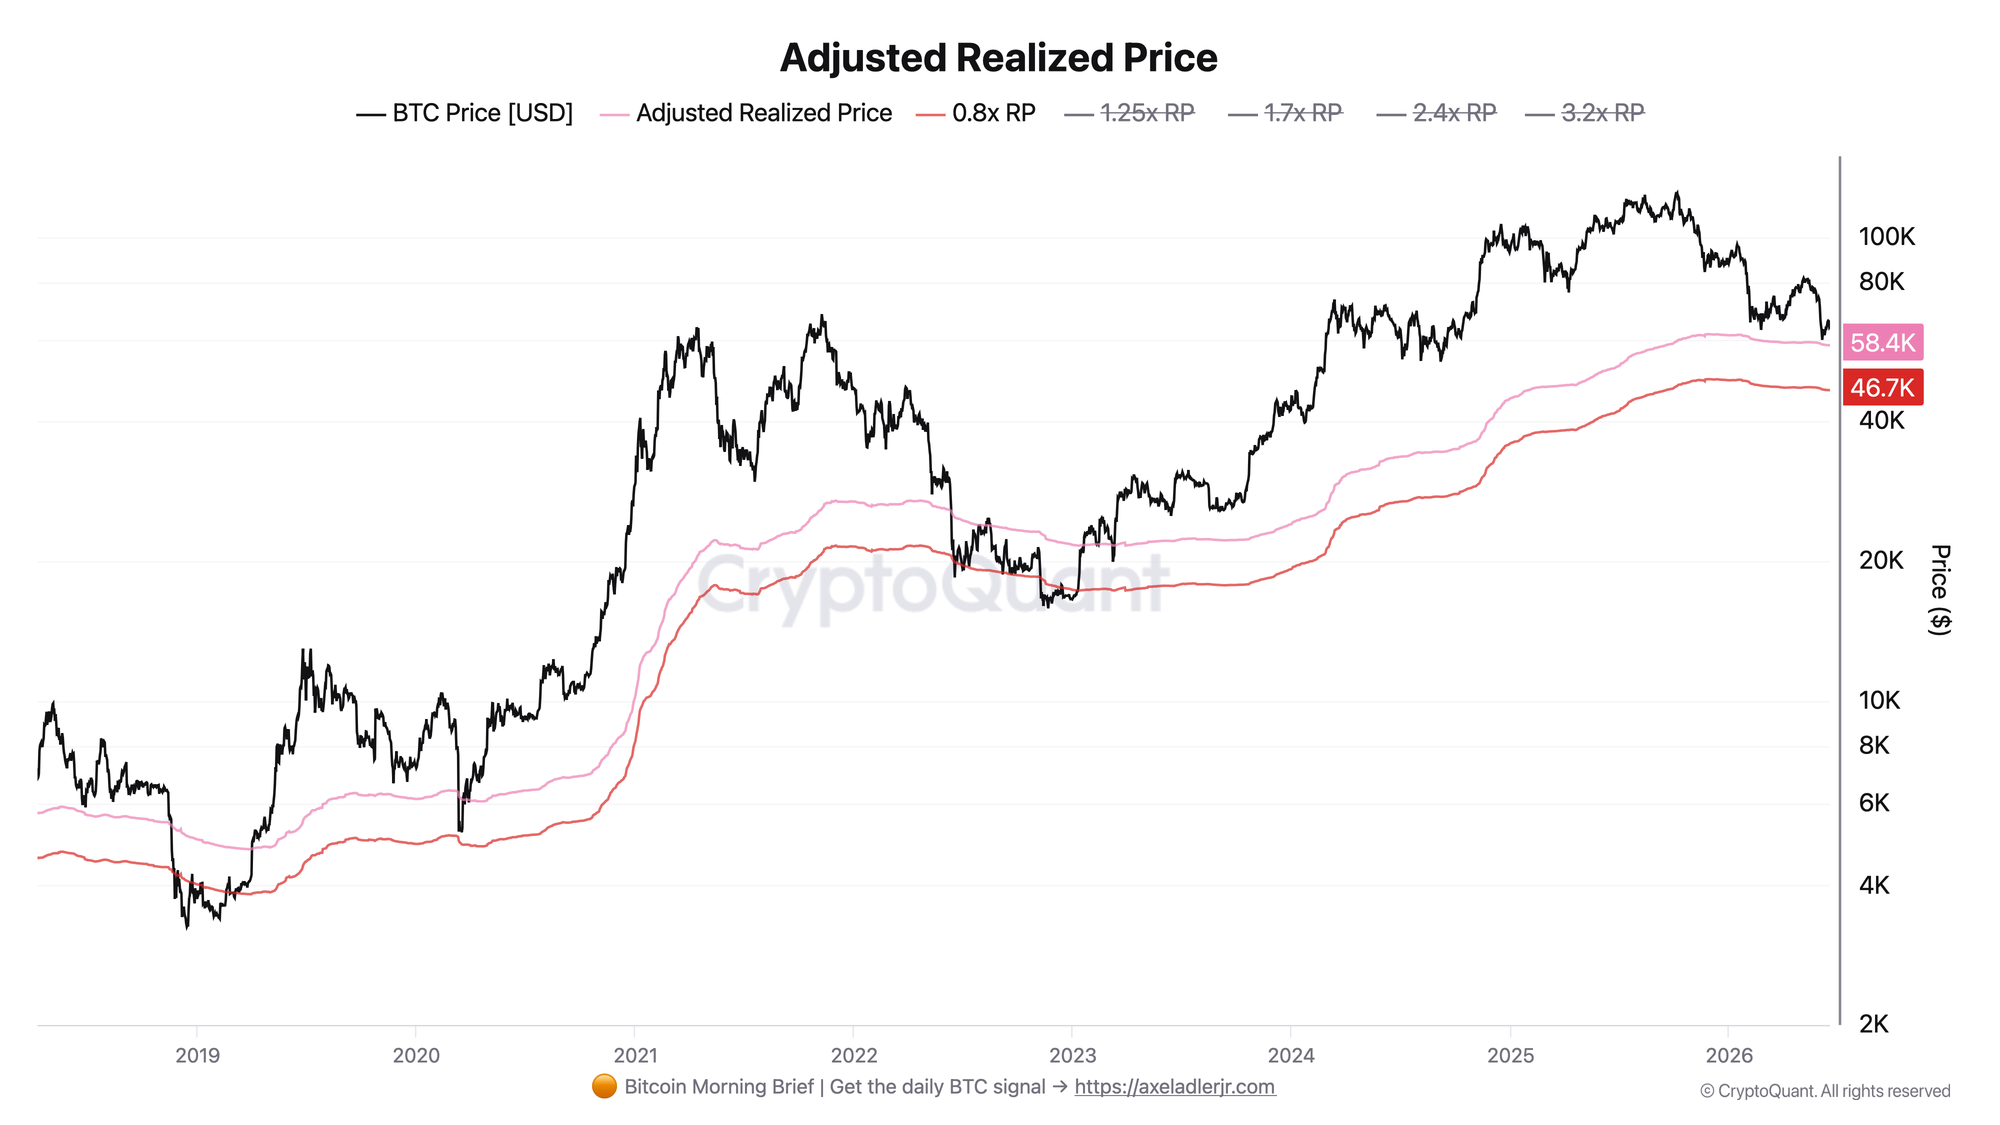
The metric shows the adjusted average acquisition price of coins and its derivative ranges.
BTC price has dropped to $62K and is compressing toward the Adjusted Realized Price line at $58.4K. This is now the nearest key support. Below it sits the 0.8x Adjusted Realized Price band at $46.7K - the next support level, where the market has historically fallen during capitulation phases.
As long as price remains above Adjusted Realized Price, the structure looks like a support test. Holding $58.4K keeps the market structure constructive. A confirmed break below this level would open the path toward $46.7K.
Bitcoin New Investor Flow
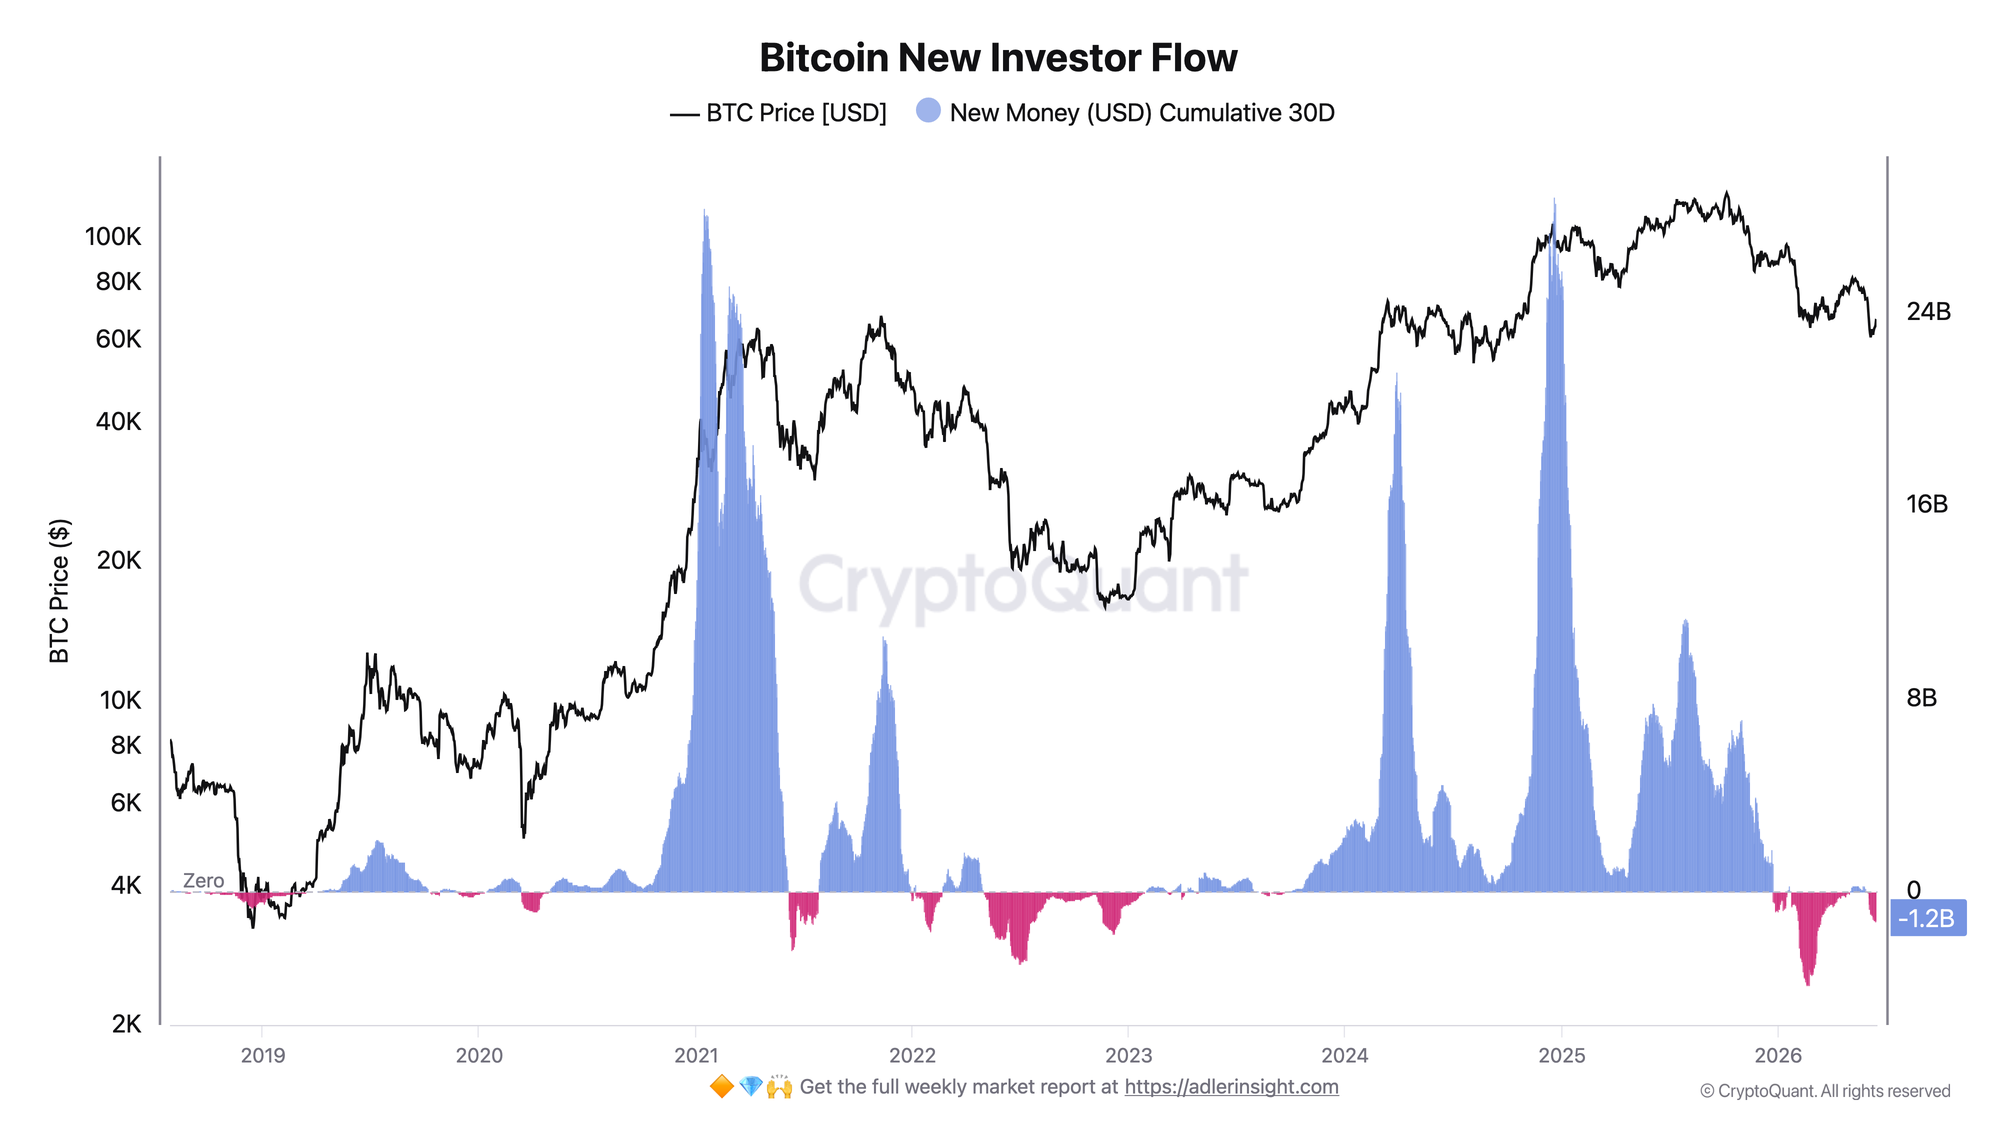
The metric estimates new capital inflow through the change in Realized Cap, weighted by the share of young coins. This is not a direct cash flow, but a proxy for measuring new demand activity.
New Money 30D Cumulative has moved into negative territory and is holding around -$1.2 billion. This looks like a persistent lack of inflow. The blue spikes from previous bull phases have been replaced by a red zone: fresh capital is not entering the network, and the current move is mostly being supported by participants who are already in the market.
This is an important signal. Without New Investor Flow returning to positive territory, the market has no external fuel for a confident move away from support. That means any rebound from Adjusted Realized Price without new inflow remains weak and unconfirmed.
The connection is simple: the second chart explains the pressure visible in the first one. Without fresh demand, price has nothing strong enough to push it decisively away from Adjusted Realized Price. That is why the $58.4K line is the key dividing line in the current structure.
Invest in Bitcoin without emotional decisions - Start free. Deterministic signals built to remove fear, FOMO, and panic selling.
FAQ
Why is Adjusted Realized Price more important than a regular moving average? Because it reflects not just price movement, but the cost basis of coins in the network. A break below this level means the market is moving below an important on-chain cost basis, and that changes holder behavior more strongly than a break of a regular technical level.
What would signal a regime change?
A strong improvement signal would be New Investor Flow returning to positive territory while $58.4K holds. The negative scenario is price confirming below Adjusted Realized Price and moving toward the 0.8x RP band at $46.7K.
CONCLUSIONS
The two charts tell the same story: price is leaning on Adjusted Realized Price ($58.4K), but the estimate of new capital inflow remains negative (-$1.2 billion). That means support is still being held by old hands, not fresh demand. The market does not look panicked, but it also has no fuel for sustainable growth right now. The main trigger for improvement is New Investor Flow returning to positive territory while $58.4K holds. The main risk is losing this level, which would open the path toward 0.8x RP at $46.7K.
Live Charts
Explore the metrics behind this brief with live, auto-updating charts:
Realized Price Bands - Dynamic realized-price valuation zones from live BTC price and on-chain cost basis.
Realized Price - Aggregate on-chain cost basis compared with BTC price and long-term trend.
MVRV Ratio - Market value vs realized value to identify valuation regimes and cycle risk.
STH-SOPR - Short-term holder profit/loss behavior around the 1.0 breakeven threshold.
Coinbase Premium Index - Coinbase vs global market premium as a proxy for US spot demand pressure.